

Portfolio report - Mangaung.co.za
Portfolio report - Mangaung.co.za
Portfolio report - Mangaung.co.za

Create successful ePaper yourself
Turn your PDF publications into a flip-book with our unique Google optimized e-Paper software.
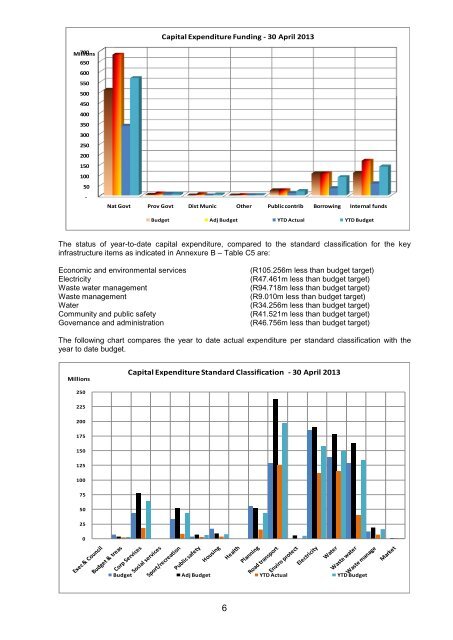
Capital Expenditure Funding - 30 April 2013<br />
Millions 700<br />
650<br />
600<br />
550<br />
500<br />
450<br />
400<br />
350<br />
300<br />
250<br />
200<br />
150<br />
100<br />
50<br />
-<br />
Nat Govt Prov Govt Dist Munic Other Public <strong>co</strong>ntrib Borrowing Internal funds<br />
Budget Adj Budget YTD Actual YTD Budget<br />
The status of year-to-date capital expenditure, <strong>co</strong>mpared to the standard classification for the key<br />
infrastructure items as indicated in Annexure B – Table C5 are:<br />
E<strong>co</strong>nomic and environmental services<br />
Electricity<br />
Waste water management<br />
Waste management<br />
Water<br />
Community and public safety<br />
Governance and administration<br />
(R105.256m less than budget target)<br />
(R47.461m less than budget target)<br />
(R94.718m less than budget target)<br />
(R9.010m less than budget target)<br />
(R34.256m less than budget target)<br />
(R41.521m less than budget target)<br />
(R46.756m less than budget target)<br />
The following chart <strong>co</strong>mpares the year to date actual expenditure per standard classification with the<br />
year to date budget.<br />
Millions<br />
Capital Expenditure Standard Classification - 30 April 2013<br />
250<br />
225<br />
200<br />
175<br />
150<br />
125<br />
100<br />
75<br />
50<br />
25<br />
0<br />
Budget Adj Budget YTD Actual YTD Budget<br />
6


