

Portfolio report - Mangaung.co.za
Portfolio report - Mangaung.co.za
Portfolio report - Mangaung.co.za

Create successful ePaper yourself
Turn your PDF publications into a flip-book with our unique Google optimized e-Paper software.
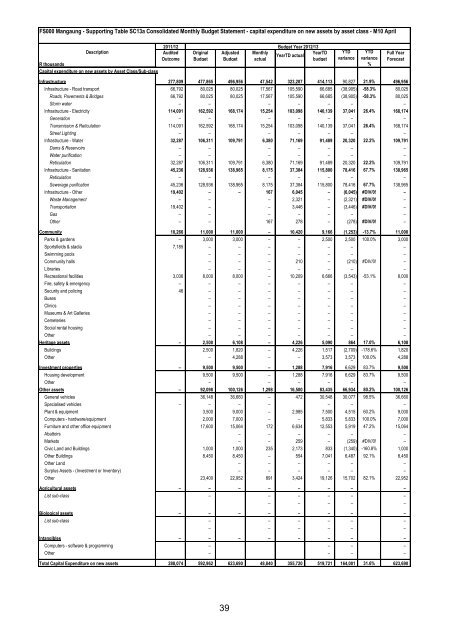
FS000 <strong>Mangaung</strong> - Supporting Table SC13a Consolidated Monthly Budget Statement - capital expenditure on new assets by asset class - M10 April<br />
2011/12 Budget Year 2012/13<br />
Description<br />
Audited Original Adjusted Monthly<br />
YearTD YTD YTD<br />
YearTD actual<br />
Out<strong>co</strong>me Budget Budget actual<br />
budget variance variance<br />
R thousands %<br />
Capital expenditure on new assets by Asset Class/Sub-class<br />
Full Year<br />
Forecast<br />
Infrastructure 277,809 477,865 496,956 47,542 323,287 414,113 90,827 21.9% 496,956<br />
Infrastructure - Road transport 66,792 80,025 80,025 17,567 105,590 66,685 (38,905) -58.3% 80,025<br />
Roads, Pavements & Bridges 66,792 80,025 80,025 17,567 105,590 66,685 (38,905) -58.3% 80,025<br />
Storm water – – – – – – –<br />
Infrastructure - Electricity 114,091 162,592 168,174 15,254 103,098 140,139 37,041 26.4% 168,174<br />
Generation – – – – – – –<br />
Transmission & Reticulation 114,091 162,592 168,174 15,254 103,098 140,139 37,041 26.4% 168,174<br />
Street Lighting – – – – – – –<br />
Infrastructure - Water 32,287 106,311 109,791 6,380 71,169 91,489 20,320 22.2% 109,791<br />
Dams & Reservoirs – – – – – – –<br />
Water purification – – – – – – –<br />
Reticulation 32,287 106,311 109,791 6,380 71,169 91,489 20,320 22.2% 109,791<br />
Infrastructure - Sanitation 45,236 128,936 138,965 8,175 37,384 115,800 78,416 67.7% 138,965<br />
Reticulation – – – – – – –<br />
Sewerage purification 45,236 128,936 138,965 8,175 37,384 115,800 78,416 67.7% 138,965<br />
Infrastructure - Other 19,402 – – 167 6,045 – (6,045) #DIV/0! –<br />
Waste Management – – – 2,321 – (2,321) #DIV/0! –<br />
Transportation 19,402 – – 3,446 – (3,446) #DIV/0! –<br />
Gas – – – – – – –<br />
Other – – 167 278 – (278) #DIV/0! –<br />
Community 10,266 11,000 11,000 – 10,420 9,166 (1,253) -13.7% 11,000<br />
Parks & gardens – 3,000 3,000 – – 2,500 2,500 100.0% 3,000<br />
Sportsfields & stadia 7,185 – – – – – – –<br />
Swimming pools – – – – – – –<br />
Community halls – – – 210 – (210) #DIV/0! –<br />
Libraries – – – – – – –<br />
Recreational facilities 3,036 8,000 8,000 – 10,209 6,666 (3,543) -53.1% 8,000<br />
Fire, safety & emergency – – – – – – – –<br />
Security and policing 46 – – – – – – –<br />
Buses – – – – – – –<br />
Clinics – – – – – – –<br />
Museums & Art Galleries – – – – – – –<br />
Cemeteries – – – – – – –<br />
Social rental housing – – – – – – –<br />
Other – – – – – – –<br />
Heritage assets – 2,500 6,108 – 4,226 5,090 864 17.0% 6,108<br />
Buildings 2,500 1,820 – 4,226 1,517 (2,709) -178.6% 1,820<br />
Other – 4,288 – – 3,573 3,573 100.0% 4,288<br />
–<br />
Investment properties – 9,500 9,500 – 1,288 7,916 6,629 83.7% 9,500<br />
Housing development 9,500 9,500 – 1,288 7,916 6,629 83.7% 9,500<br />
Other – – – – – –<br />
Other assets – 92,098 100,126 1,298 16,500 83,435 66,934 80.2% 100,126<br />
General vehicles 36,148 36,660 – 472 30,548 30,077 98.5% 36,660<br />
Specialised vehicles – – – – – – –<br />
Plant & equipment 3,500 9,000 – 2,985 7,500 4,515 60.2% 9,000<br />
Computers - hardware/equipment 2,000 7,000 – – 5,833 5,833 100.0% 7,000<br />
Furniture and other office equipment 17,600 15,064 172 6,634 12,553 5,919 47.2% 15,064<br />
Abattoirs – – – – – –<br />
Markets – – 259 – (259) #DIV/0! –<br />
Civic Land and Buildings 1,000 1,000 235 2,173 833 (1,340) -160.8% 1,000<br />
Other Buildings 8,450 8,450 – 554 7,041 6,487 92.1% 8,450<br />
Other Land – – – – – –<br />
Surplus Assets - (Investment or Inventory) – – – – – –<br />
Other 23,400 22,952 891 3,424 19,126 15,702 82.1% 22,952<br />
Agricultural assets – – – – – – – –<br />
List sub-class – – – – – –<br />
– – – – –<br />
Biological assets – – – – – – – –<br />
List sub-class – – – – – –<br />
– – – – – –<br />
Intangibles – – – – – – – –<br />
Computers - software & programming – – – –<br />
Other – – – –<br />
Total Capital Expenditure on new assets 288,074 592,962 623,690 48,840 355,720 519,721 164,001 31.6% 623,690<br />
39


