

Portfolio report - Mangaung.co.za
Portfolio report - Mangaung.co.za
Portfolio report - Mangaung.co.za

Create successful ePaper yourself
Turn your PDF publications into a flip-book with our unique Google optimized e-Paper software.
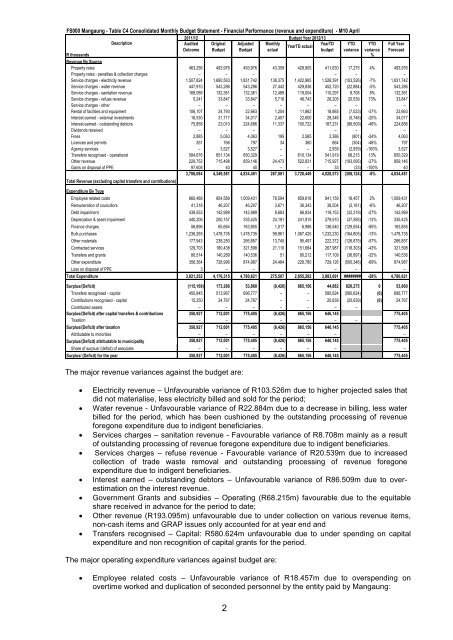
FS000 <strong>Mangaung</strong> - Table C4 Consolidated Monthly Budget Statement - Financial Performance (revenue and expenditure) - M10 April<br />
2011/12<br />
Budget Year 2012/13<br />
Description<br />
Audited Original Adjusted Monthly<br />
YearTD YTD YTD Full Year<br />
YearTD actual<br />
Out<strong>co</strong>me Budget Budget actual<br />
budget variance variance Forecast<br />
R thousands %<br />
Revenue By Source<br />
Property rates 463,256 493,976 493,976 43,359 428,905 411,630 17,275 4% 493,976<br />
Property rates - penalties & <strong>co</strong>llection charges – – – – – –<br />
Service charges - electricity revenue 1,507,824 1,690,563 1,831,742 138,375 1,422,865 1,526,391 (103,526) -7% 1,831,742<br />
Service charges - water revenue 447,910 543,286 543,286 27,442 429,836 452,720 (22,884) -5% 543,286<br />
Service charges - sanitation revenue 168,086 132,361 132,361 12,489 119,004 110,297 8,708 8% 132,361<br />
Service charges - refuse revenue 5,241 33,847 33,847 5,716 48,743 28,205 20,539 73% 33,847<br />
Service charges - other – – – – – – – –<br />
Rental of facilities and equipment 106,107 24,793 22,663 1,204 11,862 18,885 (7,023) -37% 22,663<br />
Interest earned - external investments 16,530 31,717 34,017 2,457 22,600 28,346 (5,746) -20% 34,017<br />
Interest earned - outstanding debtors 75,858 23,010 224,686 11,337 100,722 187,231 (86,509) -46% 224,686<br />
Dividends received – – – – – –<br />
Fines 2,885 5,063 4,063 195 2,585 3,386 (801) -24% 4,063<br />
Licences and permits 351 766 797 34 360 664 (304) -46% 797<br />
Agency services – 3,527 3,527 – – 2,939 (2,939) -100% 3,527<br />
Transfers re<strong>co</strong>gnised - operational 584,676 651,134 650,329 – 610,134 541,919 68,215 13% 650,329<br />
Other revenue 229,752 715,498 859,146 24,473 522,831 715,927 (193,095) -27% 859,146<br />
Gains on disposal of PPE 97,608 40 40 – – 33 (33) -100% 40<br />
3,706,084 4,349,581 4,834,481 267,081 3,720,449 4,028,573 (308,124) -8% 4,834,481<br />
Total Revenue (excluding capital transfers and <strong>co</strong>ntributions)<br />
Expenditure By Type<br />
Employee related <strong>co</strong>sts 860,488 954,589 1,009,431 78,594 859,616 841,159 18,457 2% 1,009,431<br />
Remuneration of <strong>co</strong>uncillors 41,318 46,207 46,207 3,671 36,343 38,504 (2,161) -6% 46,207<br />
Debt impairment 439,553 142,989 142,989 8,683 86,834 119,153 (32,319) -27% 142,989<br />
Depreciation & asset impairment 440,206 200,157 335,425 24,191 241,915 279,510 (37,595) -13% 335,425<br />
Finance charges 56,896 65,664 163,855 1,017 6,986 136,540 (129,554) -95% 163,855<br />
Bulk purchases 1,236,265 1,478,735 1,478,735 99,961 1,067,425 1,232,230 (164,805) -13% 1,478,735<br />
Other materials 177,943 238,250 266,857 13,745 95,497 222,372 (126,875) -57% 266,857<br />
Contracted services 129,703 180,438 321,598 21,110 151,684 267,987 (116,303) -43% 321,598<br />
Transfers and grants 80,514 140,289 140,536 51 80,212 117,109 (36,897) -32% 140,536<br />
Other expenditure 358,364 728,996 874,987 24,484 228,780 729,126 (500,346) -69% 874,987<br />
Loss on disposal of PPE 3 – – – – –<br />
Total Expenditure 3,821,252 4,176,315 4,780,621 275,507 2,855,292 3,983,691 ######## -28% 4,780,621<br />
Surplus/(Deficit) (115,169) 173,266 53,860 (8,426) 865,156 44,882 820,275 0 53,860<br />
Transfers re<strong>co</strong>gnised - capital 450,845 513,967 696,777 – – 580,624 (580,624) (0) 696,777<br />
Contributions re<strong>co</strong>gnised - capital 15,250 24,767 24,767 – – 20,639 (20,639) (0) 24,767<br />
Contributed assets – – – – – – –<br />
Surplus/(Deficit) after capital transfers & <strong>co</strong>ntributions 350,927 712,001 775,405 (8,426) 865,156 646,145 775,405<br />
Taxation – – – – – –<br />
Surplus/(Deficit) after taxation 350,927 712,001 775,405 (8,426) 865,156 646,145 775,405<br />
Attributable to minorities – – – – – – –<br />
Surplus/(Deficit) attributable to municipality 350,927 712,001 775,405 (8,426) 865,156 646,145 775,405<br />
Share of surplus/ (deficit) of associate – – – – – – –<br />
Surplus/ (Deficit) for the year 350,927 712,001 775,405 (8,426) 865,156 646,145 775,405<br />
The major revenue variances against the budget are:<br />
<br />
<br />
<br />
<br />
<br />
<br />
<br />
<br />
Electricity revenue – Unfavourable variance of R103.526m due to higher projected sales that<br />
did not materialise, less electricity billed and sold for the period;<br />
Water revenue - Unfavourable variance of R22.884m due to a decrease in billing, less water<br />
billed for the period, which has been cushioned by the outstanding processing of revenue<br />
foregone expenditure due to indigent beneficiaries.<br />
Services charges – sanitation revenue - Favourable variance of R8.708m mainly as a result<br />
of outstanding processing of revenue foregone expenditure due to indigent beneficiaries.<br />
Services charges – refuse revenue - Favourable variance of R20.539m due to increased<br />
<strong>co</strong>llection of trade waste removal and outstanding processing of revenue foregone<br />
expenditure due to indigent beneficiaries.<br />
Interest earned – outstanding debtors – Unfavourable variance of R86.509m due to overestimation<br />
on the interest revenue.<br />
Government Grants and subsidies – Operating (R68.215m) favourable due to the equitable<br />
share received in advance for the period to date;<br />
Other revenue (R193.095m) unfavourable due to under <strong>co</strong>llection on various revenue items,<br />
non-cash items and GRAP issues only ac<strong>co</strong>unted for at year end and<br />
Transfers re<strong>co</strong>gnised – Capital: R580.624m unfavourable due to under spending on capital<br />
expenditure and non re<strong>co</strong>gnition of capital grants for the period.<br />
The major operating expenditure variances against budget are:<br />
<br />
Employee related <strong>co</strong>sts – Unfavourable variance of R18.457m due to overspending on<br />
overtime worked and duplication of se<strong>co</strong>nded personnel by the entity paid by <strong>Mangaung</strong>:<br />
2


