

Portfolio report - Mangaung.co.za
Portfolio report - Mangaung.co.za
Portfolio report - Mangaung.co.za

You also want an ePaper? Increase the reach of your titles
YUMPU automatically turns print PDFs into web optimized ePapers that Google loves.
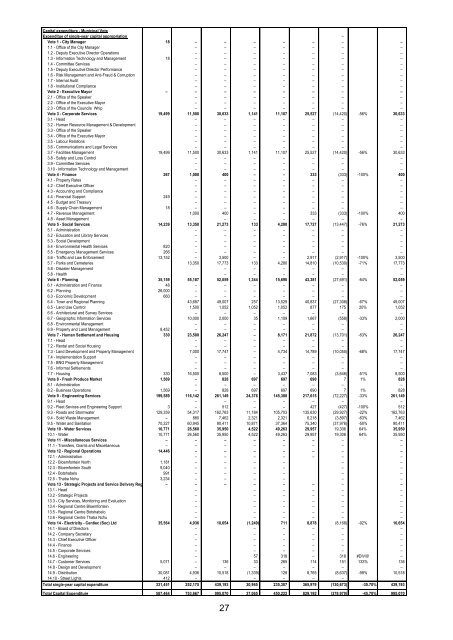
Capital expenditure - Municipal Vote<br />
Expenditue of single-year capital appropriation –<br />
Vote 1 - City Manager 18 – – – – – – –<br />
1.1 - Office of the City Manager – – – – – – –<br />
1.2 - Deputy Executive Director Operations – – – – – – –<br />
1.3 - Information Technology and Management 18 – – – – – – –<br />
1.4 - Committee Services – – – – – – –<br />
1.5 - Deputy Executive Director Performance – – – – – – –<br />
1.6 - Risk Management and Anti-Fraud & Corruption – – – – – – –<br />
1.7 - Internal Audit – – – – – – –<br />
1.8 - Institutional Compliance – – – – – – –<br />
Vote 2 - Executive Mayor – – – – – – – –<br />
2.1 - Office of the Speaker – – – – – – –<br />
2.2 - Office of the Executive Mayor – – – – – – –<br />
2.3 - Office of the Councils Whip – – – – – – –<br />
Vote 3 - Corporate Services 19,499 11,500 30,633 1,141 11,107 25,527 (14,420) -56% 30,633<br />
3.1 - Head – – – – – – –<br />
3.2 - Human Resource Management & Development – – – – – – –<br />
3.3 - Office of the Speaker – – – – – – –<br />
3.4 - Office of the Executive Mayor – – – – – – –<br />
3.5 - Labour Relations – – – – – – –<br />
3.6 - Communications and Legal Services – – – – – – –<br />
3.7 - Facilities Management 19,499 11,500 30,633 1,141 11,107 25,527 (14,420) -56% 30,633<br />
3.8 - Safety and Loss Control – – – – – – –<br />
3.9 - Committee Services – – – – – – –<br />
3.10 - Information Technology and Management – – – – – – –<br />
Vote 4 - Finance 267 1,000 400 – – 333 (333) -100% 400<br />
4.1 - Property Rates – – – – – – –<br />
4.2 - Chief Executive Officer – – – – – – –<br />
4.3 - Ac<strong>co</strong>unting and Compliance – – – – – – –<br />
4.4 - Financial Support 249 – – – – – – –<br />
4.5 - Budget and Treasury – – – – – – –<br />
4.6 - Supply Chain Management 18 – – – – – – –<br />
4.7 - Revenue Management 1,000 400 – – 333 (333) -100% 400<br />
4.8 - Asset Management – – – – – –<br />
Vote 5 - Social Services 14,239 13,350 21,273 133 4,280 17,727 (13,447) -76% 21,273<br />
5.1 - Administration – – – – – – –<br />
5.2 - Education and Library Services – – – – – – –<br />
5.3 - Social Development – – – – – – –<br />
5.4 - Environmental Health Services 820 – – – – – – –<br />
5.5 - Emergency Management Services 266 – – – – – – –<br />
5.6 - Traffic and Law Enforcement 13,152 – 3,500 – – 2,917 (2,917) -100% 3,500<br />
5.7 - Parks and Cemeteries 13,350 17,773 133 4,280 14,810 (10,530) -71% 17,773<br />
5.8 - Disaster Management – – – – – –<br />
5.8 - Health – – – – – –<br />
Vote 6 - Planning 35,159 55,187 52,059 1,344 15,690 43,381 (27,691) -64% 52,059<br />
6.1 - Administration and Finance 48 – – – – – – –<br />
6.2 - Planning 26,000 – – – – – – –<br />
6.3 - E<strong>co</strong>nomic Development 660 – – – – – – –<br />
6.4 - Town and Regional Planning 43,687 49,007 257 13,529 40,837 (27,308) -67% 49,007<br />
6.5 - Land Use Control 1,500 1,052 1,052 1,052 877 175 20% 1,052<br />
6.6 - Architectural and Survey Services – – – – – – –<br />
6.7 - Geographic Information Services 10,000 2,000 35 1,109 1,667 (558) -33% 2,000<br />
6.8 - Environmental Management – – – – – – –<br />
6.9 - Property and Land Management 8,452 – – – – – – –<br />
Vote 7 - Human Settlement and Housing 330 23,500 26,247 – 8,171 21,872 (13,701) -63% 26,247<br />
7.1 - Head – – – – – – –<br />
7.2 - Rental and Social Housing – – – – – – –<br />
7.3 - Land Development and Property Management 7,000 17,747 – 4,734 14,789 (10,055) -68% 17,747<br />
7.4 - Implementation Support – – – – – – –<br />
7.5 - BNG Property Management – – – – – – –<br />
7.6 - Informal Settlements – – – – – – –<br />
7.7 - Housing 330 16,500 8,500 – 3,437 7,083 (3,646) -51% 8,500<br />
Vote 8 - Fresh Produce Market 1,569 – 828 697 697 690 7 1% 828<br />
8.1 - Administration – – – – – – –<br />
8.2 - Business Operations 1,569 – 828 697 697 690 7 1% 828<br />
Vote 9 - Engineering Services 199,589 116,142 261,149 24,376 145,388 217,615 (72,227) -33% 261,149<br />
9.1 - Head – – – – – – –<br />
9.2 - Fleet Sevices and Engineering Support 3 – 512 – – 427 (427) -100% 512<br />
9.3 - Roads and Stormwater 129,359 54,317 162,763 11,184 105,703 135,630 (29,927) -22% 162,763<br />
9.4 - Solid Waste Management – 880 7,462 2,321 2,321 6,218 (3,897) -63% 7,462<br />
9.5 - Water and Sanitation 70,227 60,945 90,411 10,871 37,364 75,340 (37,976) -50% 90,411<br />
Vote 10 - Water Services 10,771 26,560 35,950 4,522 49,263 29,957 19,306 64% 35,950<br />
10.1 - Water 10,771 26,560 35,950 4,522 49,263 29,957 19,306 64% 35,950<br />
Vote 11 - Miscellaneous Services – – – – – – – –<br />
11.1 - Transfers, Grants and Miscellaneous – – – – – – – –<br />
Vote 12 - Regional Operations 14,446 – – – – – – –<br />
12.1 - Administration – – – – – – –<br />
12.2 - Bloemfontein North 1,181 – – – – – –<br />
12.3 - Bloemfontein South 9,040 – – – – – –<br />
12.4 - Botshabelo 991 – – – – – –<br />
12.5 - Thaba Nchu 3,234 – – – – – –<br />
Vote 13 - Strategic Projects and Service Delivery Regulation – – – – – – – –<br />
13.1 - Head – – – – – –<br />
13.2 - Strategic Projects – – – – – –<br />
13.3 - City Services, Monitoring and Evaluation – – – – – –<br />
13.4 - Regional Centre Bloemfontein – – – – – –<br />
13.5 - Regional Centre Botshabelo – – – – – –<br />
13.6 - Regional Centre Thaba Nchu – – – – – –<br />
Vote 14 - Electricity - Centlec (Soc) Ltd 35,564 4,936 10,654 (1,249) 711 8,878 (8,168) -92% 10,654<br />
14.1 - Board of Directors – – – – – –<br />
14.2 - Company Secretary – – – – – –<br />
14.3 - Chief Executive Officer – – – – – –<br />
14.4 - Finance – – – – – –<br />
14.5 - Corporate Services – – – – – –<br />
14.6 - Engineering – 57 318 – 318 #DIV/0! –<br />
14.7 - Customer Services 5,071 – 136 33 265 114 151 133% 136<br />
14.8 - Design and Development – – – – – – –<br />
14.9 - Distribution 30,081 4,936 10,518 (1,339) 128 8,765 (8,637) -99% 10,518<br />
14.10 - Street Lights 412 – – – – –<br />
Total single-year capital expenditure 331,451 252,175 439,193 30,965 235,307 365,979 (130,673)<br />
–<br />
-35.70% 439,193<br />
Total Capital Expenditure 587,464 753,667 995,070 37,065 450,222 829,192 (378,970) -45.70% 995,070<br />
27


