

Portfolio report - Mangaung.co.za
Portfolio report - Mangaung.co.za
Portfolio report - Mangaung.co.za

Create successful ePaper yourself
Turn your PDF publications into a flip-book with our unique Google optimized e-Paper software.
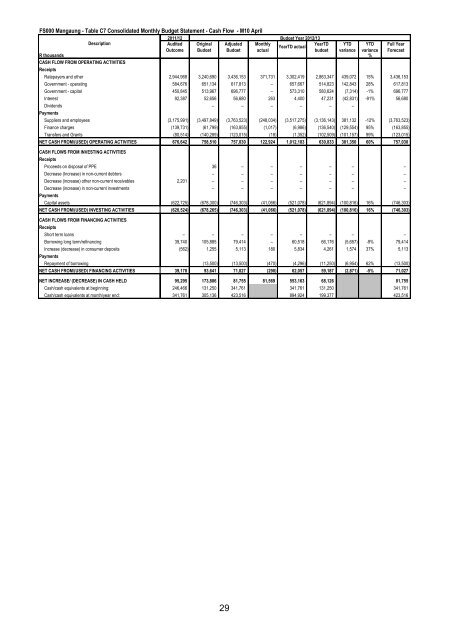
FS000 <strong>Mangaung</strong> - Table C7 Consolidated Monthly Budget Statement - Cash Flow - M10 April<br />
2011/12 Budget Year 2012/13<br />
Description<br />
Audited Original Adjusted Monthly<br />
YearTD YTD YTD<br />
YearTD actual<br />
Out<strong>co</strong>me Budget Budget actual<br />
budget variance variance<br />
R thousands %<br />
CASH FLOW FROM OPERATING ACTIVITIES<br />
Receipts<br />
Full Year<br />
Forecast<br />
Ratepayers and other 2,944,968 3,240,690 3,436,153 371,731 3,302,419 2,863,347 439,072 15% 3,436,153<br />
Government - operating 584,676 651,134 617,813 – 657,667 514,823 142,843 28% 617,813<br />
Government - capital 450,845 513,967 696,777 – 573,310 580,624 (7,314) -1% 696,777<br />
Interest 92,387 52,656 56,680 263 4,400 47,231 (42,831) -91% 56,680<br />
Dividends – – – – – –<br />
Payments<br />
Suppliers and employees (3,175,991) (3,497,849) (3,763,523) (248,034) (3,517,275) (3,136,143) 381,132 -12% (3,763,523)<br />
Finance charges (139,731) (61,799) (163,855) (1,017) (6,986) (136,540) (129,554) 95% (163,855)<br />
Transfers and Grants (80,514) (140,289) (123,015) (18) (1,352) (102,509) (101,157) 99% (123,015)<br />
NET CASH FROM/(USED) OPERATING ACTIVITIES 676,642 758,510 757,030 122,924 1,012,183 630,833 381,350 60% 757,030<br />
CASH FLOWS FROM INVESTING ACTIVITIES<br />
Receipts<br />
Proceeds on disposal of PPE 36 – – – – – –<br />
Decrease (Increase) in non-current debtors – – – – – – –<br />
Decrease (increase) other non-current receivables 2,201 – – – – – – –<br />
Decrease (increase) in non-current investments – – – – – – –<br />
Payments<br />
Capital assets (622,725) (678,300) (746,303) (41,066) (521,078) (621,894) (100,816) 16% (746,303)<br />
NET CASH FROM/(USED) INVESTING ACTIVITIES (620,524) (678,265) (746,303) (41,066) (521,078) (621,894) (100,816) 16% (746,303)<br />
CASH FLOWS FROM FINANCING ACTIVITIES<br />
Receipts<br />
Short term loans – – – – – – – –<br />
Borrowing long term/refinancing 39,740 105,885 79,414 – 60,518 66,176 (5,657) -9% 79,414<br />
Increase (decrease) in <strong>co</strong>nsumer deposits (562) 1,255 5,113 180 5,834 4,261 1,574 37% 5,113<br />
Payments<br />
Repayment of borrowing (13,500) (13,500) (470) (4,296) (11,250) (6,954) 62% (13,500)<br />
NET CASH FROM/(USED) FINANCING ACTIVITIES 39,178 93,641 71,027 (290) 62,057 59,187 (2,871) -5% 71,027<br />
NET INCREASE/ (DECREASE) IN CASH HELD 95,295 173,886 81,755 81,569 553,163 68,126 81,755<br />
Cash/cash equivalents at beginning: 246,466 131,250 341,761 341,761 131,250 341,761<br />
Cash/cash equivalents at month/year end: 341,761 305,136 423,516 894,924 199,377 423,516<br />
29


