

Portfolio report - Mangaung.co.za
Portfolio report - Mangaung.co.za
Portfolio report - Mangaung.co.za

You also want an ePaper? Increase the reach of your titles
YUMPU automatically turns print PDFs into web optimized ePapers that Google loves.
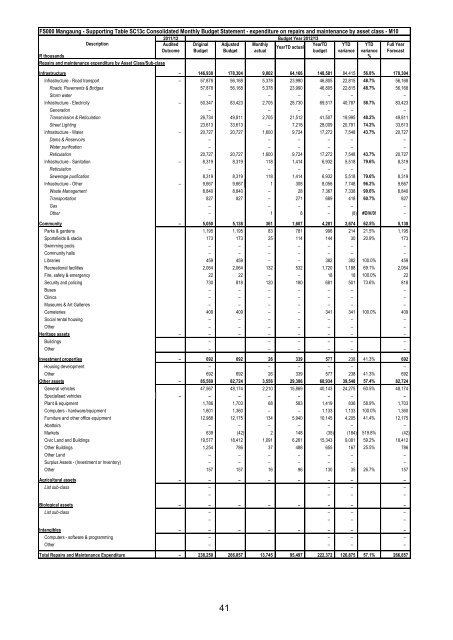
FS000 <strong>Mangaung</strong> - Supporting Table SC13c Consolidated Monthly Budget Statement - expenditure on repairs and maintenance by asset class - M10<br />
2011/12 Budget Year 2012/13<br />
Description<br />
Audited Original Adjusted Monthly<br />
YearTD YTD YTD Full Year<br />
YearTD actual<br />
Out<strong>co</strong>me Budget Budget actual<br />
budget variance variance Forecast<br />
R thousands %<br />
Repairs and maintenance expenditure by Asset Class/Sub-class<br />
Infrastructure – 146,938 178,304 9,802 64,166 148,581 84,415 56.8% 178,304<br />
Infrastructure - Road transport – 57,878 56,168 5,378 23,990 46,805 22,815 48.7% 56,168<br />
Roads, Pavements & Bridges 57,878 56,168 5,378 23,990 46,805 22,815 48.7% 56,168<br />
Storm water – – – – – –<br />
Infrastructure - Electricity – 50,347 83,423 2,705 28,730 69,517 40,787 58.7% 83,423<br />
Generation – – – – – –<br />
Transmission & Reticulation 26,734 49,811 2,705 21,512 41,507 19,995 48.2% 49,811<br />
Street Lighting 23,613 33,613 – 7,218 28,009 20,791 74.2% 33,613<br />
Infrastructure - Water – 20,727 20,727 1,600 9,724 17,272 7,548 43.7% 20,727<br />
Dams & Reservoirs – – – – – –<br />
Water purification – – – – – –<br />
Reticulation 20,727 20,727 1,600 9,724 17,272 7,548 43.7% 20,727<br />
Infrastructure - Sanitation – 8,319 8,319 118 1,414 6,932 5,518 79.6% 8,319<br />
Reticulation – – – – – –<br />
Sewerage purification 8,319 8,319 118 1,414 6,932 5,518 79.6% 8,319<br />
Infrastructure - Other – 9,667 9,667 1 308 8,056 7,748 96.2% 9,667<br />
Waste Management 8,840 8,840 – 28 7,367 7,338 99.6% 8,840<br />
Transportation 827 827 – 271 689 418 60.7% 827<br />
Gas – – – – – –<br />
Other – 1 8 – (8) #DIV/0! –<br />
Community – 5,050 5,138 361 1,607 4,281 2,674 62.5% 5,138<br />
Parks & gardens 1,195 1,195 83 781 996 214 21.5% 1,195<br />
Sportsfields & stadia 173 173 25 114 144 30 20.9% 173<br />
Swimming pools – – – – – – –<br />
Community halls – – – – – – –<br />
Libraries 459 459 – – 382 382 100.0% 459<br />
Recreational facilities 2,064 2,064 132 532 1,720 1,188 69.1% 2,064<br />
Fire, safety & emergency 22 22 – – 18 18 100.0% 22<br />
Security and policing 730 818 120 180 681 501 73.6% 818<br />
Buses – – – – – – –<br />
Clinics – – – – – – –<br />
Museums & Art Galleries – – – – – – –<br />
Cemeteries 409 409 – – 341 341 100.0% 409<br />
Social rental housing – – – – – – –<br />
Other – – – – – – –<br />
Heritage assets – – – – – – – –<br />
Buildings – – – – – –<br />
Other – – – – – –<br />
–<br />
Investment properties – 692 692 26 339 577 238 41.3% 692<br />
Housing development – – – – – –<br />
Other 692 692 26 339 577 238 41.3% 692<br />
Other assets – 85,569 82,724 3,556 29,386 68,934 39,548 57.4% 82,724<br />
General vehicles 47,567 48,174 2,210 15,869 40,143 24,275 60.5% 48,174<br />
Specialised vehicles – – – – – – – –<br />
Plant & equipment 1,786 1,703 68 583 1,419 836 58.9% 1,703<br />
Computers - hardware/equipment 1,601 1,360 – – 1,133 1,133 100.0% 1,360<br />
Furniture and other office equipment 12,988 12,175 134 5,940 10,145 4,205 41.4% 12,175<br />
Abattoirs – – – – – – –<br />
Markets 639 (42) 2 148 (35) (184) 519.8% (42)<br />
Civic Land and Buildings 19,577 18,412 1,091 6,261 15,343 9,081 59.2% 18,412<br />
Other Buildings 1,254 786 37 488 655 167 25.5% 786<br />
Other Land – – – – – – –<br />
Surplus Assets - (Investment or Inventory) – – – – – – –<br />
Other 157 157 16 96 130 35 26.7% 157<br />
Agricultural assets – – – – – – – –<br />
List sub-class – – – –<br />
– – – –<br />
Biological assets – – – – – – – –<br />
List sub-class – – – –<br />
– – – –<br />
Intangibles – – – – – – – –<br />
Computers - software & programming – – – –<br />
Other – – – –<br />
Total Repairs and Maintenance Expenditure – 238,250 266,857 13,745 95,497 222,372 126,875 57.1% 266,857<br />
41


