

Statistical report Australian sea freight 2010â11
Statistical report Australian sea freight 2010â11
Statistical report Australian sea freight 2010â11

You also want an ePaper? Increase the reach of your titles
YUMPU automatically turns print PDFs into web optimized ePapers that Google loves.
Chapter 1 • International <strong>sea</strong> <strong>freight</strong><br />
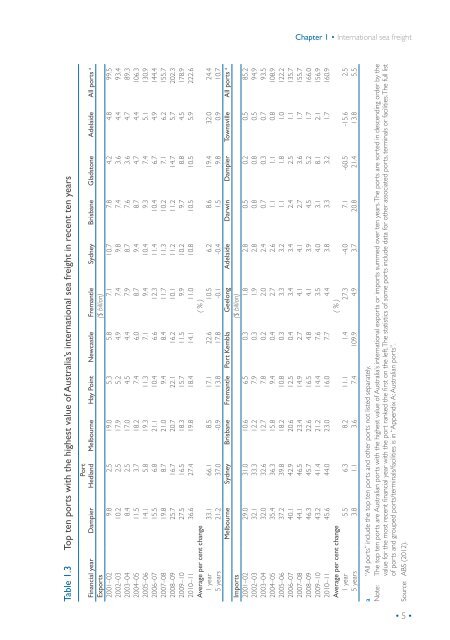
Table 1.3 Top ten ports with the highest value of Australia’s international <strong>sea</strong> <strong>freight</strong> in recent ten years<br />
Financial year Dampier Port<br />
Hedland Melbourne Hay Point Newcastle Fremantle Sydney Brisbane Gladstone Adelaide All ports a<br />
Exports ($ billion)<br />
2001–02 9.8 2.5 19.0 5.3 5.8 7.1 10.7 7.8 4.2 4.8 99.5<br />
2002–03 10.2 2.5 17.9 5.2 4.9 7.4 9.8 7.4 3.6 4.4 93.4<br />
2003–04 8.4 2.5 17.0 4.5 4.4 7.9 8.7 7.6 3.6 4.7 89.3<br />
2004–05 11.5 3.7 18.2 7.4 6.0 8.7 9.4 8.7 4.7 4.4 106.3<br />
2005–06 14.1 5.8 19.3 11.3 7.1 9.4 10.4 9.3 7.4 5.1 130.9<br />
2006–07 15.5 6.8 21.1 10.4 6.6 12.3 11.4 10.4 6.7 4.9 144.4<br />
2007–08 19.8 8.7 21.0 9.4 8.4 11.7 11.3 10.2 7.1 6.2 155.7<br />
2008–09 25.7 16.7 20.7 22.1 16.2 10.1 11.2 11.2 14.7 5.7 202.3<br />
2009–10 27.5 16.5 18.3 15.7 11.5 9.9 10.2 9.7 8.8 4.5 178.9<br />
2010–11 36.6 27.4 19.8 18.4 14.1 11.0 10.8 10.5 10.5 5.9 222.6<br />
Average per cent change ( % )<br />
1 year 33.1 66.1 8.5 17.1 22.6 10.5 6.2 8.6 19.4 32.0 24.4<br />
5 years 21.2 37.0 -0.9 13.8 17.8 -0.1 -0.4 1.5 9.8 0.9 10.7<br />
Melbourne Sydney Brisbane Fremantle Port Kembla Geelong Adelaide Darwin Dampier Townsville All ports a<br />
Imports ($ billion)<br />
2001–02 29.0 31.0 10.6 6.5 0.3 1.8 2.8 0.5 0.2 0.5 85.2<br />
2002–03 32.1 33.3 12.2 7.9 0.3 1.9 2.8 0.8 0.8 0.5 94.9<br />
2003–04 32.0 32.6 12.7 7.8 0.2 2.0 2.4 0.7 0.3 0.7 93.5<br />
2004–05 35.4 36.3 15.8 9.4 0.4 2.7 2.6 1.1 1.1 0.8 108.9<br />
2005–06 37.2 39.8 18.2 10.8 0.3 3.3 3.2 1.1 1.8 1.0 122.2<br />
2006–07 40.1 42.9 20.6 12.5 0.4 3.4 3.4 2.4 2.5 1.1 135.7<br />
2007–08 44.1 46.5 23.4 14.9 2.7 4.1 4.1 2.7 3.6 1.7 155.7<br />
2008–09 46.3 45.7 22.6 16.5 4.8 4.1 3.9 4.5 5.2 1.7 166.0<br />
2009–10 43.2 41.4 21.2 14.4 7.6 3.5 4.0 3.1 8.1 2.1 156.9<br />
2010–11 45.6 44.0 23.0 16.0 7.7 4.4 3.8 3.3 3.2 1.7 160.9<br />
Average per cent change ( % )<br />
1 year 5.5 6.3 8.2 11.1 1.4 27.3 -4.0 7.1 -60.5 -15.6 2.5<br />
5 years 3.8 1.1 3.6 7.4 109.9 4.9 3.7 20.8 21.4 13.8 5.5<br />
a “All ports” include the top ten ports and other ports not listed separately.<br />
Note: The top ten ports are <strong>Australian</strong> ports with the highest value of Australia’s international exports or imports summed over ten years. The ports are sorted in descending order by the<br />
value for the most recent financial year with the port ranked the first on the left. The statistics of some ports include data for other associated ports, terminals or facilities. The full list<br />
of ports and grouped ports/terminals/facilities is in “Appendix A: <strong>Australian</strong> ports”.<br />
Source: ABS (2012).<br />
• 5 •


