

Statistical report Australian sea freight 2010â11
Statistical report Australian sea freight 2010â11
Statistical report Australian sea freight 2010â11

Create successful ePaper yourself
Turn your PDF publications into a flip-book with our unique Google optimized e-Paper software.
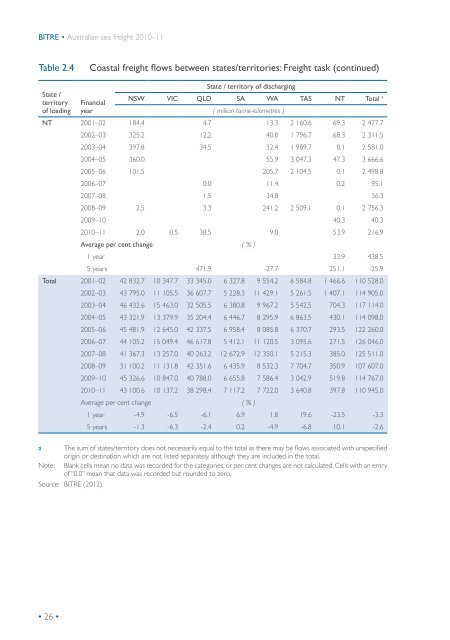
BITRE • <strong>Australian</strong> <strong>sea</strong> <strong>freight</strong> 2010–11<br />
Table 2.4<br />
Coastal <strong>freight</strong> flows between states/territories: Freight task (continued)<br />
a<br />
State /<br />
territory<br />
of loading<br />
Financial<br />
year<br />
State / territory of discharging<br />
NSW VIC QLD SA WA TAS NT Total a<br />
( million tonne-kilometres )<br />
NT 2001–02 184.4 4.7 13.3 2 160.6 69.3 2 477.7<br />
2002–03 325.2 12.2 40.8 1 796.7 68.3 2 311.5<br />
2003–04 397.8 34.5 32.4 1 989.7 8.1 2 581.0<br />
2004–05 360.0 55.9 3 047.3 47.3 3 666.6<br />
2005–06 101.5 205.7 2 104.5 0.1 2 498.8<br />
2006–07 0.0 11.4 0.2 95.1<br />
2007–08 1.5 34.8 36.3<br />
2008–09 2.5 3.3 241.2 2 509.1 0.1 2 756.3<br />
2009–10 40.3 40.3<br />
2010–11 2.0 0.5 38.5 9.0 53.9 216.9<br />
Average per cent change ( % )<br />
1 year 33.9 438.5<br />
5 years 471.9 -27.7 251.1 -25.9<br />
Total 2001–02 42 832.7 10 347.7 33 345.0 6 327.8 9 554.2 6 584.8 1 466.6 110 528.0<br />
Note:<br />
2002–03 43 795.0 11 105.5 36 607.7 5 228.3 11 429.1 5 261.5 1 407.1 114 905.0<br />
2003–04 46 432.6 15 463.0 32 505.5 6 380.8 9 967.2 5 542.5 704.3 117 114.0<br />
2004–05 43 321.9 13 379.9 35 204.4 6 446.7 8 295.9 6 863.5 430.1 114 098.0<br />
2005–06 45 481.9 12 645.0 42 337.5 6 958.4 8 085.8 6 370.7 293.5 122 260.0<br />
2006–07 44 105.2 15 049.4 46 617.8 5 412.1 11 120.5 3 095.6 271.5 126 046.0<br />
2007–08 41 367.3 13 257.0 40 263.2 12 672.9 12 350.1 5 215.3 385.0 125 511.0<br />
2008–09 31 100.2 11 131.8 42 351.6 6 435.9 8 532.3 7 704.7 350.9 107 607.0<br />
2009–10 45 326.6 10 847.0 40 788.0 6 655.8 7 586.4 3 042.9 519.8 114 767.0<br />
2010–11 43 100.6 10 137.2 38 298.4 7 117.2 7 722.0 3 640.8 397.8 110 945.0<br />
Average per cent change ( % )<br />
1 year -4.9 -6.5 -6.1 6.9 1.8 19.6 -23.5 -3.3<br />
5 years -1.3 -6.3 -2.4 0.2 -4.9 -6.8 10.1 -2.6<br />
The sum of states/territory does not necessarily equal to the total as there may be flows associated with unspecified<br />
origin or destination which are not listed separately although they are included in the total.<br />
Blank cells mean no data was recorded for the categories, or per cent changes are not calculated. Cells with an entry<br />
of “0.0” mean that data was recorded but rounded to zero.<br />
Source: BITRE (2012).<br />
• 26 •


