

Statistical report Australian sea freight 2010â11
Statistical report Australian sea freight 2010â11
Statistical report Australian sea freight 2010â11

Create successful ePaper yourself
Turn your PDF publications into a flip-book with our unique Google optimized e-Paper software.
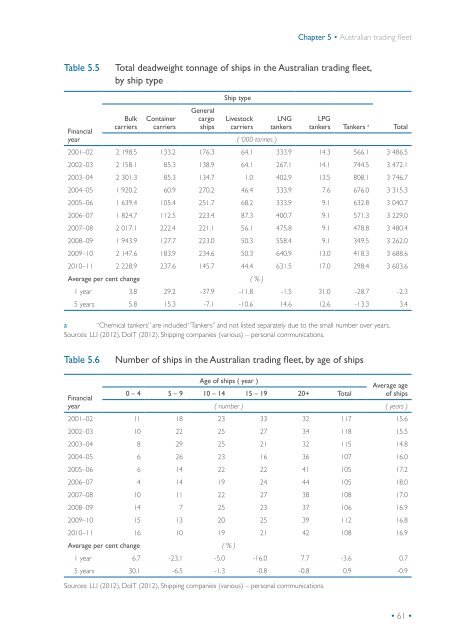
Chapter 5 • <strong>Australian</strong> trading fleet<br />
Table 5.5<br />
Total deadweight tonnage of ships in the <strong>Australian</strong> trading fleet,<br />
by ship type<br />
Financial<br />
year<br />
Bulk<br />
carriers<br />
Container<br />
carriers<br />
General<br />
cargo<br />
ships<br />
Ship type<br />
Livestock<br />
carriers<br />
( ‘000 tonnes )<br />
LNG<br />
tankers<br />
LPG<br />
tankers<br />
Tankers a<br />
2001–02 2 198.5 133.2 176.3 64.1 333.9 14.3 566.1 3 486.5<br />
2002–03 2 158.1 85.3 138.9 64.1 267.1 14.1 744.5 3 472.1<br />
2003–04 2 301.3 85.3 134.7 1.0 402.9 13.5 808.1 3 746.7<br />
2004–05 1 920.2 60.9 270.2 46.4 333.9 7.6 676.0 3 315.3<br />
2005–06 1 639.4 105.4 251.7 68.2 333.9 9.1 632.8 3 040.7<br />
2006–07 1 824.7 112.5 223.4 87.3 400.7 9.1 571.3 3 229.0<br />
2007–08 2 017.1 222.4 221.1 56.1 475.8 9.1 478.8 3 480.4<br />
2008–09 1 943.9 127.7 223.0 50.3 558.4 9.1 349.5 3 262.0<br />
2009–10 2 147.6 183.9 234.6 50.3 640.9 13.0 418.3 3 688.6<br />
2010–11 2 228.9 237.6 145.7 44.4 631.5 17.0 298.4 3 603.6<br />
Average per cent change ( % )<br />
1 year 3.8 29.2 -37.9 -11.8 -1.5 31.0 -28.7 -2.3<br />
5 years 5.8 15.3 -7.1 -10.6 14.6 12.6 -13.3 3.4<br />
a “Chemical tankers” are included “Tankers” and not listed separately due to the small number over years.<br />
Sources: LLI (2012), DoIT (2012), Shipping companies (various) – personal communications.<br />
Total<br />
Table 5.6<br />
Number of ships in the <strong>Australian</strong> trading fleet, by age of ships<br />
Financial<br />
year<br />
Age of ships ( year )<br />
0 – 4 5 – 9 10 – 14 15 – 19 20+ Total<br />
Average age<br />
of ships<br />
( number ) ( years )<br />
2001–02 11 18 23 33 32 117 15.6<br />
2002–03 10 22 25 27 34 118 15.5<br />
2003–04 8 29 25 21 32 115 14.8<br />
2004–05 6 26 23 16 36 107 16.0<br />
2005–06 6 14 22 22 41 105 17.2<br />
2006–07 4 14 19 24 44 105 18.0<br />
2007–08 10 11 22 27 38 108 17.0<br />
2008–09 14 7 25 23 37 106 16.9<br />
2009–10 15 13 20 25 39 112 16.8<br />
2010–11 16 10 19 21 42 108 16.9<br />
Average per cent change ( % )<br />
1 year 6.7 -23.1 -5.0 -16.0 7.7 -3.6 0.7<br />
5 years 30.1 -6.5 -1.3 -0.8 -0.8 0.9 -0.9<br />
Sources: LLI (2012), DoIT (2012), Shipping companies (various) – personal communications.<br />
• 61 •


