

Statistical report Australian sea freight 2010â11
Statistical report Australian sea freight 2010â11
Statistical report Australian sea freight 2010â11

Create successful ePaper yourself
Turn your PDF publications into a flip-book with our unique Google optimized e-Paper software.
Chapter 1 • International <strong>sea</strong> <strong>freight</strong><br />
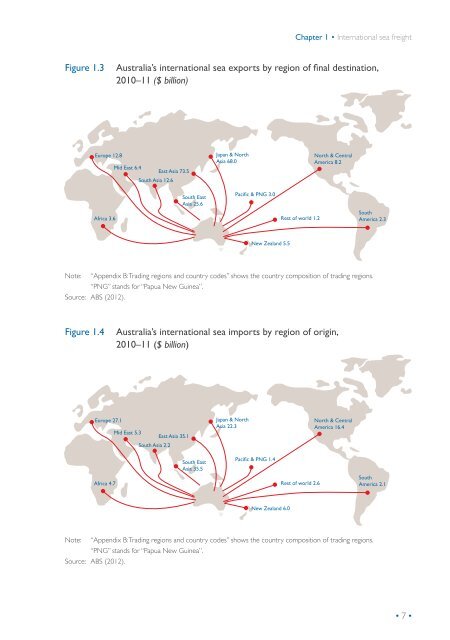
Figure 1.3<br />
Australia’s international <strong>sea</strong> exports by region of final destination,<br />
2010–11 ($ billion)<br />
Europe 12.8<br />
Mid East 6.4<br />
East Asia 73.5<br />
South Asia 12.6<br />
Japan & North<br />
Asia 68.0<br />
North & Central<br />
America 8.2<br />
Africa 3.6<br />
South East<br />
Asia 25.6<br />
Pacific & PNG 3.0<br />
Rest of world 1.2<br />
South<br />
America 2.3<br />
New Zealand 5.5<br />
Note: “Appendix B: Trading regions and country codes” shows the country composition of trading regions.<br />
“PNG” stands for “Papua New Guinea”.<br />
Source: ABS (2012).<br />
Figure 1.4<br />
Australia’s international <strong>sea</strong> imports by region of origin,<br />
2010–11 ($ billion)<br />
Europe 27.1<br />
Mid East 5.3<br />
East Asia 35.1<br />
South Asia 2.2<br />
Japan & North<br />
Asia 22.3<br />
North & Central<br />
America 16.4<br />
Africa 4.7<br />
South East<br />
Asia 35.5<br />
Pacific & PNG 1.4<br />
Rest of world 2.6<br />
South<br />
America 2.1<br />
New Zealand 6.0<br />
Note: “Appendix B: Trading regions and country codes” shows the country composition of trading regions.<br />
“PNG” stands for “Papua New Guinea”.<br />
Source: ABS (2012).<br />
• 7 •


