

Statistical report Australian sea freight 2010â11
Statistical report Australian sea freight 2010â11
Statistical report Australian sea freight 2010â11

You also want an ePaper? Increase the reach of your titles
YUMPU automatically turns print PDFs into web optimized ePapers that Google loves.
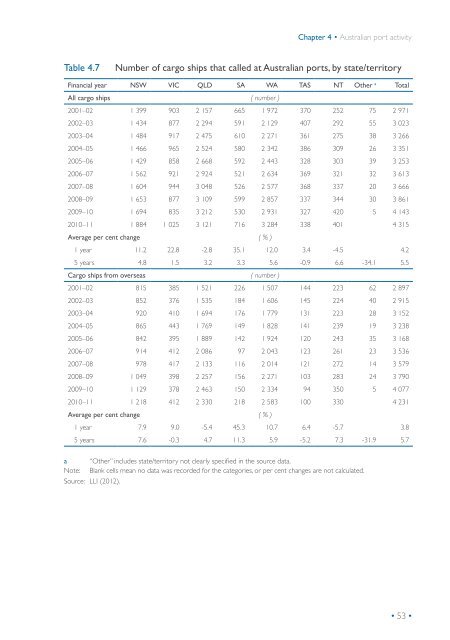
Chapter 4 • <strong>Australian</strong> port activity<br />
Table 4.7<br />
Number of cargo ships that called at <strong>Australian</strong> ports, by state/territory<br />
Financial year NSW VIC QLD SA WA TAS NT Other a Total<br />
All cargo ships ( number )<br />
2001–02 1 399 903 2 157 665 1 972 370 252 75 2 971<br />
2002–03 1 434 877 2 294 591 2 129 407 292 55 3 023<br />
2003–04 1 484 917 2 475 610 2 271 361 275 38 3 266<br />
2004–05 1 466 965 2 524 580 2 342 386 309 26 3 351<br />
2005–06 1 429 858 2 668 592 2 443 328 303 39 3 253<br />
2006–07 1 562 921 2 924 521 2 634 369 321 32 3 613<br />
2007–08 1 604 944 3 048 526 2 577 368 337 20 3 666<br />
2008–09 1 653 877 3 109 599 2 857 337 344 30 3 861<br />
2009–10 1 694 835 3 212 530 2 931 327 420 5 4 143<br />
2010–11 1 884 1 025 3 121 716 3 284 338 401 4 315<br />
Average per cent change ( % )<br />
1 year 11.2 22.8 -2.8 35.1 12.0 3.4 -4.5 4.2<br />
5 years 4.8 1.5 3.2 3.3 5.6 -0.9 6.6 -34.1 5.5<br />
Cargo ships from over<strong>sea</strong>s ( number )<br />
2001–02 815 385 1 521 226 1 507 144 223 62 2 897<br />
2002–03 852 376 1 535 184 1 606 145 224 40 2 915<br />
2003–04 920 410 1 694 176 1 779 131 223 28 3 152<br />
2004–05 865 443 1 769 149 1 828 141 239 19 3 238<br />
2005–06 842 395 1 889 142 1 924 120 243 35 3 168<br />
2006–07 914 412 2 086 97 2 043 123 261 23 3 536<br />
2007–08 978 417 2 133 116 2 014 121 272 14 3 579<br />
2008–09 1 049 398 2 257 156 2 271 103 283 24 3 790<br />
2009–10 1 129 378 2 463 150 2 334 94 350 5 4 077<br />
2010–11 1 218 412 2 330 218 2 583 100 330 4 231<br />
Average per cent change ( % )<br />
1 year 7.9 9.0 -5.4 45.3 10.7 6.4 -5.7 3.8<br />
5 years 7.6 -0.3 4.7 11.3 5.9 -5.2 7.3 -31.9 5.7<br />
a “Other” includes state/territory not clearly specified in the source data.<br />
Note: Blank cells mean no data was recorded for the categories, or per cent changes are not calculated.<br />
Source: LLI (2012).<br />
• 53 •


