

Statistical report Australian sea freight 2010â11
Statistical report Australian sea freight 2010â11
Statistical report Australian sea freight 2010â11

Create successful ePaper yourself
Turn your PDF publications into a flip-book with our unique Google optimized e-Paper software.
Chapter 2 • Coastal <strong>freight</strong><br />
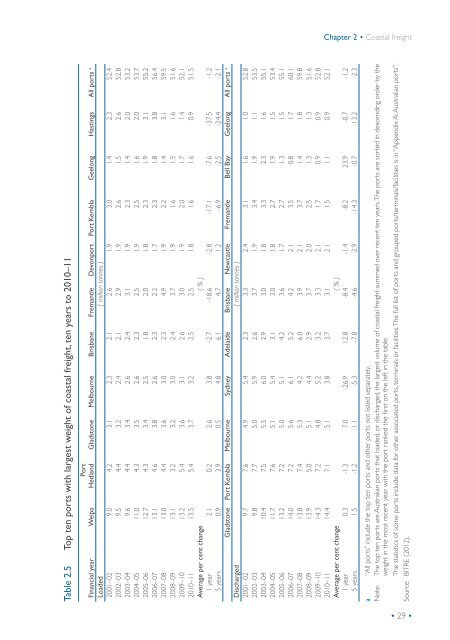
Table 2.5 Top ten ports with largest weight of coastal <strong>freight</strong>, ten years to 2010–11<br />
Financial year Weipa Port<br />
Hedland Gladstone Melbourne Brisbane Fremantle Devonport Port Kembla Geelong Hastings All ports a<br />
Loaded ( million tonnes )<br />
2001–02 9.0 4.2 3.1 2.3 2.1 2.6 1.9 3.0 1.4 2.3 52.4<br />
2002–03 9.5 4.4 3.2 2.4 2.1 2.9 1.9 2.6 1.5 2.6 52.8<br />
2003–04 9.6 4.4 3.4 2.6 2.4 3.1 1.9 2.3 1.4 2.0 53.2<br />
2004–05 11.0 4.3 3.5 2.6 2.3 2.5 1.9 2.5 1.6 2.0 53.7<br />
2005–06 12.7 4.3 3.4 2.5 1.8 2.0 1.8 2.3 1.9 3.1 55.2<br />
2006–07 13.1 4.6 3.8 2.6 2.3 2.2 1.7 2.3 1.8 3.8 56.4<br />
2007–08 13.0 4.4 3.6 3.0 2.3 4.9 1.9 2.2 1.4 3.1 59.5<br />
2008–09 13.1 3.2 3.2 3.0 2.4 3.7 1.9 1.6 1.5 1.6 51.6<br />
2009–10 13.2 5.4 3.6 3.1 2.6 3.0 1.9 2.0 1.7 1.4 52.1<br />
2010–11 13.5 5.4 3.7 3.2 2.5 2.5 1.8 1.6 1.6 0.9 51.5<br />
Average per cent change ( % )<br />
1 year 2.1 0.2 2.6 3.8 -2.7 -18.6 -2.8 -17.1 -7.6 -37.5 -1.2<br />
5 years 0.9 3.9 0.5 4.8 6.1 4.7 1.2 -6.9 -2.5 -24.4 -2.1<br />
Gladstone Port Kembla Melbourne Sydney Adelaide Brisbane Newcastle Fremantle Bell Bay Geelong All ports a<br />
Discharged ( million tonnes )<br />
2001–02 9.7 7.6 4.9 5.4 2.3 3.3 2.4 3.1 1.6 1.0 52.8<br />
2002–03 9.8 7.7 5.0 5.9 2.6 3.7 1.9 3.4 1.9 1.1 53.5<br />
2003–04 10.4 7.5 5.5 6.0 2.9 3.0 1.8 3.3 2.3 1.6 55.1<br />
2004–05 11.7 7.6 5.1 5.4 3.1 3.0 1.8 2.7 1.9 1.5 53.4<br />
2005–06 13.2 7.2 5.0 5.1 4.2 3.6 1.7 2.7 1.3 1.5 55.1<br />
2006–07 14.0 7.2 5.6 6.1 5.2 4.2 2.1 3.5 0.8 1.7 60.1<br />
2007–08 13.8 7.4 5.3 4.2 6.0 3.9 2.1 3.7 1.4 1.8 59.8<br />
2008–09 13.9 5.0 5.1 4.4 2.9 3.7 2.0 2.5 1.3 1.3 51.6<br />
2009–10 14.3 7.2 4.8 5.2 3.2 3.3 2.1 1.7 0.9 0.9 52.8<br />
2010–11 14.4 7.1 5.1 3.8 3.7 3.1 2.1 1.5 1.1 0.9 52.1<br />
Average per cent change ( % )<br />
1 year 0.3 -1.3 7.0 -26.9 12.8 -8.4 -1.4 -8.2 23.9 -0.7 -1.2<br />
5 years 1.5 -1.2 -1.1 -5.3 -7.8 -4.6 2.9 -14.3 -0.7 -13.2 -2.3<br />
a “All ports” include the top ten ports and other ports not listed separately.<br />
Note: The top ten ports are <strong>Australian</strong> ports that loaded, or discharged, the largest volume of coastal <strong>freight</strong> summed over recent ten years. The ports are sorted in descending order by the<br />
weight in the most recent year with the port ranked the first on the left in the table.<br />
The statistics of some ports include data for other associated ports, terminals or facilities. The full list of ports and grouped ports/terminals/facilities is in “Appendix A: <strong>Australian</strong> ports”.<br />
Source: BITRE (2012).<br />
• 29 •


