

Statistical report Australian sea freight 2010â11
Statistical report Australian sea freight 2010â11
Statistical report Australian sea freight 2010â11

Create successful ePaper yourself
Turn your PDF publications into a flip-book with our unique Google optimized e-Paper software.
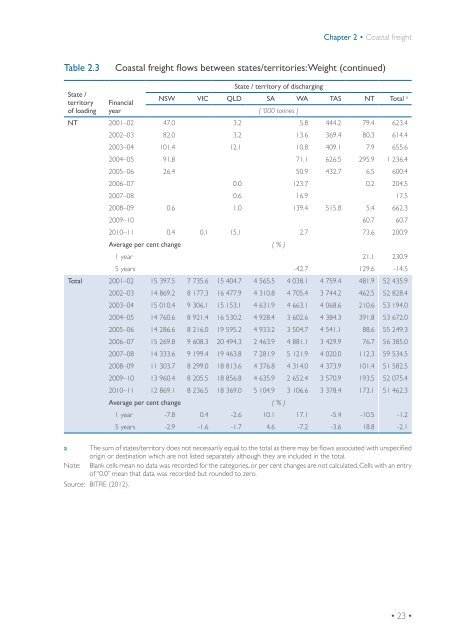
Chapter 2 • Coastal <strong>freight</strong><br />
Table 2.3<br />
Coastal <strong>freight</strong> flows between states/territories: Weight (continued)<br />
a<br />
State /<br />
territory<br />
of loading<br />
Financial<br />
year<br />
State / territory of discharging<br />
NSW VIC QLD SA WA TAS NT Total a<br />
( ‘000 tonnes )<br />
NT 2001–02 47.0 3.2 5.8 444.2 79.4 623.4<br />
2002–03 82.0 3.2 13.6 369.4 80.3 614.4<br />
2003–04 101.4 12.1 10.8 409.1 7.9 655.6<br />
2004–05 91.8 71.1 626.5 295.9 1 236.4<br />
2005–06 26.4 50.9 432.7 6.5 600.4<br />
2006–07 0.0 123.7 0.2 204.5<br />
2007–08 0.6 16.9 17.5<br />
2008–09 0.6 1.0 139.4 515.8 5.4 662.3<br />
2009–10 60.7 60.7<br />
2010–11 0.4 0.1 15.1 2.7 73.6 200.9<br />
Average per cent change ( % )<br />
1 year 21.1 230.9<br />
5 years -42.7 129.6 -14.5<br />
Total 2001–02 15 397.5 7 735.6 15 404.7 4 565.5 4 038.1 4 759.4 481.9 52 435.9<br />
Note:<br />
2002–03 14 869.2 8 177.3 16 477.9 4 310.8 4 705.4 3 744.2 462.5 52 828.4<br />
2003–04 15 010.4 9 306.1 15 153.1 4 631.9 4 663.1 4 068.6 210.6 53 194.0<br />
2004–05 14 760.6 8 921.4 16 530.2 4 928.4 3 602.6 4 384.3 391.8 53 672.0<br />
2005–06 14 286.6 8 216.0 19 595.2 4 933.2 3 504.7 4 541.1 88.6 55 249.3<br />
2006–07 15 269.8 9 608.3 20 494.3 2 463.9 4 881.1 3 429.9 76.7 56 385.0<br />
2007–08 14 333.6 9 199.4 19 463.8 7 281.9 5 121.9 4 020.0 112.3 59 534.5<br />
2008–09 11 303.7 8 299.0 18 813.6 4 376.8 4 314.0 4 373.9 101.4 51 582.5<br />
2009–10 13 960.4 8 205.5 18 856.8 4 635.9 2 652.4 3 570.9 193.5 52 075.4<br />
2010–11 12 869.1 8 236.5 18 369.0 5 104.9 3 106.6 3 378.4 173.1 51 462.3<br />
Average per cent change ( % )<br />
1 year -7.8 0.4 -2.6 10.1 17.1 -5.4 -10.5 -1.2<br />
5 years -2.9 -1.6 -1.7 4.6 -7.2 -3.6 18.8 -2.1<br />
The sum of states/territory does not necessarily equal to the total as there may be flows associated with unspecified<br />
origin or destination which are not listed separately although they are included in the total.<br />
Blank cells mean no data was recorded for the categories, or per cent changes are not calculated. Cells with an entry<br />
of “0.0” mean that data was recorded but rounded to zero.<br />
Source: BITRE (2012).<br />
• 23 •


