6 - Kuwait Oil Company
6 - Kuwait Oil Company
6 - Kuwait Oil Company

Create successful ePaper yourself
Turn your PDF publications into a flip-book with our unique Google optimized e-Paper software.
It must be highlighted that in the literature papers, tables<br />
of A/L systems typical application shows values such<br />
as SRP maximum rate: 4000 BPD, and maximum lift of<br />
10.000 ft, where in reality it is impossible to produce<br />
4000 BPD with 10.000 ft of lift (4300 psi differential<br />
pressure). What is real is 4000 BPD with 700 feet of<br />
lift in a 9 5/8” casing or 100 BPD with 10.000 ft of lift.<br />
In contrast, ALES’s rules are based in the physics of the<br />
system, especially for parameters that are related to each<br />
other. As example, the production rate and pressure<br />
requirements are related by the maximum power that<br />
the shaft can support (because of maximum stresses<br />
for a given pumping speed) as well as the maximum<br />
differential pressure that cracks the ESP housing (burst<br />
pressure). Since the power is equal to the production rate<br />
multiplied by the differential pressure then the maximum<br />
differential depends on the rate and shaft resistance.<br />
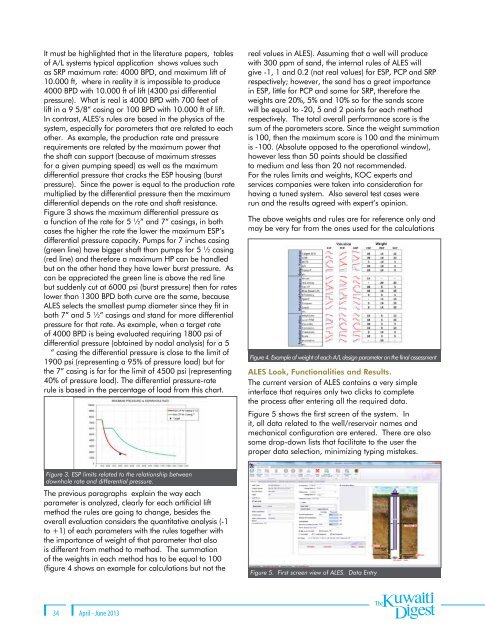
Figure 3 shows the maximum differential pressure as<br />
a function of the rate for 5 ½” and 7” casings, in both<br />
cases the higher the rate the lower the maximum ESP’s<br />
differential pressure capacity. Pumps for 7 inches casing<br />
(green line) have bigger shaft than pumps for 5 ½ casing<br />
(red line) and therefore a maximum HP can be handled<br />
but on the other hand they have lower burst pressure. As<br />
can be appreciated the green line is above the red line<br />
but suddenly cut at 6000 psi (burst pressure) then for rates<br />
lower than 1300 BPD both curve are the same, because<br />
ALES selects the smallest pump diameter since they fit in<br />
both 7” and 5 ½” casings and stand for more differential<br />
pressure for that rate. As example, when a target rate<br />
of 4000 BPD is being evaluated requiring 1800 psi of<br />
differential pressure (obtained by nodal analysis) for a 5<br />
½” casing the differential pressure is close to the limit of<br />
1900 psi (representing a 95% of pressure load) but for<br />
the 7” casing is far for the limit of 4500 psi (representing<br />
40% of pressure load). The differential pressure-rate<br />
rule is based in the percentage of load from this chart.<br />
real values in ALES). Assuming that a well will produce<br />
with 300 ppm of sand, the internal rules of ALES will<br />
give -1, 1 and 0.2 (not real values) for ESP, PCP and SRP<br />
respectively; however, the sand has a great importance<br />
in ESP, little for PCP and some for SRP, therefore the<br />
weights are 20%, 5% and 10% so for the sands score<br />
will be equal to -20, 5 and 2 points for each method<br />
respectively. The total overall performance score is the<br />
sum of the parameters score. Since the weight summation<br />
is 100, then the maximum score is 100 and the minimum<br />
is -100. (Absolute opposed to the operational window),<br />
however less than 50 points should be classified<br />
to medium and less than 20 not recommended.<br />
For the rules limits and weights, KOC experts and<br />
services companies were taken into consideration for<br />
having a tuned system. Also several test cases were<br />
run and the results agreed with expert’s opinion.<br />
The above weights and rules are for reference only and<br />
may be very far from the ones used for the calculations<br />
Figure 4. Example of weight of each A/L design parameter on the final assessment<br />
ALES Look, Functionalities and Results.<br />
The current version of ALES contains a very simple<br />
interface that requires only two clicks to complete<br />
the process after entering all the required data.<br />
Figure 5 shows the first screen of the system. In<br />
it, all data related to the well/reservoir names and<br />
mechanical configuration are entered. There are also<br />
some drop-down lists that facilitate to the user the<br />
proper data selection, minimizing typing mistakes.<br />
Figure 3. ESP limits related to the relationship between<br />
downhole rate and differential pressure.<br />
The previous paragraphs explain the way each<br />
parameter is analyzed, clearly for each artificial lift<br />
method the rules are going to change, besides the<br />
overall evaluation considers the quantitative analysis (-1<br />
to +1) of each parameters with the rules together with<br />
the importance of weight of that parameter that also<br />
is different from method to method. The summation<br />
of the weights in each method has to be equal to 100<br />
(figure 4 shows an example for calculations but not the<br />
Figure 5. First screen view of ALES. Data Entry<br />
34<br />
April - June 2013