Download our latest Annual Report - Bakkavor
Download our latest Annual Report - Bakkavor
Download our latest Annual Report - Bakkavor

You also want an ePaper? Increase the reach of your titles
YUMPU automatically turns print PDFs into web optimized ePapers that Google loves.
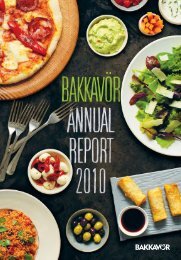
<strong>Annual</strong> report<br />
AND accounts 2012
BAKKAVOR ANNUAL REPORT AND ACCOUNTS 2012<br />
bakkavor is a leading international<br />
manufacturer of fresh prepared foods<br />
We specialise in developing private label products<br />
for major global grocery retailers and well-known<br />
international foodservice operators. We have 58<br />
manufacturing facilities, employ over 19,000<br />
people and make over 6,000 products.<br />
highlights<br />
key figures and<br />
developments in 2012<br />
chairman’s address<br />
<strong>our</strong> chairman, lydur<br />
gudmundsson, provides<br />
an update on <strong>our</strong> new<br />
corporate structure<br />
and board changes.<br />
bakkavor: the fast read<br />
In this ‘Fast Read’ section of the <strong>Annual</strong><br />
<strong>Report</strong> we have summarised key information<br />
about <strong>Bakkavor</strong> and how we run <strong>our</strong> business.<br />
For a more detailed insight into <strong>our</strong> operating<br />
and financial performance in 2012 please read<br />
<strong>our</strong> 2012 <strong>Annual</strong> <strong>Report</strong> in its entirety.<br />
Our three areas of focus:<br />
leading growing investing<br />
CEO welcome 4<br />
Our business at a glance 5<br />
Our f<strong>our</strong> point strategy for growth 7<br />
Key performance indicators 8<br />
Business model 9<br />
Market trends 11<br />
Leading, Growing, Investing 13<br />
Our risks 19<br />
Corporate governance 20<br />
Our responsibilities 21<br />
<strong>our</strong> performance<br />
Our CEO, Agust Gudmundsson, and CFO, Peter Gates,<br />
provide a detailed insight into <strong>our</strong> 2012 operating and<br />
financial performance. We also outline the market<br />
trends influencing <strong>our</strong> new product development<br />
and report on <strong>our</strong> progress with <strong>our</strong> corporate social<br />
responsibility priorities.<br />
Business review 23<br />
Financial review 26<br />
Market trends 29<br />
Our responsibilities 34<br />
<strong>our</strong> governance<br />
In this section we present <strong>our</strong> Board and Management<br />
Board profiles, explain <strong>our</strong> corporate governance<br />
approach and set out <strong>our</strong> principal risks and how<br />
we aim to address them.<br />
Board of Directors 43<br />
Management Board 44<br />
Corporate governance 45<br />
Our risks 49<br />
Directors’ report 51<br />
financial statements<br />
The Financial Statements of <strong>Bakkavor</strong> Finance (2) plc<br />
for the 52 weeks ended 29 December 2012.<br />
Independent Auditor’s report 53<br />
Consolidated financial statements 54<br />
Notes to the consolidated financial statements 59<br />
Company financial statements 100<br />
Notes to the Company financial statements 103<br />
Appendix: Reconciliation of continued and108<br />
discontinued activities to total Group trading<br />
page 1 VIEW THE FULL REPORT AT ANNUALREPORT12.BAKKAVOR.COM
BAKKAVOR ANNUAL REPORT AND ACCOUNTS 2012<br />
highlights<br />
adjusted ebitda 1<br />
£115m £1,718m £23.5m<br />
like -for-like sales 2 free cash flow 3<br />
7% 5% 14%<br />
(£108m: 2011) (£1,629m: 2011)<br />
(£20.6m: 2011)<br />
united kingdom<br />
ADJUSTED EBITDA 1 (£m)<br />
international<br />
ADJUSTED EBITDA 1 (£m)<br />
101<br />
11<br />
12<br />
£104m<br />
4%<br />
7£11m<br />
54%<br />
11 12<br />
26<br />
awards<br />
5 Grocer Own Label Gold Awards, UK<br />
5 Quality Food Awards, UK<br />
1 Fruit Logista Innovation Award, UK<br />
3 Supplier recognition awards from key<br />
customers in the UK, USA and China<br />
2 RoSPA Occupational Health & Safety<br />
Gold Awards, UK<br />
key developments<br />
• Strengthened <strong>our</strong> market-leading<br />
positions in <strong>our</strong> core UK fresh<br />
prepared foods market<br />
• Simplified <strong>our</strong> capital structure<br />
• Maintained a focused capital<br />
investment programme<br />
• Launched Group Apprenticeship Scheme<br />
and Group Innovation Awards<br />
1 Adjusted EBITDA: excludes restructuring costs, management charges to the Group’s parent company,<br />
asset impairments and those additional charges or credits that are one-off in nature and significance.<br />
2 Like-for-like sales: exclude the impact of acquisitions, disposals, closures, foreign exchange translation,<br />
but include the Group’s share of revenue generated by associates.<br />
3 Free cash flow: defined as the amount of cash generated by the business, after meeting its<br />
obligations for interest, tax and pensions, and after investments in tangible fixed assets.<br />
PAGE 2 VIEW THE FULL REPORT AT ANNUALREPORT12.BAKKAVOR.COM
BAKKAVOR ANNUAL REPORT AND ACCOUNTS 2012<br />
chairman’s address<br />
IN 2012 THE GROUP DELIVERED A STRONG FINANCIAL<br />
PERFORMANCE AGAINST A BACKDROP OF CHALLENGING<br />
MARKET CONDITIONS.<br />
In the same period, we simplified the Group’s capital<br />
structure, facilitating access to wider financial markets.<br />
This will allow the Group to take advantage of the<br />
considerable long-term growth potential in fresh<br />
prepared foods.<br />
Lydur Gudmundsson<br />
Non-executive Chairman<br />
MEETING LONG-TERM CONSUMER DEMAND<br />
Our belief that we can fulfil <strong>our</strong> vision to be recognised and respected as<br />
the world’s leading fresh prepared foods provider is underpinned by <strong>our</strong><br />
ability to meet long-term demand through <strong>our</strong> world-class operations,<br />
consumer knowledge and manufacturing expertise. We outline <strong>our</strong> f<strong>our</strong><br />
point strategy for growth to achieve <strong>our</strong> vision on page 7. Positive trends<br />
continue to drive the strong long-term demand for fresh prepared foods<br />
and we expand upon this on pages 11 and 29.<br />
2012 PERFORMANCE<br />
Despite continuing economic uncertainty the Group performed well in<br />
2012, achieving like-for-like sales growth of 5.4% which converted into<br />
EBITDA growth of £7.4 million. In the Business Review on page 23 <strong>our</strong><br />
CEO expands upon <strong>our</strong> performance.<br />
CORPORATE RESTRUCTURING<br />
A key achievement in 2012 was to attain a simpler corporate structure,<br />
addressing the Group’s legacy ownership and funding issues.<br />
On 28 September 2012 we announced the completion of this<br />
corporate re-organisation. <strong>Bakkavor</strong> Finance (2) plc’s ultimate parent<br />
became <strong>Bakkavor</strong> Group Limited, domiciled in the UK, with a single<br />
class of shares.<br />
In addition, after over 40 years of service in <strong>our</strong> business, Gordon Pates,<br />
<strong>our</strong> CEO of UK and Europe, retired from the Management Board in<br />
December 2012. Gordon will continue to work with us as a consultant,<br />
allowing us to continue to benefit from his extensive knowledge and<br />
experience in the fresh prepared foods market.<br />
Our three UK Managing Directors on the Management Board – Ivan<br />
Clingan, Mike Edwards and Steve Broadbent – have assumed Gordon’s<br />
day-to-day responsibilities and will continue to lead <strong>our</strong> customer<br />
relationships, as they have done for several years in the UK.<br />
OUR PEOPLE<br />
At <strong>Bakkavor</strong>, we continue to be immensely proud of the calibre of <strong>our</strong><br />
people and their passion and loyalty to the Group and we would like to<br />
thank them for their commitment throughout the year. Management<br />
remains focused on providing training to ‘grow <strong>our</strong> own’ people and<br />
enable them to develop to their best of their abilities.<br />
OUTLOOK<br />
The Group made good progress in 2012, particularly in the last quarter<br />
which gave the business momentum into 2013. Although the economic<br />
climate remains tough we are confident of <strong>our</strong> strategy and are well<br />
positioned in the fresh prepared foods market.<br />
The leverage covenant in the Group’s banking facilities was also reset<br />
to provide additional headroom.<br />
Finally, my brother, Agust Gudmundsson, and I personally invested<br />
£12.8 million through the issuance of new shares in <strong>Bakkavor</strong> Group<br />
Limited. These monies were used in repayment of borrowings.<br />
BOARD AND MANAGEMENT BOARD CHANGES<br />
Upon completion of the corporate restructuring, Asgeir Thoroddsen<br />
resigned from the Group Board as Non-executive Director and<br />
Gudmundur Sigurdsson was elected as a Non-executive Director on<br />
25 September 2012. I would like to take this opportunity to thank<br />
Asgeir for his many years of loyal service to the Group.<br />
Lydur Gudmundsson<br />
Non-executive Chairman<br />
20 February 2013<br />
the fast read<br />
how we do business at bakkavor<br />
PAGE 3 VIEW THE FULL REPORT AT ANNUALREPORT12.BAKKAVOR.COM
welcome<br />
to <strong>our</strong> <strong>Bakkavor</strong> 'Fast Read' which provides an<br />
overview of <strong>our</strong> business, complementing more<br />
detailed information on <strong>our</strong> website.<br />
working smarter<br />
through innovation<br />
I am passionate about innovation<br />
and chair the Group’s Innovation<br />
Committee to drive innovation<br />
throughout the business. In 2012 we<br />
launched <strong>our</strong> first Group Innovation<br />
Awards covering six categories –<br />
Manufacturing, Core Product, New to<br />
Market Product, Marketing, Packaging<br />
and Process – reaffirming <strong>our</strong> belief<br />
that innovation is relevant to all<br />
business disciplines across the Group.<br />
The highly competitive market environment in<br />
which we operate is now a given. Our focus on<br />
benefiting commercially and operationally from<br />
<strong>our</strong> leading positions and relationships, growing<br />
sustainably in existing and new markets and<br />
investing with rigorous discipline has never been<br />
more important. Underpinning this focus is <strong>our</strong><br />
relentless commitment to promoting innovation<br />
in everything we do in order for <strong>our</strong> businesses to<br />
work more effectively and creatively together.<br />
Together with <strong>our</strong> clear strategy, robust business<br />
model, talented employees and a strong set of<br />
values, we are confident of <strong>our</strong> ability to succeed<br />
in <strong>our</strong> chosen markets. I hope you enjoy reading<br />
about <strong>our</strong> business in the following pages.<br />
Agust Gudmundsson<br />
Chief Executive Officer<br />
Throughout this brochure we indicate<br />
where innovative thinking has brought<br />
significant commercial benefits to <strong>our</strong><br />
business, demonstrating <strong>our</strong> ability to<br />
turn ideas into actions.<br />
page 4<br />
www.bakkavor.com
<strong>our</strong><br />
business<br />
at a<br />
glance<br />
<strong>Bakkavor</strong> is a leading international<br />
manufacturer of fresh prepared<br />
foods, employing over 19,000<br />
people worldwide across 58<br />
operating facilities.<br />
We manufacture products across 18<br />
different categories. In <strong>our</strong> core UK market<br />
we are leaders in 13 out of the 16 chilled<br />
market categories in which we operate.<br />
Our customers include major global<br />
grocery retailers and well-known<br />
international foodservice operators and<br />
we specialise in making products for them<br />
under their respective private labels.<br />
+40<br />
years'<br />
private label<br />
expertise<br />
over 6,000 products<br />
key figures 2012<br />
adjusted EBITDA 1 (£m)<br />
£115 m (£108m:<br />
FREE CASH FLOW 3 (£m)<br />
£23.5m<br />
REVENUE BY DIVISION<br />
Ready<br />
meals<br />
Ready<br />
meals<br />
Ready to<br />
cook<br />
Ready<br />
meals<br />
meals<br />
7%<br />
2011)<br />
Ready<br />
meals<br />
Ready to<br />
cook<br />
Ready<br />
meals<br />
meals<br />
Dips<br />
Ready to<br />
cook<br />
meals<br />
14%<br />
(£20.6m: 2011)<br />
<strong>our</strong> products<br />
United Kingdom<br />
83%<br />
International<br />
17%<br />
Prepared<br />
fruit<br />
Ready<br />
meals<br />
Ready to<br />
cook<br />
Ready<br />
meals<br />
meals<br />
Dips<br />
Ready to<br />
cook<br />
meals<br />
Prepared<br />
fruit<br />
Ready<br />
meals<br />
Ready to<br />
cook<br />
Ready<br />
meals<br />
meals<br />
like-for-like sales 2 (£m)<br />
£1,718m (£1,629m:<br />
Capital expenditure (£m)<br />
£32.4m (£41.8m:<br />
EMPLOYEEs BY DIVISION<br />
United Kingdom •<br />
International •<br />
Dips<br />
Ready to<br />
cook<br />
meals<br />
Ready to<br />
cook<br />
meals<br />
Ready meals &<br />
ethnic snacks<br />
••<br />
Dips<br />
Ready to<br />
cook<br />
meals<br />
Ready to<br />
cook meals<br />
••<br />
Pasta<br />
Dips<br />
Prepared<br />
fruit<br />
Dips<br />
••<br />
Ethnic<br />
snacks<br />
Ready<br />
meals<br />
Dips<br />
Pasta<br />
Dips<br />
Prepared<br />
fruit<br />
5%<br />
2011)<br />
22%<br />
2011)<br />
United Kingdom<br />
80%<br />
International<br />
20%<br />
Ready to<br />
cook<br />
meals<br />
Soups<br />
Prepared<br />
Pasta<br />
vegetables<br />
Soups<br />
Ethnic<br />
snacks<br />
Bakery<br />
products<br />
Prepared<br />
vegetable<br />
Soups Prepared<br />
Bakery<br />
Sauces<br />
Pasta<br />
vegetables<br />
Soups<br />
products<br />
Prepared<br />
Bakery<br />
Leafy<br />
Pizza vegetables Desserts & products<br />
salads<br />
pastries<br />
Pasta<br />
Soups Prepared<br />
Bakery<br />
Sauces Sandwiches &<br />
Dips<br />
Pasta<br />
vegetables<br />
Soups<br />
products<br />
Prepared<br />
Bakery<br />
wraps<br />
Sauces<br />
Ethnic<br />
Leafy<br />
Pizza vegetables<br />
& products Stir fries<br />
snacks<br />
Prepared<br />
salads<br />
Desserts<br />
Ethnic<br />
Leafy<br />
pastries<br />
Pizza<br />
Desserts &<br />
fruit<br />
snacks<br />
salads<br />
pastries<br />
Pasta<br />
Dips<br />
Soups<br />
Prepared fruit<br />
••<br />
Leafy salads<br />
••<br />
Pizza<br />
••<br />
Leafy<br />
salads<br />
Pasta<br />
Prepared<br />
vegetables<br />
Pasta<br />
& pastries<br />
•<br />
Pasta<br />
Soups Prepared<br />
Bakery<br />
Sauces •• Sandwiches &<br />
Dips<br />
Pasta<br />
vegetables<br />
Soups<br />
products<br />
Prepared<br />
Bakery<br />
wraps<br />
Sauces Fresh Sandwiches produce<br />
Ethnic<br />
Leafy<br />
Pizza vegetables Desserts & products Stir fries<br />
Smoothies wraps C<br />
snacks<br />
Prepared<br />
salads<br />
Ethnic Soups Leafy<br />
pastries<br />
Pizza Stir fries Desserts & Stir fries<br />
fruit<br />
snacks<br />
salads<br />
pastries<br />
••<br />
•<br />
10 countries<br />
Ready<br />
Ready<br />
Ready to<br />
meals<br />
Dips<br />
meals<br />
cook<br />
of operation<br />
meals<br />
Ready<br />
Ready to<br />
meals<br />
cook Ready<br />
meals meals<br />
page 5<br />
Ready<br />
meals<br />
Ready to<br />
cook<br />
meals<br />
Ready<br />
meals<br />
Prepared<br />
fruit<br />
Dips<br />
Ready to<br />
cook<br />
Ethnic<br />
meals<br />
snacks<br />
Prepared<br />
fruit<br />
Pasta<br />
Ready<br />
meals<br />
Ready to<br />
cook<br />
meals<br />
Dips<br />
Dips<br />
Pasta<br />
Soups Prepared<br />
Bakery<br />
Sauces Sandwiches &<br />
Ready to<br />
Dips<br />
Pasta vegetables Soups products Prepared<br />
Bakery wraps Sauces<br />
cook<br />
vegetables<br />
products<br />
meals<br />
Bakery<br />
Prepared<br />
Ethnic<br />
Leafy<br />
Pizza<br />
Desserts &<br />
fresh prepared<br />
fruit<br />
food<br />
snackscategories<br />
salads<br />
pastries<br />
Stir fries<br />
Prepared<br />
fruit<br />
Leafy<br />
salads<br />
Ready to<br />
meals cook<br />
Pasta<br />
meals<br />
Prepared<br />
fruit<br />
Dips<br />
Prepared Ethnic<br />
We<br />
snacks fruit Pizza<br />
Prepared<br />
fruit<br />
Ethnic<br />
snacks<br />
Prepared<br />
fruit<br />
Pasta<br />
Leafy<br />
salads<br />
Ethnic<br />
snacks<br />
Ready Dips to<br />
Pasta Dips<br />
Soups Pasta<br />
Prepared Soups Prepared Bakery<br />
Bakery Sauces Sandwiches Sauces & Sandwiches &<br />
cook Soups Prepared<br />
Bakery<br />
vegetables<br />
Sauces vegetables Sandwiches<br />
products<br />
& products<br />
wraps<br />
Fresh wraps produce<br />
meals Ethnic vegetables Leafy products Pizza<br />
Desserts & wraps Stir fries Fresh produce Smoothies Convenience<br />
snacks<br />
Prepared<br />
Prepared<br />
salads<br />
Ethnic<br />
Leafy<br />
pastries<br />
Dressed<br />
Pizza<br />
Desserts & Stir fries<br />
salads<br />
Smoothies<br />
fruit<br />
snacks<br />
salads<br />
pastries<br />
also supply fresh<br />
produce in the UK<br />
vegetables<br />
••<br />
products<br />
••<br />
Sandwiches<br />
salads & wraps<br />
••<br />
Fresh Sandwiches produce &<br />
wraps<br />
Fresh produce<br />
Meal<br />
Smoothies Convenience Dressings<br />
salads<br />
Pasta<br />
Soups Prepared<br />
Bakery<br />
Sauces Sandwiches &<br />
Leafy Ethnic<br />
Leafy Pizza vegetables Desserts Pizza & productsDesserts Stir fries&<br />
Smoothies Stir fries wraps Convenience SmoothiesFresh produce Convenience Dressings<br />
salads snacks Desserts & salads Stir fries<br />
pastries<br />
Smoothies pastries Convenience Dressings<br />
salads<br />
Dressings<br />
salads<br />
pastries<br />
Soups Prepared<br />
Bakery<br />
Sauces Sandwiches &<br />
Ethnic<br />
Leafy vegetables Pizza productsDesserts & Stir fries wraps SmoothiesFresh produce Convenience<br />
snacks Prepared salads Ethnic<br />
Leafy<br />
pastries Pizza<br />
Desserts & Stir fries salads Smoothies<br />
fruit<br />
snacks<br />
salads<br />
pastries<br />
Soups Prepared<br />
Bakery<br />
Sauces Sandwiches &<br />
Pizza vegetables Desserts & products Stir fries<br />
Smoothies wraps ConvenienceFresh produ<br />
Leafy Sauces pastries<br />
Pizza<br />
Desserts & Smoothies Stir fries<br />
salads<br />
Smoothies<br />
salads<br />
pastries<br />
••<br />
•<br />
Dressings<br />
Convenience<br />
salads<br />
salads<br />
•<br />
salads<br />
••<br />
••<br />
Dressings<br />
Fresh produce<br />
Dressings<br />
Convenience<br />
salads<br />
Dressings
usiness segments<br />
united kingdom<br />
market leader in 13 of<br />
facilities<br />
<strong>our</strong> 16 product categories<br />
32 *<br />
adjusted EBITDA 1 (£m)<br />
101<br />
11<br />
12<br />
£104m<br />
4%<br />
like-for-like sales 2 (£m)<br />
1,342<br />
11<br />
12<br />
£1,416m<br />
6%<br />
83%<br />
of group sales<br />
* 32 facilities based in 24 locations<br />
international *<br />
adjusted EBITDA 1 (£m)<br />
17%<br />
of group sales<br />
7<br />
11 12<br />
£11m<br />
54%<br />
canada<br />
usa<br />
europe<br />
china<br />
like-for-like sales 2 (£m)<br />
287<br />
11 12<br />
£302m<br />
5%<br />
facilities<br />
26<br />
south africa<br />
1 Adjusted EBITDA: excludes restructuring costs, management charges to the Group’s parent company,<br />
asset impairments and those additional charges or credits that are one-off in nature and significance.<br />
2 Like-for-like sales: exclude the impact of acquisitions, disposals, closures, foreign exchange translation,<br />
but include the Group’s share of revenue generated by associates.<br />
3 Free cash flow: defined as the amount of cash generated by the business, after meeting its obligations<br />
for interest, tax and pensions, and after investments in tangible fixed assets.<br />
* International: Includes French and Spanish operations which are being sold subject to Competition<br />
Authority clearance.<br />
page 6
<strong>our</strong> f<strong>our</strong><br />
point<br />
strategy<br />
for<br />
growth<br />
<strong>our</strong> vision<br />
To be recognised and respected as the world’s<br />
leading fresh prepared foods provider.<br />
we aim to drive profitable growth through:<br />
Building on <strong>our</strong> leading positions in high-potential,<br />
fast-growing fresh prepared foods markets<br />
strategy in action 2012<br />
We re-invigorated the fresh soup market by expanding <strong>our</strong><br />
successful New York Soup Co range to include Skinny and<br />
Fully Loaded varieties. This was a direct result of focused<br />
market research and has led to a loyal customer following,<br />
a market share gain in 2012 and an incremental increase in<br />
the overall value of the soup market.<br />
Leveraging <strong>our</strong> strong customer relationships to drive<br />
mutual and profitable growth<br />
strategy in action 2012<br />
Our Creative Food business has invested in a new<br />
manufacturing facility in Xiamen (China) to meet the<br />
high demand experienced by one of <strong>our</strong> key customers<br />
for fresh prepared foods in the Chinese foodservice<br />
market. This business opportunity occurred as a direct<br />
result of the strong relationship we have forged with<br />
<strong>our</strong> customer, <strong>our</strong> proven track record of supporting<br />
their strategic growth plans and <strong>our</strong> commitment to<br />
high-quality products and standards.<br />
Our New York Soup Co<br />
products<br />
Creative Food's new<br />
manufacturing facility<br />
Setting the industry benchmark for safety, quality,<br />
service and innovation through the talent and<br />
commitment of <strong>our</strong> people<br />
strategy in action 2012<br />
Two Chefs (USA), Isleport Foods (UK) and Creative Food<br />
(China) all received supplier awards from their customers<br />
in recognition of their service and partnership approach.<br />
In addition, and testament to <strong>our</strong> product quality and<br />
innovation, we received 11 food product awards in 2012.<br />
Our determination to provide a safe environment in which<br />
to work continues to improve with <strong>our</strong> health and safety<br />
performance remaining ahead of the <strong>latest</strong> food and drink<br />
industry benchmark.<br />
Employees at the Group's<br />
2012 Innovation Awards<br />
Delivering sustainable long-term growth through<br />
capital investment and a continued focus on efficiency<br />
strategy in action 2012<br />
We officially opened a dedicated facility for handling<br />
nuts, sesame and nut oils in April 2012. This facility at<br />
Caledonian Produce is the only one of its kind in the UK<br />
and has enabled us to meet the high demand for recipes<br />
containing these ingredients, improve <strong>our</strong> manufacturing<br />
efficiency and release capacity at the adjacent site for<br />
other growth projects.<br />
Our wholefood nutty salad<br />
page 7
key performance indicators<br />
WE USE A RANGE OF FINANCIAL AND NON-FINANCIAL PERFORMANCE<br />
INDICATORS TO MEASURE WHAT MATTERS TO US AND HOW SUCCESSFUL<br />
WE ARE AT ACHIEVING OUR LONG-TERM STRATEGIC AIMS.<br />
financial kpis: investing in growth through product innovation<br />
KPI 2012 performance why this is important<br />
like-for-like sales<br />
£1,718m<br />
Growth in <strong>our</strong> like-for-like sales<br />
11 1,629<br />
demonstrates how successful <strong>our</strong><br />
underlying business is at generating<br />
12<br />
5%<br />
sales through product innovation,<br />
effective promotional mechanisms<br />
and business wins.<br />
ADJUSTED EBITDA<br />
11 107.7<br />
12<br />
FREE CASH FLOW<br />
11 20.6<br />
12<br />
£23.5m<br />
Generating free cash flow enables<br />
us to re-invest funds back into the<br />
business for future growth and to pay<br />
down debt.<br />
non-financial kpis: COMMITMENT TO A SUSTAINABLE BUSINESS<br />
KPI 2012 performance why this is important<br />
MAJOR ACCIDENTS PER<br />
100,000 EMPLOYEES<br />
Industry<br />
average<br />
08 09 10 11<br />
12<br />
EMPLOYEE RETENTION<br />
We measure % retention<br />
rates for managers and<br />
site-graded employees.<br />
EMPLOYEE SUCCESSION<br />
We measure % of<br />
employees (above a<br />
certain band) who are<br />
reviewed proactively<br />
every six months for<br />
career development.<br />
£115.1m<br />
improvement<br />
on 2011<br />
26%<br />
management<br />
90% retained vs 90%<br />
site- graded<br />
92% employees RETAINED vs 75%<br />
75%<br />
REVIEWED<br />
in 2012<br />
7%<br />
14%<br />
target<br />
target<br />
Our aim is to<br />
review 100%<br />
EVERY MONTH<br />
REPORTS ARE MADE TO THE<br />
MANAGEMENT BOARD ON<br />
ALL OF OUR KPIs<br />
Our Adjusted EBITDA demonstrates<br />
whether we are generating a good<br />
return on investment through<br />
sales, and offsetting underlying<br />
cost pressures in <strong>our</strong> business with<br />
productivity investments.<br />
We are committed to taking every<br />
reasonable step to deliver quality<br />
products whilst protecting the health<br />
and safety of <strong>our</strong> employees.<br />
Retaining high-calibre employees<br />
who have the right behavi<strong>our</strong>al values<br />
and having systems in place to ensure<br />
they can develop with us to the best of<br />
their potential is fundamental to <strong>our</strong><br />
long-term success.<br />
page 8
<strong>our</strong> business model<br />
creating long-term value<br />
Our primary business<br />
focus is the manufacture<br />
of fresh prepared foods for<br />
major grocery retailers and<br />
international foodservice<br />
operators under their<br />
respective private labels.<br />
1 2<br />
We create safe, high-quality foods<br />
for <strong>our</strong> customers which deliver<br />
a return for them whilst providing<br />
choice and value for money to<br />
their consumers. We use the<br />
cash generated to re-invest in<br />
future business growth and to<br />
meet <strong>our</strong> financial obligations.<br />
Our re-investment in the business<br />
allows us to make continuous<br />
improvements to <strong>our</strong> res<strong>our</strong>ces,<br />
processes and products which<br />
strengthen <strong>our</strong> position as a partner<br />
and employer of choice.<br />
Over 2,000<br />
products<br />
launched in 2012<br />
customers<br />
We aim to develop<br />
long-lasting relationships<br />
with <strong>our</strong> customers by<br />
working closely with them to<br />
understand their customers<br />
and their requirements.<br />
This ensures that we<br />
develop, manufacture and<br />
supply safe, innovative,<br />
high-quality products.<br />
5<br />
Core values<br />
underpin the way<br />
we do business<br />
5.4%<br />
3<br />
underlying<br />
sales growth<br />
In 2012<br />
supplier awards<br />
Received from <strong>our</strong><br />
customers in 2012<br />
products<br />
We continue to be at the<br />
forefront of consumer<br />
and market trends. This is<br />
fundamental to developing<br />
products that meet the needs<br />
of today’s consumers and<br />
enabling us to stay ahead of<br />
the market. Our innovative<br />
culture allows us to take action<br />
quickly and responsively in<br />
<strong>our</strong> fast-moving markets.<br />
11<br />
UK FOOD AWARDS<br />
IN 2012<br />
market insight<br />
Doubled <strong>our</strong> investment since 2009<br />
page 9
3 4 5<br />
assets<br />
Our commitment to<br />
continuous improvement<br />
means we are focused on<br />
making the right investments,<br />
implementing the right<br />
processes and recruiting and<br />
developing the right people to<br />
ensure that we make quality<br />
products as efficiently and<br />
effectively as possible in a<br />
safe environment.<br />
cash<br />
We maintain a strong focus<br />
on cash generation through<br />
effective working capital<br />
management and reviews<br />
of capital expenditure plans.<br />
We work closely with both<br />
customers and suppliers to<br />
ensure <strong>our</strong> delivery and<br />
supply chain is as efficient<br />
as possible.<br />
re-investment<br />
Our capital expenditure<br />
programme is highly selective<br />
and we expect to meet <strong>our</strong><br />
targeted returns on investment<br />
for all projects. We are focused<br />
on maintaining investment<br />
levels in the business whilst<br />
also reducing leverage and<br />
debt to strengthen <strong>our</strong><br />
capital structure.<br />
£32.4m<br />
CAPITAL<br />
EXPENDITURE<br />
£563.9m<br />
NET DEBT<br />
100%<br />
(£27.5M<br />
IN 2012<br />
reduction<br />
on 2011)<br />
CASH RE-INVESTMENT<br />
IN Chinese BUSINESS<br />
One of <strong>our</strong> major capital projects in<br />
2012 was a new state-of-the-art frying<br />
facility in the UK. This investment has<br />
improved product quality and efficiency,<br />
strengthened <strong>our</strong> core frying capabilities<br />
and is one of <strong>our</strong> centres of excellence<br />
within the Group.<br />
£23.5m<br />
Free cash<br />
flow<br />
(£2.9m improvement<br />
on 2011)<br />
Re-invested all cash generated in<br />
the Chinese operation back into the<br />
business and built a new factory to<br />
meet customer demand.<br />
page 10
market trends<br />
putting knowledge into action<br />
trends affecting<br />
<strong>our</strong> marketplace<br />
4 key macro trends<br />
have a significant effect on a large<br />
scale. They influence and shape all<br />
aspects of society in both the short<br />
and long term.<br />
6 key consumer trends<br />
reflect the changing demands,<br />
desires and attitudes of society as<br />
a result of the macro trends.<br />
6 key retail trends<br />
are shaped by consumer demand<br />
for products and services, and<br />
influence the way retailers invest<br />
in and develop their proposition<br />
to achieve sustainable growth and<br />
provide consumer choice.<br />
bakkavor action<br />
At <strong>Bakkavor</strong> we use <strong>our</strong> market<br />
insight and bespoke research to<br />
develop and launch commerciallysuccessful<br />
products which meet the<br />
needs of today’s consumer and the<br />
growth aspirations of <strong>our</strong> retail and<br />
foodservice partners.<br />
Our ability to translate market trends into commercially-successful<br />
products is critical to <strong>our</strong> long-term growth, particularly in today’s<br />
competitive business environment.<br />
Here we outline some of the key reasons behind <strong>our</strong> focused investment in the<br />
fresh prepared foods market and summarise the macro trends which are influencing<br />
consumer trends, shaping retail developments and, ultimately, the foods that we make.<br />
why fresh prepared foods<br />
1<br />
DYNAMIC<br />
2<br />
TIME-SAVING<br />
3<br />
STRATEGIC<br />
4<br />
built<br />
5<br />
BENEFIT<br />
& RESILIENT GROWTH<br />
The fresh prepared foods sector is one of the most dynamic and diverse in<br />
the food industry. It continues to grow faster than the overall food market<br />
by meeting consumer demand for high-quality food with fresh ingredients,<br />
alongside choice, convenience and value for money.<br />
& COST-SAVING LIFESTYLE CHOICE<br />
People are interested in new tastes and quality ingredients but do not<br />
always have the time, skill or budget to cook from scratch every day.<br />
Fresh prepared foods bridge this gap, increasingly becoming a lifestyle<br />
choice, due to their fresh appeal, ease of cooking (or preparing) and<br />
availability across a range of price tiers.<br />
IMPORTANCE FOR PRIVATE LABEL GROWTH<br />
Fresh prepared foods are sold predominantly under retailer private labels<br />
and are an integral part of a retailer’s overall brand strategy. They enable<br />
retailers to differentiate themselves from their competitors, which is crucial<br />
in today’s challenging retail environment. Private label continues to gain<br />
share in developed countries around the world.<br />
on LONG-LASTING RELATIONSHIPS<br />
Making fresh prepared foods under private labels brings with it the need<br />
for deep trust and understanding between suppliers and their customers.<br />
As products are made with fresh natural ingredients, suppliers must meet<br />
demanding customer specifications, involving day-to-day communication<br />
and excellent relationships. This is a barrier to entry rather than a risk.<br />
OF SPEED TO MARKET<br />
Compared to manufacturer-branded products, fresh prepared foods give<br />
retailers the opportunity to launch differentiated private label ranges<br />
relatively efficiently and cost-effectively, allowing them to benefit quickly<br />
from the demand for high-quality, convenient foods with fresh ingredients.<br />
page 11
More online<br />
For more information, please<br />
refer to 'Market trends' in the<br />
online annual report.<br />
annualreport12.bakkavor.com<br />
macro trends<br />
• Health concerns<br />
• Societal &<br />
technological change<br />
• Financial insecurity<br />
• Environmental issues<br />
15m<br />
500m<br />
TOP 10 COUNTRIES PROJECTED TO HAVE<br />
THE HIGHEST NUMBER OF SINGLE PERSON<br />
HOUSEHOLDS IN: 2020 (m)<br />
31.6<br />
36.3<br />
British consumers worry<br />
about their financial<br />
situation every single day.<br />
obese adults worldwide – nearly<br />
double the rate in 1980.<br />
8.0<br />
Ita<br />
10.5<br />
UK<br />
10.5<br />
Fra<br />
12.3<br />
Indo<br />
12.9<br />
Rus<br />
15.5<br />
Ger<br />
17.4<br />
Ind<br />
18.2<br />
Jap<br />
Chi<br />
USA<br />
S<strong>our</strong>ce: Russell Investments<br />
S<strong>our</strong>ce: The Lancet<br />
S<strong>our</strong>ce: Euromonitor International<br />
consumer trends<br />
• Well-being<br />
• Time pressure<br />
• Indulgence<br />
• Ethical consumption<br />
• Expanding repertoires<br />
• Smart shopping<br />
13,600 6/10<br />
more on promotion. Appstore in 2012.<br />
shoppers claim to be buying 'health' apps on Apple's<br />
S<strong>our</strong>ce: IGD<br />
S<strong>our</strong>ce: Miniwatts Marketing Group<br />
Our crayfish and mango salad with a coconut<br />
chilli dressing<br />
retail trends<br />
• Targeted health<br />
• Convenient shopping<br />
• Ethnic focus<br />
• Ethics & environment<br />
• Classic re-invention<br />
• Value & promotions<br />
£11.1bn<br />
VALUE OF<br />
UK INTERNET<br />
GROCERY MARKET<br />
S<strong>our</strong>ce: IGD<br />
STRONG GROWTH PREDICTED FOR CONVENIENCE<br />
STORES VALUE OF UK CONVENIENCE MARKET<br />
(£bn), 2012-2017F<br />
33.9<br />
35.6<br />
37.4<br />
39.4<br />
41.5<br />
43.6<br />
2012 2013f 2014f 2015f 2016f 2017f<br />
bakkavor action<br />
• Naturally light<br />
• Social communication<br />
• Just for one<br />
• New taste sensations<br />
• Meal deals<br />
• Classic fav<strong>our</strong>ites<br />
• Environmentally friendly<br />
we launched<br />
2000 + PRODUCTS IN 2012<br />
Our Spanish-style chicken meal salad for one<br />
page 12
for us, leadership means exceeding<br />
expectations in all we do<br />
By applying <strong>our</strong> market insight, excelling at customer<br />
service and developing products at the right commercial<br />
price we have gained leading positions in <strong>our</strong> markets.<br />
We strive to be the supplier of choice for existing and<br />
new customers.<br />
leading through innovation<br />
MARKET RE-INVIGORATION<br />
We used qualitative and quantitative research to<br />
develop and successfully launch <strong>our</strong> modern New York<br />
Soup Co brand. The brand has re-invigorated the chilled<br />
soups sector in the UK and over the past year we have<br />
included Skinny and Fully Loaded varieties. We market<br />
<strong>our</strong> New York Soup Co brand to consumers through a<br />
dedicated website and Facebook page. Already <strong>our</strong><br />
New York Soup Co has a loyal following of buyers.<br />
leading<br />
market<br />
positions<br />
In the UK – the largest and most<br />
developed market in which <strong>Bakkavor</strong><br />
operates – we are leaders in 13 of <strong>our</strong><br />
16 UK product categories.<br />
why it matters<br />
Leadership and product diversity bring<br />
with them proven expertise, influence,<br />
economies of scale and the ability to<br />
share ‘know-how’ across <strong>our</strong> Group.<br />
We use these leadership attributes,<br />
backed up by investments in insight,<br />
quality and innovation to build on<br />
strong customer partnerships to drive<br />
mutual growth.<br />
page 13
leading<br />
customer<br />
service<br />
leading<br />
market<br />
insight<br />
We make thousands of products<br />
everyday. We have an excellent track<br />
record in food safety and work in<br />
collaboration with <strong>our</strong> customers<br />
to meet their individual quality and<br />
safety requirements.<br />
why it matters<br />
Our absolute focus on customer<br />
service and food safety is not just a<br />
licence to operate but a true barrier to<br />
entry in <strong>our</strong> complex and just-in-time<br />
manufacturing environment.<br />
The consumer is at the heart of<br />
everything we do. Our considerable<br />
investment in consumer insight,<br />
leading-edge research and <strong>our</strong><br />
management expertise set us apart<br />
from <strong>our</strong> competition.<br />
why it matters<br />
Our ability to translate market trends<br />
into commercially-successful products<br />
is critical to the growth of the business.<br />
It strengthens <strong>our</strong> reputation for<br />
launching winning concepts with <strong>our</strong><br />
retail and foodservice customers and<br />
enables us to gain market share.<br />
facebook.com/newyorksoupco<br />
page 14
we aim to grow<br />
<strong>our</strong> business<br />
by targeting opportunities<br />
in high-growth markets,<br />
developing a strong<br />
product pipeline and<br />
maximising the potential<br />
of <strong>our</strong> people.<br />
growing in the<br />
right markets<br />
Growth for fresh prepared foods<br />
continues to exceed the demand<br />
for food in general and we remain<br />
focused on this dynamic area of<br />
the food market. Our core market is<br />
the UK and we are also targeting<br />
high-growth markets such as China.<br />
why it matters<br />
Our focus on fresh prepared foods<br />
allows us to build scale and expertise<br />
in this area which we can replicate in<br />
high-growth geographical markets<br />
around the world.<br />
5%<br />
10%<br />
uk fresh<br />
prepared<br />
foods<br />
growth<br />
Chinese<br />
Foodservice<br />
Growth<br />
growing through innovation<br />
TALENT PIPELINES<br />
The <strong>Bakkavor</strong> Development and Succession (DAS) process is focused on<br />
developing <strong>our</strong> people to meet their full potential, and we track individual<br />
employees ready to be promoted immediately as well as those ready for<br />
a move in the next 12 months. In 2012 we introduced Functional Talent<br />
Pipelines to help us measure the strength of each function today and its<br />
potential for the future. These initiatives help us promote from within<br />
wherever possible.<br />
page 15
growing <strong>our</strong><br />
product pipeline<br />
Within <strong>our</strong> market categories we target<br />
specific growth opportunities based<br />
on <strong>our</strong> consumer insight and customer<br />
understanding.<br />
why it matters<br />
Targeting growth opportunities through<br />
new product development is equally<br />
important to both <strong>our</strong> strategic business<br />
aspirations and those of <strong>our</strong> customers,<br />
who are looking to gain market share.<br />
11<br />
food<br />
awards<br />
growing <strong>our</strong><br />
own people<br />
We are committed to nurturing and<br />
growing the talents of <strong>our</strong> own people<br />
as a priority. Three key areas underpin<br />
<strong>our</strong> culture of personal development<br />
and help us to shape successful careers<br />
within the Group: annual performance<br />
reviews, development and succession<br />
planning and training.<br />
50%<br />
target<br />
vacancies<br />
to be filled<br />
by existing<br />
employees<br />
why it matters<br />
By ‘growing <strong>our</strong> own’ people, we<br />
ensure that <strong>our</strong> strong values and<br />
expert knowledge stay within the<br />
business. This approach also reinforces<br />
<strong>our</strong> aspiration to provide clear career<br />
development opportunities.<br />
page 16
we are investing for<br />
sustainable growth<br />
This means selecting capital<br />
projects that bring significant<br />
benefits to the business<br />
as well as attracting good<br />
people to develop their<br />
careers with us.<br />
£170m<br />
spent on capital projects<br />
over the past 5 years<br />
1<br />
investing with<br />
discipline<br />
We have a targeted capital<br />
expenditure programme which<br />
is rigorously focused on growth<br />
opportunities and efficiency<br />
improvements.<br />
why it matters<br />
Our focus has the ultimate aim<br />
of improving returns in order to<br />
facilitate future expansion plans.<br />
investing with innovation<br />
A UNIQUE PROCESS<br />
Our new dedicated facility for handling nuts, sesame and nut oils officially<br />
opened in April 2012 at Caledonian Produce. This facility is the only one of<br />
its kind in the UK and has enabled us to extend <strong>our</strong> process capabilities and<br />
meet growing consumer demand for healthy, high-protein foods.<br />
page 17
2<br />
6centres<br />
of<br />
excellence<br />
investing in<br />
excellence<br />
We are strengthening <strong>our</strong> category<br />
leadership and supporting <strong>our</strong><br />
growth plans by investing in centres<br />
of excellence which set us apart<br />
from <strong>our</strong> competition through<br />
leading processes, technology<br />
and machinery.<br />
why it matters<br />
Our specific and targeted investments<br />
have led to market share gain, new<br />
business wins and the re-invigoration<br />
of key market categories in which<br />
we operate.<br />
3 investing<br />
in people<br />
group apprenticeship<br />
scheme launched in 2012<br />
We have established schemes to<br />
recruit talented graduates and school<br />
leavers into the business and we<br />
are actively involved in promoting<br />
the benefits of working in food<br />
manufacturing by supporting<br />
industry initiatives.<br />
why it matters<br />
Working on initiatives that attract<br />
talented people into <strong>our</strong> dynamic<br />
business and marketplace is vital to<br />
ensure we have the right res<strong>our</strong>ce<br />
in place to meet customer needs<br />
and the long-term demand for fresh<br />
prepared foods.<br />
page 18
<strong>our</strong> risks<br />
More online<br />
For more information, please<br />
refer to 'Our risks' in the online<br />
annual report.<br />
annualreport12.bakkavor.com<br />
OPERATIONAL RISKS<br />
GROUP TECHNICAL DIRECTOR<br />
LOSS OF KEY<br />
EMPLOYEES<br />
FOOD SAFETY<br />
& INTEGRITY<br />
COMMODITY<br />
PRICE INFLATION<br />
HEALTH<br />
AND SAFETY<br />
CHIEF EXECUTIVE OFFICER<br />
CONSUMER<br />
UNDERSTANDING<br />
COVENANT<br />
COMPLIANCE<br />
MARKET RISKS<br />
CUSTOMER<br />
RELATIONSHIPS<br />
INTEREST RATES,<br />
LIQUIDITY<br />
AND CREDIT<br />
CHIEF FINANCIAL OFFICER<br />
FINANCIAL RISKS<br />
management of<br />
all risks assigned to<br />
INDIVIDUAL MANAGEMENT<br />
BOARD MEMBERS<br />
<strong>Bakkavor</strong> Group has identified eight key risks to the business. The<br />
successful mitigation of these risks is paramount to the day-to-day<br />
running of the business and the achievement of <strong>our</strong> long-term vision.<br />
risk management<br />
Our decentralised model empowers <strong>our</strong> management to identify, evaluate and<br />
manage the risks they face proactively. The management of principal risks is<br />
assigned to key members of the Management Board. It is their responsibility<br />
to report to the Board on a monthly basis regarding the actions associated with<br />
each of those risks.<br />
page 19
corporate governance<br />
how we manage bakkavor<br />
how we operate<br />
We operate within a governance framework which we believe provides<br />
assurance to all <strong>our</strong> stakeholders that <strong>Bakkavor</strong> is a well-managed,<br />
responsible company and which allows us to ensure that the Group Board<br />
and the Management Board:<br />
• have assessed the necessary options and are taking the business in the right<br />
strategic direction<br />
• are leading and managing the business effectively and are accountable for their actions<br />
• have put in place appropriate controls which are used actively throughout the business<br />
• consider the interests of all <strong>our</strong> stakeholders in making executive decisions.<br />
STAKEHOLDERS<br />
GROUP board<br />
The Board retains ultimate responsibility for upholding corporate governance standards<br />
and determining the strategic objectives of the Group.<br />
MANAGEMENT BOARD<br />
GROUP<br />
BOARD<br />
GROUP OPERATIONS<br />
Management Board<br />
The Management Board implements the strategic objectives set by the Group Board<br />
and approves Group policies. It monitors achievement against objectives and<br />
compliance with policies.<br />
group operatIONS<br />
Within appropriate risk parameters managers at <strong>our</strong> business units are tasked<br />
with the detailed planning and implementation of strategic objectives set by the<br />
Management Board.<br />
<strong>our</strong> management<br />
stakeholders<br />
We address all stakeholder interests through the <strong>Bakkavor</strong> values (see page 21).<br />
Our values are fundamental to <strong>our</strong> ability to run <strong>our</strong> business with integrity. We recruit<br />
new people and reward all managers against their ability to demonstrate <strong>our</strong> values<br />
in the day-to-day running of the business.<br />
average<br />
number<br />
of years in<br />
the food<br />
industry<br />
leading<br />
industry<br />
experts<br />
in food<br />
technology<br />
total years<br />
of service<br />
at <strong>Bakkavor</strong><br />
Our highly experienced Management Board is tasked with the successful<br />
operational running of <strong>our</strong> business within <strong>our</strong> corporate governance and<br />
risk management frameworks.<br />
board<br />
20 2 114<br />
1 Agust<br />
Gudmundsson<br />
Chief Executive<br />
Officer<br />
2 Peter Gates<br />
Chief Financial<br />
Officer<br />
3 Ann Savage<br />
Group Technical<br />
Director<br />
4 John Gorman<br />
President –<br />
<strong>Bakkavor</strong> North<br />
America<br />
5 Einar Gustafsson<br />
Managing Director<br />
– <strong>Bakkavor</strong> Asia<br />
6 Mike Edwards<br />
Sector Managing<br />
Director<br />
7 Ivan Clingan<br />
Sector Managing<br />
Director<br />
8 Steve Broadbent<br />
Sector Managing<br />
Director<br />
1 2 3 4<br />
5 6 7 8<br />
page 20
<strong>our</strong> responsibilities<br />
doing things the right way<br />
bakkavor<br />
values<br />
<strong>Bakkavor</strong> has five core values that directly<br />
influence the way we run <strong>our</strong> business. Our<br />
values define and shape <strong>our</strong> culture; they<br />
are what make <strong>Bakkavor</strong> different.<br />
customer care<br />
We are committed to supplying outstanding quality,<br />
value and service, never forgetting that <strong>our</strong> relationship<br />
with <strong>our</strong> customers is pivotal to <strong>our</strong> success.<br />
can do<br />
We enc<strong>our</strong>age personal initiative and empower<br />
<strong>our</strong> people to make things happen. Our motivation<br />
comes from a determination to succeed in all we do.<br />
teamwork<br />
We believe everyone has a valuable part to<br />
play in the success of the business. We aim to<br />
communicate effectively and are committed to<br />
the highest standards of ethics and integrity.<br />
innovation<br />
We thrive on challenges, looking for innovative ways<br />
to grow and improve <strong>our</strong> business further.<br />
getting it right, keeping it right<br />
We strive to deliver the right result every time in<br />
the most effective way, providing value for <strong>our</strong><br />
customers and stakeholders alike.<br />
managing <strong>our</strong><br />
responsibilities<br />
We have the structure and res<strong>our</strong>ces in place to<br />
manage <strong>our</strong> key Corporate Social Responsibility<br />
(CSR) areas effectively.<br />
food safety & csr initiatives<br />
PRIORITY FOCUS AREAS<br />
• Food safety<br />
• Health & Safety (H&S)<br />
• Environment<br />
employee initiatives<br />
PRIORITY FOCUS AREAS<br />
• Employee retention<br />
• Employee training and development<br />
• Other employee areas: diversity,<br />
temporary lab<strong>our</strong><br />
community initiatives<br />
PRIORITY FOCUS AREAS<br />
• Community understanding<br />
and support<br />
Measuring and improving <strong>our</strong> performance<br />
Performance in the three areas below is highlighted in <strong>our</strong> KPIs<br />
on page 8. Other CSR measures are reported online.<br />
Health & safety<br />
Major accidents per 100,000 employees.<br />
Employee retention<br />
% retention rates for managers and<br />
site-graded employees.<br />
Employee succession<br />
% employees (above a certain band)<br />
who have been reviewed every six<br />
months for career development.<br />
RESPONSIBILITY<br />
Group Technical Director,<br />
Central and business<br />
Technical teams<br />
RESPONSIBILITY<br />
Group and business<br />
HR teams<br />
RESPONSIBILITY<br />
<strong>Bakkavor</strong> businesses<br />
3 Group<br />
KPIs<br />
page 21
More online<br />
For more information, please<br />
refer to 'Our responsibilities' in<br />
the online annual report.<br />
annualreport12.bakkavor.com<br />
engaging with<br />
<strong>our</strong> stakeholders<br />
We aim to engage effectively with <strong>our</strong> identified<br />
stakeholders – the people who matter most to<br />
<strong>our</strong> business.<br />
running <strong>our</strong><br />
business sustainably<br />
By concentrating on areas which really matter to us<br />
we aim to run <strong>our</strong> business in a sustainable way and<br />
uphold <strong>our</strong> commitment to continuous improvement.<br />
Key stakeholder groups<br />
Employees<br />
Enc<strong>our</strong>aging effective employee engagement and<br />
communication across, and within, <strong>our</strong> businesses.<br />
Customers<br />
Building on <strong>our</strong> strong relationships to meet and exceed<br />
customer expectations.<br />
Local communities<br />
Understanding <strong>our</strong> local communities and enc<strong>our</strong>aging<br />
<strong>our</strong> businesses to support their needs.<br />
Suppliers<br />
Working closely with key suppliers to engage on safety,<br />
quality and pricing for mutual long-term benefit.<br />
Investors<br />
Communicating in an open, timely and unbiased manner<br />
with current and potential investors.<br />
Industry<br />
Taking an active role in industry working groups to ensure<br />
we are part of the debate.<br />
Some priority focus areas for 2013<br />
Health and Safety<br />
Continued development of <strong>our</strong> proactive accident<br />
prevention culture.<br />
Environment<br />
Working with <strong>our</strong> partners to improve further the amount of<br />
waste diverted from landfill.<br />
Employee development<br />
Implementation of a revised development and succession<br />
programme and related measures.<br />
Employee engagement<br />
Bespoke training to enhance the effectiveness of <strong>our</strong> Site<br />
Employee Forums.<br />
Industry engagement<br />
Helping to tackle long-term youth unemployment.<br />
COMMUNICATING MORE EFFECTIVELY WITH OUR EMPLOYEES<br />
At <strong>our</strong> 2012 Group Employee Forum we relaunched <strong>our</strong> values<br />
using a new ‘winning team’ theme to bring them to life and to<br />
embed them across the Group. The new look values are now<br />
being rolled out across the Group.<br />
always the<br />
winning team<br />
SKILLS FOR WORK<br />
In September 2012 we took part in a nationwide industry<br />
initiative in the UK to help tackle the issue of long-term youth<br />
unemployment through Skills for Work workshops. A number<br />
of <strong>our</strong> sites held half-day training sessions on CV writing and<br />
interview techniques.<br />
page 22
BAKKAVOR ANNUAL REPORT AND ACCOUNTS 2012<br />
business review<br />
2012 WAS A GOOD YEAR FOR THE GROUP, PARTICULARLY<br />
OUR PERFORMANCE IN THE LAST QUARTER WHICH GAVE<br />
THE BUSINESS MOMENTUM GOING INTO 2013.<br />
Although the economic climate remains tough we are<br />
confident of <strong>our</strong> strategy and are well positioned in the<br />
fresh prepared foods market.<br />
Agust Gudmundsson<br />
Chief Executive Officer<br />
WE ARE A LEADING INTERNATIONAL<br />
MANUFACTURER OF FRESH PREPARED<br />
FOODS, EMPLOYING OVER 19,000<br />
PEOPLE WORLDWIDE ACROSS 58<br />
OPERATING FACILITIES.<br />
LIKE-FOR-LIKE SALES 2 (£m)<br />
£1,718m<br />
REVENUE BY DIVISION<br />
5%<br />
(£1,629m: 2011)<br />
United Kingdom<br />
83%<br />
International<br />
17%<br />
SALES REVIEW<br />
In a very challenging economic environment,<br />
<strong>Bakkavor</strong> has retained its market share and<br />
extended its market-leading positions in key<br />
categories. We continue to grow ahead of<br />
the total foods market and we have benefited<br />
from <strong>our</strong> leading positions within this sector.<br />
Coupled with business wins enjoyed over the<br />
year and high levels of promotional activity, we<br />
continued to see good volume growth. This<br />
was achieved despite a number of adverse<br />
factors, including subdued consumer spending<br />
and exceptionally poor weather throughout the<br />
spring and summer.<br />
Our North American and Asian businesses<br />
continue to build on their strong customer<br />
relationships to drive International revenues.<br />
Our Asian business, in particular, benefited<br />
from a renewed capital investment programme<br />
that allowed us to increase capacity in line with<br />
<strong>our</strong> customers’ rapid growth plans.<br />
INFLATIONARY PRESSURES<br />
Whilst we benefited from deflation in raw<br />
material pricing in 2012 we are expecting that<br />
to reverse later in 2013. At this stage, however,<br />
we do not anticipate inflation reaching the<br />
levels seen in 2011.<br />
CONTINUED EXCELLENCE IN INNOVATION<br />
Raising the benchmark for innovation within<br />
the industry is core to <strong>our</strong> Group as we focus<br />
on attracting new customers and increasing<br />
sales. During the past year alone, we created<br />
and launched over 2,000 products across the<br />
business, received three supplier awards for<br />
excellence and won 11 industry food awards.<br />
INVESTING IN OUR BUSINESS<br />
Throughout 2012 we have focused on a series of<br />
capital projects to consolidate <strong>our</strong> market-leading<br />
positions and support <strong>our</strong> growth objectives.<br />
These investments have included: capacity<br />
enhancements to leverage the increasing<br />
demand for <strong>our</strong> products, such as chilled soups<br />
in the UK; product differentiation, which included<br />
water-only washing for <strong>our</strong> leaf based products;<br />
and efficiency investments as we continue to<br />
automate <strong>our</strong> production facilities.<br />
SALE OF FRENCH AND SPANISH BUSINESSES<br />
The Group has reached formal agreement to<br />
sell its French and Spanish produce businesses<br />
for €33 million debt-free cash-free. Completion<br />
of the transaction is subject to clearance by<br />
the Competition Authorities, which is expected<br />
by the end of the first half of 2013. The<br />
disposal of these businesses marks an<br />
important step in reshaping <strong>our</strong> portfolio to<br />
focus on <strong>our</strong> core fresh prepared market.<br />
FOOD INTEGRITY<br />
In January 2013 incidences of horsemeat<br />
contamination in the food supply chain affected<br />
a number of retailers and producers in Europe<br />
and weakened consumer trust in the food<br />
they buy. We maintain strict controls regarding<br />
product authenticity and quality control and<br />
are subject to regular inspection by food safety<br />
and other authorities for compliance with food<br />
laws such as traceability and food hygiene. We<br />
comply with strict national and international<br />
regulations and routinely inspect <strong>our</strong><br />
production facilities and audit <strong>our</strong> suppliers. We<br />
remain committed to the highest standards of<br />
food safety and integrity and continue to work<br />
with customers, suppliers and the authorities<br />
on rebuilding consumer trust.<br />
2 Like-for-like sales: exclude the impact of acquisitions, disposals, closures, foreign exchange<br />
translation, but include the Group’s share of revenue generated by associates.<br />
PAGE 23 VIEW THE FULL REPORT AT ANNUALREPORT12.BAKKAVOR.COM
BAKKAVOR ANNUAL REPORT AND ACCOUNTS 2012<br />
business review<br />
united kingdom<br />
leader<br />
in 13 of <strong>our</strong><br />
16 markets<br />
OUR UK LOCATIONS<br />
*<br />
2 3<br />
5<br />
4<br />
6 8 12<br />
7 9 10<br />
11 14 13<br />
16 15<br />
17 18 19<br />
22 21<br />
24<br />
23<br />
20<br />
1 Caledonian Produce<br />
West Lothian<br />
2 Melrow Salads<br />
Merseyside<br />
3 Hitchen Foods<br />
Wigan<br />
4 Yorkshire Fresh Fruit<br />
Selby<br />
5 New Primebake<br />
Barton-on-Humber<br />
6 New Primebake<br />
Nantwich<br />
7 New Primebake<br />
Crewe<br />
8 Welcome Foods<br />
Huthwaite<br />
9 Laurens Patisseries<br />
Newark<br />
10 <strong>Bakkavor</strong> Spalding<br />
Spalding<br />
11 Freshcook<br />
Holbeach St Marks<br />
12 Cucina Sano<br />
Boston<br />
13 <strong>Bakkavor</strong> Meals<br />
Sutton Bridge<br />
14 Wingland Foods<br />
Sutton Bridge<br />
15 <strong>Bakkavor</strong> Pizza<br />
Holbeach St Marks<br />
16 B<strong>our</strong>ne Prepared Produce<br />
B<strong>our</strong>ne<br />
17 <strong>Bakkavor</strong> Meals<br />
Park Royal<br />
18 <strong>Bakkavor</strong> Meals<br />
Elveden<br />
19 Anglia Crown Ltd<br />
Colchester<br />
20 Tilmanstone Salads<br />
Dover<br />
21 <strong>Bakkavor</strong> Meals<br />
Wembley<br />
22 <strong>Bakkavor</strong> Pizza<br />
Harrow<br />
23 Alresford Salads<br />
Alresford<br />
24 Isleport Foods<br />
Highbridge<br />
* 32 facilities based in 24 locations<br />
GROWTH IN THE UK FRESH<br />
PREPARED MARKET CONTINUED TO<br />
OUTPERFORM THE TOTAL FOODS<br />
MARKET. WE HAVE BENEFITED FROM<br />
OUR MARKET-LEADING POSITIONS<br />
WITHIN THIS SECTOR.<br />
ADJUSTED EBITDA 1 (£m)<br />
101<br />
11<br />
LIKE-FOR-LIKE SALES 2 (£m)<br />
1,342<br />
11<br />
12<br />
12<br />
£104m<br />
4%<br />
£1,416m<br />
6%<br />
SEGMENT description<br />
Our UK businesses primarily manufacture<br />
private label fresh prepared food products on<br />
behalf of all major grocery retailers in the UK.<br />
Facilities<br />
We operate 32 facilities and employ 15,440 people.<br />
Market positions<br />
We have over 40 years’ experience in the UK<br />
and enjoy leading or number two positions in<br />
all of the 16 market categories in which we<br />
are present. We estimate <strong>our</strong> consolidated<br />
market share across the categories in which<br />
we operate in the UK is close to 30% and two<br />
times larger than that of <strong>our</strong> nearest competitor.<br />
Sales performance<br />
Our UK segment generated revenue of<br />
£1,407.0 million in 2012, 83% of Group<br />
revenue and a 1.4% increase on 2011. On a<br />
like-for-like basis however, we were pleased<br />
to deliver 5.5% growth in the year and 10.2%<br />
in the final quarter. This level of growth,<br />
which was ahead of the market, was due to<br />
the successful delivery of a strong seasonal<br />
offering and was supported by <strong>our</strong> capital<br />
investment strategy over the past two years<br />
and increased spend on innovation. This strong<br />
revenue performance also delivered double<br />
digit growth in adjusted EBITDA.<br />
With regards to the full year, growth was<br />
almost entirely driven by increased volumes<br />
from promotional activity and new business.<br />
This was achieved despite a number of<br />
adverse factors, including subdued consumer<br />
spending and unusually poor weather<br />
throughout the spring and summer which<br />
impacted the sale of cold eat products.<br />
Adjusted EBITDA performance<br />
Adjusted EBITDA for the UK was £104.2<br />
million, compared with £100.6 million in<br />
2011, an increase of £3.6 million or 3.6%.<br />
Adjusted EBITDA margin increased by 20 basis<br />
points to 7.4% in 2012 as the UK benefited<br />
from increased sales and improved factory<br />
efficiencies, effective promotional management<br />
and factory efficiencies. This growth was also<br />
underpinned by the successes of <strong>our</strong> capital<br />
investment strategy in the past two years and<br />
increased spend on innovation.<br />
KEY INNOVATIONS AND ACHIEVEMENTS IN 2012<br />
Raising the benchmark for innovation within<br />
the industry is an integral part of <strong>our</strong> Group<br />
strategy as we focus on attracting consumers<br />
and stimulating sales. We created and<br />
launched over 1,300 products into the UK<br />
market during 2012 and won 11 industry<br />
food awards in recognition of <strong>our</strong> product<br />
development expertise.<br />
In the UK <strong>our</strong> innovation pipeline was strong<br />
throughout the year as a direct result of<br />
targeted capital investments in key categories.<br />
In soups we extended <strong>our</strong> highly successful<br />
New York Soup Co range. Investment in <strong>our</strong><br />
pizza category led to new business, including<br />
a major new range for one of <strong>our</strong> key retailer<br />
customers. Our investment in salad leaf<br />
processing technology further strengthened<br />
<strong>our</strong> market position.<br />
1 Adjusted EBITDA: excludes restructuring costs, management charges to the Group’s parent company,<br />
asset impairments and those additional charges or credits that are one-off in nature and significance.<br />
2 Like-for-like sales: exclude the impact of acquisitions, disposals, closures, foreign exchange translation,<br />
but include the Group’s share of revenue generated by associates.<br />
page 24 VIEW THE FULL REPORT AT ANNUALREPORT12.BAKKAVOR.COM
BAKKAVOR ANNUAL REPORT AND ACCOUNTS 2012<br />
business review<br />
international*<br />
+5%<br />
like-for-like<br />
sales growth<br />
OUR INTERNATIONAL LOCATIONS<br />
canada<br />
us<br />
europe<br />
south africa<br />
china<br />
CHINA<br />
Creative Food Group<br />
Shanghai<br />
Beijing<br />
Wuhan<br />
Haiman<br />
Xiamen<br />
Xianyang<br />
Guangzhou<br />
5 farms: Beijing Hebei,<br />
Anhui and Jiangsu<br />
Gastro Primo<br />
Hong Kong<br />
La Rose Noire<br />
Hong Kong<br />
US<br />
Two Chefs<br />
California<br />
Pennsylvania<br />
CANADA<br />
<strong>Bakkavor</strong> Foods Canada<br />
Ontario<br />
EUROPE<br />
Cinquième Saison<br />
St Pol-de-Léon, France<br />
Mâcon, France<br />
Crudi<br />
Torreilles, France<br />
Sogesol<br />
Murcia, Spain<br />
Vaco Olen<br />
Olen, Belgium<br />
Vaco Herselt<br />
Herselt, Belgium<br />
Heli Fresh Foods<br />
Milin, Czech Republic<br />
Italpizza<br />
Modena, Italy<br />
SOUTH AFRICA<br />
Spring Valley Foods<br />
Johannesburg<br />
* International: Includes French and Spanish operations which<br />
are being sold subject to Competition Authority clearance.<br />
OUR FOCUS ON INNOVATION<br />
CONTINUED IN OUR INTERNATIONAL<br />
BUSINESSES AS WE WORKED WITH<br />
OUR KEY CUSTOMERS TO SUPPORT<br />
THEIR EXTENSIVE GROWTH PLANS.<br />
adjusted ebitda 1 (£m)<br />
11<br />
like-for-like sales 2 (£m)<br />
287<br />
7£11m<br />
12<br />
54%<br />
£302m<br />
SEGMENT description<br />
Our International businesses predominantly<br />
supply private label products to major grocery<br />
retailers and global foodservice operators.<br />
Facilities<br />
We operate 26 facilities and employ<br />
3,950 people.<br />
Countries of operations<br />
We have manufacturing operations in nine<br />
countries: Belgium, Czech Republic, France,<br />
Italy, Spain, the USA, Canada, mainland China<br />
and Hong Kong and South Africa.<br />
Sales performance<br />
Revenue derived from the International<br />
business segment represented £287.2 million<br />
or 17% of Group revenue, equating to a<br />
1% decrease on statutory revenues on the<br />
previous year and a 5.1% increase in likefor-like<br />
revenues. This increase was primarily<br />
driven by <strong>our</strong> North American and Asian<br />
businesses as these regions continued to<br />
build strong customer relationships. Our Italian<br />
pizza business also achieved strong sales<br />
growth driven by business wins.<br />
Adjusted EBITDA performance<br />
Adjusted EBITDA for the International segment<br />
was £10.9 million, compared with £7.1 million<br />
in 2011, an increase of £3.8 million or 53.5%.<br />
Adjusted EBITDA margin increased by 140<br />
basis points to 3.8% in 2012. Our International<br />
segment continues to benefit from investment<br />
in relationships and growing sales. Our Italian<br />
business continues to win new contracts<br />
and <strong>our</strong> Asian business is benefiting from a<br />
continuing capital investment programme<br />
that has enabled it to grow capacity to meet<br />
customer demand and deliver efficiencies.<br />
Key innovations and achievements in 2012<br />
Our focus on innovation in 2012 continued in<br />
<strong>our</strong> International businesses as we worked with<br />
<strong>our</strong> key retailers and foodservice operators to<br />
support their extensive growth plans.<br />
We launched a range of breakfast products<br />
with a key foodservice customer in Asia as<br />
well as a number of bakery and desserts lines<br />
in North America.<br />
Our continuous commitment to customer<br />
service was recognised through two supplier<br />
awards in the USA and China.<br />
11<br />
12<br />
5%<br />
1 Adjusted EBITDA: excludes restructuring costs, management charges to the Group’s parent company,<br />
asset impairments and those additional charges or credits that are one-off in nature and significance.<br />
2 Like-for-like sales: exclude the impact of acquisitions, disposals, closures, foreign exchange translation,<br />
but include the Group’s share of revenue generated by associates.<br />
page 25 VIEW THE FULL REPORT AT ANNUALREPORT12.BAKKAVOR.COM
BAKKAVOR ANNUAL REPORT AND ACCOUNTS 2012<br />
financial review<br />
WE DELIVERED A STRONG PERFORMANCE IN 2012 WITH<br />
LIKE-FOR-LIKE SALES GROWTH OF 5.4%.<br />
This was achieved through new business wins as<br />
well as supporting <strong>our</strong> customers’ pricing initiatives<br />
and promotional campaigns.<br />
Peter Gates<br />
Chief Financial Officer<br />
financial highlights<br />
5.4%<br />
like-for-like<br />
sales growth<br />
GROUP REVENUES<br />
We continued to show good sales growth for the year despite tough<br />
trading conditions, with like-for-like sales growth of 5.4%. This increase<br />
was almost entirely volume driven through successful participation<br />
in promotional activities, new product launches and new business<br />
development. Our pricing, which excludes the one-off costs of<br />
promotion activity, remained relatively flat as raw material inflation<br />
stabilised during Fiscal Year 2012 and price increases negotiated to<br />
offset the effect of the inflation during 2011 remained in place. For<br />
further analysis of the Group’s revenue performance refer to <strong>our</strong><br />
Business Review on page 23.<br />
GROSS PROFIT<br />
ADJUSTED EBITDA MARGIN (%)<br />
6.4<br />
6.8%<br />
0.4%<br />
11 12<br />
FREE CASH FLOW (£m)<br />
20.6<br />
£23.5m<br />
14%<br />
11 12<br />
The gross profit margin for 2012 was 26.9%, representing a year-on-year<br />
increase of 90 basis points. Through a combination of successful new<br />
product developments and effective promotional campaigns the Group<br />
has seen its gross margin return to levels experienced prior to 2011, a year<br />
which was materially affected by unprecedented raw material inflation.<br />
DISTRIBUTION AND OTHER ADMINISTRATIVE COSTS<br />
Distribution and other administrative costs increased by £15.2 million,<br />
or 4.3%, as further costs were incurred to support <strong>our</strong> investments in<br />
innovation and technical excellence to strengthen <strong>our</strong> leading competitive<br />
position. Furthermore, additional personnel costs were incurred to deliver<br />
like-for-like sales growth; engineering costs increased to support the final<br />
stages of capital investments; and utility costs also increased as a result<br />
of inflation.<br />
ADJUSTED EBITDA<br />
The adjusted EBITDA for the Group was £115.1 million, compared with<br />
£107.7 million in 2011, an increase of £7.4 million or 6.9%. Adjusted EBITDA<br />
margin increased by 40 basis points from 6.4% in 2011 to 6.8% in 2012.<br />
PAGE 26 VIEW THE FULL REPORT AT ANNUALREPORT12.BAKKAVOR.COM
BAKKAVOR ANNUAL REPORT AND ACCOUNTS 2012<br />
financial review<br />
RECONCILIATION TO ADJUSTED EBITDA 1 FY 2012<br />
£m<br />
FY 2011<br />
£m<br />
Operating profit/(loss) 56.8 (2.8)<br />
Add back:<br />
Depreciation 39.5 39.8<br />
Amortisation 8.7 9.2<br />
Exceptional items (net) 4.4 (7.4)<br />
<strong>Bakkavor</strong> Group ehf. management charge 0.5 1.2<br />
Impairment of assets 1.0 63.7<br />
Loss on disposal of property, plant and equipment 1.3 0.3<br />
(Profit)/loss on disposal of subsidiaries & associates (0.4) 2.6<br />
Share of results of associates after tax (0.9) (1.1)<br />
Adjusted EBITDA from discontinued operations 4.2 2.2<br />
Adjusted EBITDA 1 115.1 107.7<br />
Exceptional items are those that, in management’s judgement, should be<br />
disclosed by virtue of their nature or amount. Exceptional items comprised:<br />
FY 2012<br />
£m<br />
FY 2011<br />
£m<br />
Restructuring costs 2.8 7.7<br />
Temporary site closure 1.6 –<br />
Defined benefit pension scheme credit – (12.0)<br />
Legal claim settlement – (3.1)<br />
Total 4.4 (7.4)<br />
EXCEPTIONAL ITEMS<br />
For further analysis of the Group’s adjusted EBITDA performance refer<br />
to <strong>our</strong> Business Review on page 24 and 25.<br />
EXCEPTIONAL ITEMS<br />
During the year, the Group incurred certain one-off costs as part of a<br />
restructuring programme to improve long-term operating performance,<br />
particularly in Europe. The costs incurred to implement this restructuring<br />
amounted to £2.8 million in the year, the majority of which comprised<br />
redundancy costs.<br />
The exceptional costs relating to the temporary closure at one of<br />
<strong>our</strong> manufacturing sites following a malicious and isolated act of<br />
contamination in the year amounted to £1.6 million. This charge related<br />
primarily to the costs associated with the disposal of products, extending<br />
<strong>our</strong> installation of CCTV cameras, and the increased costs of working,<br />
which included additional lab<strong>our</strong> costs and further security measures.<br />
The exceptional non-cash credit of £12.0 million in 2011 related to the<br />
fall in the present value of the defined benefit pension scheme liabilities<br />
following the closure of the Group’s scheme to future accrual. Finally,<br />
the Group received £3.1 million in 2011 following the conclusion of a<br />
legal settlement in respect of a trading dispute.<br />
IMPAIRMENT<br />
Each year the Group is required to assess the appropriateness of its<br />
goodwill carrying value by comparing the asset values with future cash<br />
flows expected to be generated from those assets. No impairment of<br />
goodwill or intangible assets has been recognised in 2012, although<br />
an impairment of £1.0m was recognised in relation to tangible fixed<br />
assets which were made redundant. In 2011, an impairment charge of<br />
£63.7 million was recognised reflecting a write-down in the carrying<br />
values of goodwill, intangible assets and tangible fixed assets due to the<br />
combination of adverse trading conditions and management’s decision<br />
to exit certain low-margin businesses.<br />
OPERATING PROFIT<br />
The Company generated an operating profit of £56.8 million (2011: loss of<br />
£2.8 million). In 2011, an impairment charge of £63.7 million was recognised<br />
but the effect of this was partially offset by a £12.0 million exceptional credit<br />
in 2011 relating to the benefit arising from the closure to future accrual<br />
of the defined benefit pension scheme. After stripping out the effect of<br />
these items, the Group’s operating result improved by £7.9 million in 2012,<br />
reflecting the improved sales volumes and factory performance efficiencies.<br />
NET DEBT AND INTEREST<br />
The Group’s net debt totalled £563.9 million (2011: £591.4 million),<br />
representing a reduction of £27.5 million. In line with the term loan<br />
amortisation profile, £4.9 million was repaid. An additional £19.7 million<br />
was repaid from the funds generated from the equity issue in the Group’s<br />
parent company, <strong>Bakkavor</strong> Group Limited, plus proceeds from the sale of<br />
two vacant properties.<br />
Net finance costs have reduced from £64.9 million in 2011 to £61.1 million<br />
in 2012. This decrease was due to a reduction in average indebtedness<br />
over the period coupled with certain long-term fixed rate interest swaps<br />
maturing in the year. This decrease was partially offset by refinancing<br />
costs related to the corporate re-organisation earlier in the year.<br />
TAX<br />
The Group recorded a tax charge of £2.8 million (2011: £2.5 million credit)<br />
as the Group became profitable in 2012. In addition, a provision was<br />
recognised this year to cover certain tax charges that may now materialise<br />
in relation to prior years.<br />
1 Excludes restructuring costs, asset impairments and those additional charges or credits that are<br />
one-off in nature and significance.<br />
PAGE 27 VIEW THE FULL REPORT AT ANNUALREPORT12.BAKKAVOR.COM
BAKKAVOR ANNUAL REPORT AND ACCOUNTS 2012<br />
financial review<br />
CASH FLOW<br />
Free cash generation from operations<br />
Free cash generation before financing activities<br />
£ million 2012 2011<br />
Adjusted EBITDA 115.1 107.7<br />
Working capital (2.6) 4.9<br />
Pensions (cash and non-cash) (4.6) (4.4)<br />
Interest paid (54.3) (44.3)<br />
Tax paid (1.0) (3.4)<br />
Capital expenditure (net) (29.1) (39.9)<br />
Free cash generated from operating activities 23.5 20.6<br />
£ million 2012 2011<br />
Free cash generated from operating activities 23.5 20.6<br />
Cash impact of exceptional items (5.2) (3.3)<br />
Payment of deferred consideration (0.2) (4.6)<br />
Acquisition of subsidiary net of cash acquired – (0.2)<br />
Disposal of subsidiary net of cash disposed of 1.4 2.6<br />
Refinancing costs (5.5) (19.1)<br />
<strong>Bakkavor</strong> Group ehf cash payments (0.5) (1.2)<br />
Cash flow before financing activities 13.5 (5.2)<br />
DISCONTINUED OPERATIONS<br />
The Group has reached formal agreement with Agrial, Société<br />
Cooperative Agricole et Agro-alimentaire, a leading European food<br />
co-operative, for the sale of its French and Spanish produce businesses<br />
comprising Cinquième Saison Saint-Pol SAS, Cinquième Saison Mâcon<br />
SAS, <strong>Bakkavor</strong> France SAS, Crudi SAS and Sogesol SA for 33 million<br />
Euros debt-free cash-free.<br />
Completion of the transaction is subject to competition authority<br />
clearance, which is expected by the end of the first half of 2013. These<br />
operations have been accounted for as discontinued operations and are<br />
therefore shown separately in the Group’s income statement.<br />
PENSIONS<br />
At 29 December 2012, the defined benefit surplus was £10.0 million<br />
(2011: £9.3 million surplus). There has been little movement in this<br />
surplus as the increase in the fair value of scheme assets has been<br />
broadly offset by a broadly equivalent increase to scheme liabilities.<br />
The defined benefit pension scheme is subject to a triennial valuation<br />
as at March 2013.<br />
FREE CASH GENERATED FROM OPERATING ACTIVITIES<br />
The increase in free cash generation in the year is attributable to an<br />
improved profit performance and a decrease in capital expenditure<br />
(referred to below). Offsetting this was an increase in interest payments<br />
arising from the payment profile attached to the Senior Secured Notes.<br />
These notes were issued in February 2011 with interest payable semiannually<br />
in arrears in February and August. As a result, only one interest<br />
payment was required in the first year.<br />
CAPITAL EXPENDITURE<br />
Our 2011 capital expenditure programme focused on capacity<br />
enhancements across <strong>our</strong> portfolio of sites to support <strong>our</strong> growth<br />
objectives and strengthen <strong>our</strong> market-leading positions. Whilst we<br />
have continued to invest in a broad range of projects in 2012, <strong>our</strong> focus<br />
has been to ensure the successful integration of these prior year<br />
investments. Nonetheless, we expect capital spend to increase in 2013.<br />
In the event of having to respond to an adverse economic environment<br />
and manage the broader cash requirements of the business as a whole,<br />
we continue to retain flexibility in <strong>our</strong> discretionary capital spend.<br />
OTHER GAINS & LOSSES<br />
Other gains of £8.4 million (2011: gain of £6.0 million) included a<br />
£6.4 million credit arising on the change in fair value of interest rate<br />
swaps. During the year, £250 million of interest rate swaps matured<br />
leaving £50 million outstanding as at 29 December 2012, which<br />
matures in September 2017.<br />
Peter Gates<br />
Chief Financial Officer<br />
PAGE 28 VIEW THE FULL REPORT AT ANNUALREPORT12.BAKKAVOR.COM
BAKKAVOR ANNUAL REPORT AND ACCOUNTS 2012<br />
market trends<br />
OUR ABILITY TO TRANSLATE MARKET TRENDS INTO<br />
COMMERCIALLY-SUCCESSFUL PRODUCTS IS CRITICAL TO<br />
OUR LONG-TERM GROWTH, PARTICULARLY IN TODAY’S<br />
COMPETITIVE BUSINESS ENVIRONMENT.<br />
F<strong>our</strong> key macro trends are influencing consumer<br />
behavi<strong>our</strong> which, in turn, is shaping retail investment<br />
decisions. Ultimately these trends impact the foods<br />
which we develop and make at <strong>Bakkavor</strong>.<br />
Here we outline some of the key reasons behind <strong>our</strong><br />
focused investment in the fresh prepared foods market<br />
and summarise the macro trends which are influencing<br />
consumer trends, shaping retail developments and,<br />
ultimately, the foods that we make.<br />
4 key macro trends<br />
Health concerns, Societal & technological change,<br />
Financial insecurity and Environmental issues.<br />
6 key consumer trends<br />
Well-being, Time pressure, Indulgence, Ethical consumption,<br />
Expanding repertoires and Smart shopping.<br />
6 key retail trends<br />
Targeted health, Convenient shopping, Ethnic focus, Ethics &<br />
environment, Classic re-invention and Value & promotions.<br />
bakkavor action<br />
At <strong>Bakkavor</strong> we use <strong>our</strong> market insight and bespoke research to<br />
develop and launch commercially-successful products which meet<br />
the needs of today’s consumer and the growth aspirations of<br />
<strong>our</strong> retail and foodservice partners.<br />
why fresh prepared foods<br />
1<br />
2<br />
3<br />
4<br />
DYNAMIC & RESILIENT GROWTH<br />
The fresh prepared foods sector is one of the most dynamic and<br />
diverse in the food industry. It continues to grow faster than the<br />
overall food market by meeting consumer demand for high-quality<br />
food with fresh ingredients, alongside choice, convenience and<br />
value for money.<br />
TIME-SAVING & COST-SAVING LIFESTYLE CHOICE<br />
People are interested in new tastes and quality ingredients but<br />
do not always have the time, skill or budget to cook from scratch<br />
every day. Fresh prepared foods bridge this gap, increasingly<br />
becoming a lifestyle choice, due to their fresh appeal, ease of<br />
cooking (or preparing) and availability across a range of price tiers.<br />
STRATEGIC IMPORTANCE FOR PRIVATE LABEL GROWTH<br />
Fresh prepared foods are sold predominantly under retailer<br />
private labels and are an integral part of a retailer’s overall brand<br />
strategy. They enable retailers to differentiate themselves from<br />
their competitors, which is crucial in today’s challenging retail<br />
environment. Private label continues to gain share in developed<br />
countries around the world.<br />
BUILT ON LONG-LASTING RELATIONSHIPS<br />
Making fresh prepared foods under private labels brings with it<br />
the need for deep trust and understanding between suppliers<br />
and their customers. As products are made with fresh natural<br />
ingredients, suppliers must meet demanding customer<br />
specifications, involving day-to-day communication and excellent<br />
relationships. This is a barrier to entry rather than a risk.<br />
5<br />
BENEFIT OF SPEED TO MARKET<br />
Compared to manufacturer-branded products, fresh prepared foods<br />
give retailers the opportunity to launch differentiated private label<br />
ranges relatively efficiently and cost-effectively, allowing them to<br />
benefit quickly from the demand for high-quality, convenient foods<br />
with fresh ingredients.<br />
PAGE 29 VIEW THE FULL REPORT AT ANNUALREPORT12.BAKKAVOR.COM
BAKKAVOR ANNUAL REPORT AND ACCOUNTS 2012<br />
macro trends<br />
1. health concerns<br />
500m<br />
adults are obese worldwide.<br />
10% of men and 14% of women -<br />
nearly double the rate of<br />
obesity in 1980. 4<br />
169m<br />
of <strong>our</strong> leafy and meal<br />
salads were sold in<br />
the uk in 2012.<br />
macro trend<br />
HEALTH CONCERNS<br />
People of all ages are increasingly concerned<br />
about poor health. This is influenced by the<br />
continued rise in global obesity, an ageing<br />
population and sedentary lifestyles, particularly<br />
in the western world. Stress-related sickness<br />
as well as food allergies and intolerances are<br />
also on the rise.<br />
Against this backdrop health awareness<br />
is improving due to the vast amount of<br />
information available through the internet<br />
and media and government-run campaigns<br />
which actively communicate the benefits<br />
of healthier lifestyles. Mobile technology<br />
also allows people to monitor and share<br />
health-related information more easily.<br />
6 in10 increasing<br />
stress<br />
6 in 10 workers in major global economies<br />
are experiencing increased workplace<br />
stress. China has the highest rate of<br />
workplace stress. 5 targeted health<br />
campaigns<br />
In January 2013 the ‘Be Food Smart’<br />
campaign was launched by the<br />
UK government.<br />
consumer trends<br />
WELL-BEING<br />
People are becoming more interested in<br />
pursuing a healthier lifestyle whether through<br />
increased physical exercise, healthy eating<br />
regimes, careful selection (or avoidance)<br />
of specific food ingredients or a better<br />
work-life balance. With information more<br />
easily accessible on product packaging and<br />
online, people are keen to improve their<br />
individual health and well-being needs.<br />
retail trends<br />
TARGETED HEALTH<br />
making<br />
informed choices<br />
“We’re more informed than we’ve ever<br />
been.There’s the 5 A DAY message.” 6<br />
Grocery retailers are developing targeted health<br />
ranges within their portfolio of private label<br />
brands. These ranges cater for different dietary<br />
requirements and preferences: for example,<br />
low-calorie recipes, ‘Free from’ products (e.g.<br />
gluten-free) or meals that combine unique<br />
natural ingredients. Retailers are also providing<br />
clearer information, particularly on their private<br />
label ranges, to help consumers make informed<br />
purchasing decisions.<br />
what does this mean<br />
for bakkavor<br />
Throughout 2012 we worked with <strong>our</strong><br />
customers to extend existing healthy ranges,<br />
introduce new recipes and communicate<br />
nutritional advice on-pack. Developments<br />
included naturally balanced ready meal ranges<br />
and healthier soups and pizzas.<br />
bakkavor action: 2012<br />
NATURALLY LIGHT<br />
We launched a PizzaExpress Light range of<br />
pizzas into the retail sector. Giardiniera Light<br />
and Pollo Piccante Light contain fewer than<br />
500 calories each due to a thinner, crispier<br />
dough, low calorie mozzarella and carefully<br />
selected ingredients.<br />
4 The Lancet<br />
5 The Regus Group. www.gostress.com/stress-facts/<br />
6 IGD Winning Shoppers’ Trust<br />
PAGE 30 VIEW THE FULL REPORT AT ANNUALREPORT12.BAKKAVOR.COM
BAKKAVOR ANNUAL REPORT AND ACCOUNTS 2012<br />
macro trends<br />
2. societal and technological change<br />
72%<br />
of shoppers who own a<br />
smartphone or tablet computer<br />
would like personalised<br />
e-promotions. 7<br />
STRONG GROWTH PREDICTED FOR CONVENIENCE STORES<br />
VALUE OF UK CONVENIENCE MARKET (£bn), 2012–2017F<br />
33.9 35.6 37.4<br />
39.4<br />
41.5<br />
43.6<br />
28.5%<br />
growth 2012-2017<br />
2012 2013f 2014f 2015f 2016f 2017f<br />
S<strong>our</strong>ce: IGD<br />
macro trends<br />
SMALLER HOUSEHOLDS STILL GROWING<br />
The breakdown of traditional family structures,<br />
changing lifestyles, and growth in the over 65s<br />
and 20-30 year olds continue to influence the<br />
rise in smaller household sizes.<br />
PERSONALISED SERVICE 24/7<br />
Increased wi-fi accessibility and ownership<br />
of mobile devices allow people to use online<br />
services and access information 24/7. The<br />
popularity of social media has sparked an<br />
expectation for people to receive information<br />
specific to their needs.<br />
consumer trends<br />
TIME PRESSURE<br />
Time-saving shortcuts, such as shopping<br />
for products online and ‘on the move’, are<br />
becoming the norm. People (particularly in<br />
smaller households) continue to look to save<br />
time preparing and cooking food.<br />
EXPANDING REPERTOIRES<br />
Diverse communities, affordable overseas<br />
travel and increased t<strong>our</strong>ism expose people to<br />
new cultures and tastes and gradually increase<br />
people’s willingness to try new things. 43% of<br />
global consumers agree with the statement,<br />
“my taste in food has changed as a result of<br />
exposure to foods from other cultures”. 8<br />
retail trends<br />
CONVENIENT SHOPPING<br />
Grocery retailers are focusing investment in<br />
smaller, town-centre convenience stores and<br />
online shopping (with options such as home<br />
delivery or click and collect). Through store<br />
loyalty cards and the increase in online and<br />
mobile shopping, retailers are improving their<br />
shopper knowledge and attracting current and<br />
potential customers with tailored offers.<br />
ETHNIC FOCUS<br />
Grocery retailers have responded to the rise in<br />
ethnic diversity and demand for new tastes by<br />
dedicating more shelf space to a wider range of<br />
different cuisines.<br />
online grocery<br />
shopping<br />
£11.1bn<br />
The UK’s internet grocery market will be<br />
worth £11.1bn by 2017, almost double its<br />
current value of £5.6bn.This represents a<br />
CAGR of 14.6% between 2012 and 2017. 9<br />
what does this mean<br />
for bakkavor<br />
Sales of <strong>Bakkavor</strong> products should benefit<br />
directly from the increase in convenience<br />
stores and the rise in single-person<br />
households. An expectation of 24/7 service<br />
and increased retailer investment in online<br />
and delivery services means that fresh<br />
prepared foods are bought with increasing<br />
confidence around the clock.<br />
bakkavor action: 2012<br />
SOCIAL COMMUNICATION<br />
We promote the health benefits of watercress<br />
on Facebook and Twitter. 13 million packs of<br />
<strong>our</strong> watercress were sold in 2012.<br />
www.facebook.com/watercress<br />
JUST FOR ONE<br />
We launched a range of small 8” premium<br />
pizzas and microwaveable pizza slices.<br />
NEW TASTE SENSATIONS<br />
We launched modern Spanish ready meals and<br />
breads, a restaurant-inspired Indian range and<br />
Mexican meals and side dishes. We also ‘spiced<br />
up’ dips and salads with fresh ingredients such<br />
as jalapeno peppers and wasabi.<br />
7 IGD: Winning Shoppers’ Trust<br />
8 Datamonitor: Experimentation: Consumer & Innovation Trends<br />
9 IGD October 2012<br />
PAGE 31 VIEW THE FULL REPORT AT ANNUALREPORT12.BAKKAVOR.COM
BAKKAVOR ANNUAL REPORT AND ACCOUNTS 2012<br />
macro trends<br />
3. financial insecurity<br />
6 in10<br />
<strong>our</strong> best-selling<br />
uk family ready meal<br />
2012: chicken tikka<br />
massala<br />
shoppers claim to be buying more<br />
on promotion since the start of<br />
2012 and half are looking out<br />
for promotions before<br />
going shopping. 10<br />
macro trend<br />
GLOBAL ISSUES – LOCAL WORRIES<br />
Macroeconomic issues are impacting the<br />
spending habits and behavi<strong>our</strong> of consumers.<br />
High national debt, continued uncertainty<br />
in the euro zone, GDP slow-downs, rising<br />
unemployment and higher living costs are<br />
having a tangible impact on everyday lives.<br />
15 million British consumers worry about their<br />
finances every single day 11 .<br />
consumer trends<br />
SMART SHOPPING<br />
People have adopted a ‘recessionary mindset’<br />
and are becoming ‘smart shoppers’, comparing<br />
prices, responding more readily to promotional<br />
offers and buying more selectively.<br />
ENJOYMENT & INDULGENCE<br />
Despite the recession, people still feel the<br />
need for a reward and look for affordable ways<br />
to treat themselves, family and friends, as<br />
evidenced by the rise in in-home dining.<br />
Stress and financial uncertainty often<br />
cause people to look back to the past for<br />
reassurance and comfort. As a result old<br />
‘classics’ are being revived. Complementing<br />
this trend is a heightened demand for local<br />
and national products, symbolising values,<br />
beliefs and identities.<br />
retail trends<br />
VALUE & PROMOTIONS<br />
In today’s highly competitive and recessionary<br />
environment, private label developments<br />
remain of strategic importance to retailers.<br />
Offering private label ranges at different price<br />
points (from budget to premium) enables<br />
retailers to strengthen their share and provide<br />
customer choice.<br />
Retailers are also employing selective private<br />
label promotions such as ‘Meal deal’ and ‘Dine<br />
In’ offers (a pick and mix selection for a fixed<br />
price) to help consumers save money and<br />
benefit from the trend for in-home dining.<br />
CLASSIC RE-INVENTION<br />
valuing private<br />
label<br />
“I’m going to budget more with food<br />
prices going up. I’ll switch to more<br />
supermarket brands to save money.” 12<br />
To meet demand for old fav<strong>our</strong>ites, retailers<br />
are promoting classic dishes using local or<br />
regional ingredients. In the UK, this trend was<br />
particularly prominent in 2012 owing to events<br />
such as the Royal Jubilee.<br />
Grocery retailers are re-introducing traditional<br />
fresh food counters in store, providing<br />
consumers with a personal service, the ability<br />
to choose specific products and quantities and<br />
to ask advice from experts.<br />
what does this mean<br />
for bakkavor<br />
By working with retailers to focus on private<br />
label products (from premium to value and prepackaged<br />
to over-the-counter ranges) <strong>Bakkavor</strong><br />
is able to develop products quickly and at<br />
different price points to meet consumer needs.<br />
bakkavor action: 2012<br />
MEAL DEALS<br />
We make starters, main c<strong>our</strong>ses, side dishes<br />
and desserts. Our products featured regularly<br />
in meal deal promotions.<br />
CLASSIC FAVOURITES<br />
We worked with <strong>our</strong> customers to introduce a<br />
diverse range of high quality products for their<br />
in-store counters including Mediterranean<br />
deli products, patisserie cakes, pizzas and<br />
speciality breads.<br />
10 IGD Shoppervista, June 2012<br />
11 Russell Investments<br />
12 IGD: Winning Shoppers’ Trust Oct 2012<br />
PAGE 32 VIEW THE FULL REPORT AT ANNUALREPORT12.BAKKAVOR.COM
BAKKAVOR ANNUAL REPORT AND ACCOUNTS 2012<br />
macro trends<br />
4. environmental issues<br />
80%<br />
of <strong>our</strong> new ready meal<br />
tray made from recycled<br />
materials<br />
<strong>our</strong> 2013<br />
target is 90%<br />
macro trend<br />
GLOBAL SOCIAL AND<br />
ENVIRONMENTAL CONCERNS<br />
More accessible information, greater media<br />
coverage and the localised impact of extreme<br />
weather conditions and natural disasters<br />
have raised the importance of taking personal<br />
action to protect <strong>our</strong> environment.<br />
ETHICAL CONSUMPTION<br />
More people are assessing the way they lead<br />
their day-to-day lives from an environmental<br />
and social viewpoint. Taking personal<br />
responsibility is becoming increasingly<br />
important as people try to recycle more, save<br />
energy, reduce their carbon footprint and buy<br />
more recyclable and ethical products. This<br />
trend has been heightened further by the<br />
current economic climate with people realising<br />
the financial cost of wasting res<strong>our</strong>ces such as<br />
food and energy.<br />
retail trends<br />
ETHICS & ENVIRONMENT<br />
The ability for grocery retailers to demonstrate<br />
to the public that ethical and environmental<br />
issues are being managed effectively has<br />
become increasingly important, with most<br />
major retailers sharing formal commitments<br />
to reduce their impact in areas such as waste,<br />
energy and their carbon footprint. Many<br />
of these commitments are communicated<br />
overtly to their customers in order to enhance<br />
reputation and increase loyalty.<br />
Initiatives include building environmentallyfriendly<br />
stores, increasing recyclable product<br />
packaging, and s<strong>our</strong>cing more locally-made or<br />
fair-trade products. A key retail development<br />
is the integration of social and environmental<br />
initiatives into private label strategies. This<br />
necessitates commitment from their suppliers<br />
to achieve strategic sustainability goals.<br />
what does this mean<br />
for bakkavor<br />
We work closely with <strong>our</strong> customers to<br />
help them meet their social, ethical and<br />
environmental objectives for their private<br />
label strategies.<br />
consumer trends bakkavor action: 2012<br />
reducing food<br />
waste<br />
53%<br />
Half of shoppers claim to be focusing<br />
more on reducing food waste (48%) and<br />
only buying what is needed (53%) since<br />
the start of 2012. 13<br />
recyclable<br />
packaging<br />
75%<br />
Being recyclable is shoppers’ top<br />
priority for making packaging more<br />
environmentally friendly, with three<br />
quarters (75%) identifying it as<br />
particularly appealing. 14<br />
ENVIRONMENTALLY FRIENDLY<br />
In conjunction with one of <strong>our</strong> strategic<br />
packaging suppliers we have developed and<br />
launched the first ready meal oven tray that<br />
is made from 80% recycled materials and is<br />
also fully recyclable. Our target is to increase<br />
the amount of recycled material to over 90%<br />
by 2013.<br />
13 IGD:Winning Shoppers’ trust<br />
14 IGD Environmental sustainability – how to engage shoppers, June 2011<br />
PAGE 33 VIEW THE FULL REPORT AT ANNUALREPORT12.BAKKAVOR.COM
BAKKAVOR ANNUAL REPORT AND ACCOUNTS 2012<br />
<strong>our</strong> responsibilities<br />
AT BAKKAVOR WE FOCUS ON DOING THINGS<br />
THE RIGHT WAY.<br />
For us this means engaging with the people that<br />
matter, striving for continuous improvement and<br />
building a sustainable business.<br />
Ann Savage<br />
Group Technical Director<br />
Our Group Technical Director, Ann Savage, has overall responsibility<br />
for the Group’s Corporate Social Responsibility (CSR) policies and<br />
performance and reports monthly to the Management Board, on<br />
which she sits.<br />
OUR RESPONSIBILITY REPORTING IS SPLIT INTO THREE SECTIONS:<br />
managing <strong>our</strong><br />
responsibilities<br />
We describe the structure and<br />
res<strong>our</strong>ces we have in place in order<br />
to manage <strong>our</strong> priority focus areas<br />
effectively. We also share <strong>our</strong> Key<br />
Performance Indicators (KPIs) and<br />
<strong>our</strong> progress against them.<br />
• structures<br />
• reporting<br />
• performance<br />
engaging <strong>our</strong><br />
stakeholders<br />
We demonstrate how we<br />
engage effectively with <strong>our</strong> key<br />
stakeholders and share some<br />
of <strong>our</strong> actions in this area.<br />
• identified<br />
stakeholders<br />
• effective<br />
engagement<br />
running <strong>our</strong><br />
business<br />
sustainably<br />
We outline some of the key CSR<br />
initiatives implemented in 2012<br />
and actions identified for 2013,<br />
underpinning <strong>our</strong> commitment<br />
to continuous improvement and<br />
running <strong>our</strong> business sustainably.<br />
• key initiatives<br />
• future focus<br />
PAGE 34 VIEW THE FULL REPORT AT ANNUALREPORT12.BAKKAVOR.COM
BAKKAVOR ANNUAL REPORT AND ACCOUNTS 2012<br />
<strong>our</strong> responsibilities<br />
1. managing <strong>our</strong> responsibilities<br />
IN THIS SECTION WE DESCRIBE THE STRUCTURE AND<br />
RESOURCES WE HAVE IN PLACE IN ORDER TO MANAGE OUR<br />
PRIORITY FOCUS AREAS EFFECTIVELY.<br />
We also share <strong>our</strong> Key Performance Indicators (KPIs)<br />
and <strong>our</strong> progress against them.<br />
1. managing <strong>our</strong> responsibilities<br />
food safety & csr initiatives<br />
PRIORITY FOCUS AREAS<br />
• Food safety<br />
• Health & Safety (H&S)<br />
• Environment<br />
employee initiatives<br />
PRIORITY FOCUS AREAS<br />
• Employee retention<br />
• Employee training and development<br />
• Other employee areas: diversity,<br />
temporary lab<strong>our</strong><br />
RESPONSIBILITY<br />
Group Technical Director,<br />
Central and business<br />
Technical teams<br />
RESPONSIBILITY<br />
Group and business<br />
HR teams<br />
OUR APPROACH<br />
Our overall CSR approach ensures compliance with legislation relevant<br />
to <strong>our</strong> global operations. Where appropriate for <strong>our</strong> business, we look for<br />
opportunities within <strong>our</strong> CSR framework to create competitive advantage.<br />
Our established management systems help us to concentrate on<br />
<strong>our</strong> identified priority focus areas. Within these, we concentrate <strong>our</strong><br />
actions where we have direct control and where we can make the most<br />
positive impact.<br />
We take a continuous improvement approach to the development and<br />
sharing of good practice across the business through specialist project<br />
teams, conferences, workshops and <strong>our</strong> Group Employee Forum (GEF).<br />
The systems we have in place are supported by <strong>our</strong> values to ensure<br />
we do things the right way, and we recognise and reward <strong>our</strong> people<br />
for their action and engagement in CSR initiatives at <strong>our</strong> annual Group<br />
Responsibility Awards. The awards focus on seven categories:<br />
• Good Neighb<strong>our</strong><br />
• Environment<br />
• Health & Safety Innovation<br />
community initiatives<br />
PRIORITY FOCUS AREAS<br />
• Community understanding<br />
and support<br />
RESPONSIBILITY<br />
<strong>Bakkavor</strong> businesses<br />
• Health & Safety Culture<br />
• Health & Safety Star<br />
• Site Employee Forum (SEF) of the Year<br />
• GEF Representative of the Year.<br />
PAGE 35 VIEW THE FULL REPORT AT ANNUALREPORT12.BAKKAVOR.COM
BAKKAVOR ANNUAL REPORT AND ACCOUNTS 2012<br />
<strong>our</strong> responsibilities<br />
1. managing <strong>our</strong> responsibilities<br />
ann savage<br />
group technical director sits on management board<br />
MAJOR ACCIDENTS PER<br />
100,000 EMPLOYEES<br />
HSE Food and<br />
Drink industry<br />
average<br />
26%<br />
TOTAL ACCIDENTS PER<br />
100,000 EMPLOYEES<br />
year-on-year<br />
08 09 10 11 12 08 09 10 11 12<br />
10%<br />
year-on-year<br />
central technical team<br />
food safety, health & safety, environment, food science &<br />
microbiology, technical innovation and agronomy expertise<br />
monitors and supports<br />
adherence to standards<br />
co-ordinates and drives<br />
continuous improvement<br />
food safety, health and safety<br />
& environment initiatives<br />
Our Group Technical Director, Ann Savage, is supported by the Central<br />
Technical team who provide specialist expertise in the key areas of<br />
food safety, food science and microbiology, health and safety, technical<br />
innovation and agronomy. The team’s role is to embed and monitor<br />
sound CSR practices and standards across the business.<br />
FOOD SAFETY<br />
Millions of people eat <strong>our</strong> products every day. We have a duty to make<br />
food that is safe for people to eat and, as we are entrusted to make<br />
products under <strong>our</strong> customers’ private labels, we have a duty to respect<br />
and protect the integrity of these brands. We have policies and standards<br />
in place which recognise legal and customer requirements.<br />
Measures and performance<br />
We use quality management systems and tested procedures to guide<br />
<strong>our</strong> businesses on the high standards we expect. We utilise several<br />
verification processes including scientific testing in <strong>our</strong> own laboratories,<br />
announced and unannounced audits, and management reviews to<br />
ensure that we do what we say we do. Information from <strong>our</strong> verification<br />
processes is fed back into <strong>our</strong> quality management systems and we<br />
take corrective and preventative action when required.<br />
The <strong>Bakkavor</strong> Management Board is accountable for the effective<br />
implementation of <strong>our</strong> Food Safety Policy; and the Group’s food safety<br />
performance is presented at each Management Board meeting.<br />
HEALTH AND SAFETY (H&S)<br />
Our responsibility is to take every reasonable step to secure and protect<br />
the health and safety of <strong>our</strong> employees and those people who are<br />
working on <strong>our</strong> premises.<br />
We have f<strong>our</strong> health and safety measures as required by law and which<br />
we believe are the most useful to report in <strong>our</strong> businesses: major<br />
accidents, reportable injuries, total accidents and near misses.<br />
Measures and performance<br />
One of the key H&S measures is Major Accidents per 100,000<br />
employees and in 2012 <strong>our</strong> performance improved by 26% year on year.<br />
Historically we have performed significantly better than the average for<br />
the food and drink industry and we will continue to track <strong>our</strong> progress<br />
against this third-party measure. Our total number of accidents also fell<br />
by 10% in 2012 compared to the previous year.<br />
ENVIRONMENT<br />
We are committed to complying with relevant legislation and managing<br />
the direct impacts of <strong>our</strong> businesses on the environment. Our<br />
Environmental Policy focuses on business improvement initiatives in five<br />
key areas over which we have immediate control: Energy, Waste, Water,<br />
Packaging and Transport.<br />
Measures and performance<br />
In the UK, we measure the amount of total waste, in percentage<br />
and absolute terms, which we divert from landfill. We achieved a<br />
significant step change in improvement when we first started to use this<br />
performance measure in 2009 through a variety of initiatives such as<br />
waste segregation and anaerobic digestion of food waste. In 2012, as in<br />
the previous year, we diverted over 98% of <strong>our</strong> waste away from landfill.<br />
PAGE 36 VIEW THE FULL REPORT AT ANNUALREPORT12.BAKKAVOR.COM
BAKKAVOR ANNUAL REPORT AND ACCOUNTS 2012<br />
<strong>our</strong> responsibilities<br />
1. managing <strong>our</strong> responsibilities<br />
group head of hr<br />
EMPLOYEE RETENTION<br />
Managers: target 90%<br />
Site-graded employees: target 75%<br />
GROUP-WIDE HR FUNCTION<br />
GRADUATE & APPRENTICE RECRUITMENT,<br />
GROUP HR SYSTEMS, GROUP BENEFITS,<br />
GROUP TRAINING, INDUSTRY LIAISON<br />
AND ENGAGEMENT<br />
EMPLOYMENT LAW REVIEW<br />
COMMITTEE & UPDATE MEETINGS<br />
HR FORUMS & CONFERENCES<br />
10 11 12<br />
managers retained 90%<br />
site-graded employees retained 92%<br />
business hr teams / site-specific hr<br />
employee initiatives<br />
The Group Head of HR, Gillian Haythornthwaite, is responsible for<br />
ensuring employee practices and initiatives are implemented across<br />
the businesses, monitoring performance and reporting monthly to the<br />
Management Board on <strong>our</strong> employee KPIs. She manages the Group HR<br />
function which covers key employee areas such as Group recruitment, HR<br />
systems, benefits and training, and supports the UK HR business teams.<br />
In addition, Gillian chairs the Employment Law Review Committee,<br />
which is responsible for updating Group policies, processes and<br />
procedures with revisions and changes in legislation. As part of this,<br />
Employment Law update meetings are held for business HR teams<br />
to discuss the impact of these changes and to ensure that they are<br />
communicated effectively.<br />
In order to develop best practice across the Group and drive HR<br />
excellence, the function organises regular HR Forums and an annual HR<br />
Conference. Every two years <strong>our</strong> businesses carry out self-assessments<br />
– HR Steps to Excellence – which set out what ‘good’ should look like<br />
in the HR function and drive an action plan at business level for <strong>our</strong> HR<br />
teams to implement.<br />
We have also recently appointed a Group HR Director, Pippa Greenslade,<br />
to ensure that the HR function is fully involved at a strategic level right<br />
across the Group.<br />
EMPLOYEE RETENTION<br />
We aim to nurture a dynamic, inclusive and values-led working<br />
environment which recognises, rewards and promotes <strong>our</strong> employees<br />
fairly to enc<strong>our</strong>age them to stay with <strong>our</strong> business.<br />
Measures and performance<br />
Employee retention is one of <strong>our</strong> key measures and we have set<br />
<strong>our</strong>selves a target of 90% for managers and 75% for <strong>our</strong> site-graded<br />
employees. For the f<strong>our</strong>th year in a row we have hit or exceeded <strong>our</strong><br />
targets, achieving retention rates of 90% for managers and 92% for<br />
site-graded employees in 2012.<br />
We also measure the number of vacancies that we fill internally and<br />
have set <strong>our</strong>selves a target of 50%. This is an important measure as it<br />
demonstrates <strong>our</strong> wish to keep and promote good people within the<br />
business who have the right values and who understand the behavi<strong>our</strong>s<br />
expected of them. This year we just fell short of <strong>our</strong> target, filling 45%<br />
of vacancies internally, largely due to <strong>our</strong> success at promoting internally<br />
the previous two years. However we will continue to focus <strong>our</strong> efforts in<br />
this area through communication and action at <strong>our</strong> Functional Forums.<br />
% vacancies filled internally<br />
target<br />
50%<br />
2010<br />
52%<br />
2011<br />
52%<br />
2012<br />
45%<br />
PAGE 37<br />
VIEW THE FULL REPORT AT ANNUALREPORT12.BAKKAVOR.COM
BAKKAVOR ANNUAL REPORT AND ACCOUNTS 2012<br />
<strong>our</strong> responsibilities<br />
1. managing <strong>our</strong> responsibilities<br />
a cohesive workforce is one where:<br />
• EVERYONE IS TREATED WITH DIGNITY AND RESPECT<br />
• THE TALENTS AND SKILLS OF DIFFERENT GROUPS ARE VALUED<br />
• PRODUCTIVITY AND CUSTOMER SERVICE IMPROVE BECAUSE<br />
THE WORKFORCE IS HAPPIER, MORE MOTIVATED AND MORE<br />
AWARE OF THE BENEFITS THAT INCLUSION CAN BRING<br />
EMPLOYEE DEVELOPMENT AND SUCCESSION (DAS)<br />
The <strong>Bakkavor</strong> DAS process is focused on developing <strong>our</strong> people to<br />
reach their full potential. It includes performance appraisals, personal<br />
development plans and DAS meetings.<br />
In 2012 we updated the DAS process, making it more relevant to <strong>our</strong><br />
business needs across the Group and ensuring that we have the systems<br />
in place to develop and support <strong>our</strong> most talented people. This process<br />
will facilitate career development across the Group more effectively.<br />
We have introduced a new Functional Talent Pipeline. This will help us<br />
measure the strength of each function today, as well as the potential<br />
to fill roles in the future. In addition, we also track, by individual, those<br />
employees who are ready for an immediate move as well as those<br />
ready for a move in one year. All this helps us to promote from within<br />
wherever possible.<br />
Measures and performance<br />
The DAS process is supported by two key measures – % of DAS<br />
discussions undertaken every six months for all employees above a<br />
certain band and % of completed annual appraisals. Our starting base<br />
in 2012 is 75% for DAS discussions and 80% for completed appraisals<br />
with a target of 100% for both.<br />
ACCELERATED MANAGEMENT SCHEME (AMS)<br />
We recognise the shortage of skilled and motivated people coming into<br />
the food industry and we have established <strong>our</strong> own programmes to help<br />
address this issue.<br />
DIVERSITY<br />
We are proud of <strong>our</strong> multi-cultural workforce and are committed to<br />
enc<strong>our</strong>aging diversity within the business. In 2012 we launched a ‘Better<br />
Together’ self-audit tool which identifies what we need to do to make<br />
<strong>our</strong> workforce even more cohesive than it already is.<br />
TEMPORARY LABOUR<br />
We have seasonal requirements for additional temporary res<strong>our</strong>ce and,<br />
in the UK, we work closely with a selected group of fully accredited and<br />
licensed temporary lab<strong>our</strong> providers, whom we audit regularly.<br />
All UK temporary workers are subject to UK legislation and in 2012<br />
we introduced and implemented a new system across <strong>our</strong> UK sites to<br />
promote sound governance in this area and to ensure compliance with<br />
the requirements of the Agency Workers’ Directive.<br />
community initiatives<br />
Reflecting the strength of <strong>our</strong> decentralised operating structure, we believe<br />
that <strong>our</strong> local <strong>Bakkavor</strong> business teams are best placed to understand<br />
the needs of their communities and support local initiatives. At a Group<br />
level we actively enc<strong>our</strong>age <strong>our</strong> employees through several established<br />
recognition award schemes and by communicating their achievements<br />
internally and externally. For more information please see page 40.<br />
Measures and performance<br />
Our two-year Accelerated Management Scheme is a fast-track<br />
programme for new graduates and current employees, giving them<br />
hands-on experience in ‘real’ jobs alongside trainers and mentors. AMS<br />
participants specialise in one of six core areas of strategic importance<br />
to the business: Manufacturing, Product Development, Technical (food<br />
safety), Produce procurement, Purchasing, and Finance. We recruited<br />
14 people onto the Scheme in 2012 and many former AMS participants<br />
have since taken on important roles within the Group.<br />
PAGE 38 VIEW THE FULL REPORT AT ANNUALREPORT12.BAKKAVOR.COM
BAKKAVOR ANNUAL REPORT AND ACCOUNTS 2012<br />
<strong>our</strong> responsibilities<br />
2. engaging with <strong>our</strong> stakeholders<br />
IN THIS SECTION WE DEMONSTRATE HOW WE ENGAGE<br />
EFFECTIVELY WITH OUR KEY STAKEHOLDERS AND SHARE<br />
SOME OF OUR ACTIONS IN THIS AREA.<br />
SPEAK-OUT! HELPLINE<br />
We are rolling out an anonymous employee whistle-blowing<br />
telephone and web hotline in 15 languages to enc<strong>our</strong>age<br />
employees to raise issues which they feel cannot be dealt<br />
with, for whatever reason, through normal management<br />
lines. The HR team also uses this channel to enc<strong>our</strong>age<br />
communication where site-specific issues have been<br />
identified. This two-way approach means action can<br />
be taken quickly and effectively. 21 sites now<br />
have the hotline in place.<br />
2. engaging with <strong>our</strong> stakeholders<br />
key identified<br />
stakeholder groups<br />
• employees<br />
• customers<br />
• local communities<br />
EMPLOYEE ENGAGEMENT: COMMUNICATION<br />
• suppliers<br />
• investors<br />
• industry<br />
One of the biggest challenges we face as a large, decentralised food<br />
company is ensuring we communicate effectively and enc<strong>our</strong>age<br />
employee engagement across, and within, <strong>our</strong> businesses.<br />
CUSTOMER ENGAGEMENT: PARTNERSHIP APPROACH<br />
We are committed to providing <strong>our</strong> customers with outstanding service,<br />
quality, innovation and value. We commission regular consumer research<br />
to ensure we stay ahead of emerging trends and we build strong<br />
relationships with customers across all levels of the business so that we<br />
can develop and make innovative and commercially-viable products.<br />
As part of <strong>our</strong> commitment to <strong>our</strong> customers we aim to not only meet<br />
but exceed their specific scorecard criteria, which cover a range of<br />
performance indicators such as commercial, technical, service, new<br />
product development and innovation, as well as how we do business.<br />
Senior management customer champions are also appointed to ensure<br />
that customer communication, relations and account planning are given<br />
a high profile within the business.<br />
In addition, we work collaboratively with customers to support specific<br />
initiatives as set out in their Corporate Responsibility agendas.<br />
in 2012 we received three awards from major<br />
customers for <strong>our</strong> partnership approach.<br />
We provide open channels of communication between employees<br />
and management through regular Site Employee Forums (SEFs) and<br />
the annual Group Employee Forum (GEF) where matters of common<br />
concern are discussed and learnings, best practice and ideas are shared.<br />
This enables positive policy development and the communication and<br />
discussion of operational changes.<br />
PAGE 39 VIEW THE FULL REPORT AT ANNUALREPORT12.BAKKAVOR.COM
BAKKAVOR ANNUAL REPORT AND ACCOUNTS 2012<br />
<strong>our</strong> responsibilities<br />
2. engaging with <strong>our</strong> stakeholders<br />
IN 2012, THE GROUP DONATED OVER £159,000 TO<br />
CHARITABLE ORGANISATIONS.<br />
The largest contributor within the Group was<br />
<strong>Bakkavor</strong> Spalding’s Staff Shop, based in Lincolnshire,<br />
which donates all proceeds to local charities and<br />
employee events.<br />
Employees at <strong>our</strong> GEF 2012, who organise site events to raise money for local charities<br />
SUPPLIER ENGAGEMENT: COLLABORATIVE WORKING<br />
We have developed <strong>our</strong> most successful relationships with suppliers<br />
who understand customer service, food safety excellence, a quest for<br />
continuous improvement and the importance of innovative forward<br />
thinking. These criteria form part of <strong>our</strong> supplier selection process and<br />
are essential in meeting <strong>our</strong> long-term needs.<br />
Over the past few years <strong>our</strong> focus has been heavily geared towards<br />
managing the impact of price volatility in commodity markets. To help<br />
mitigate the effects of price fluctuations we are, where possible,<br />
increasingly hedging <strong>our</strong> exposure via longer forward contracts on key<br />
commodity items and establishing cost-principled pricing contracts to<br />
reduce the impact of market sentiment. This involves working closely<br />
with key suppliers. Having an established relationship with them is a<br />
vital part of the contract negotiation process.<br />
Human Rights and ethical auditing<br />
<strong>Bakkavor</strong> supports the United Nations’ Universal Declaration of<br />
Human Rights and the core conventions of the International Lab<strong>our</strong><br />
Organisation. We, and <strong>our</strong> suppliers, are required to comply with all<br />
local and national laws covering working h<strong>our</strong>s and conditions, health<br />
and safety, rates of pay, terms of employment and minimum age of<br />
employment. We carry out ethical audits on <strong>our</strong> suppliers, where<br />
required, based on risk-assessment and customer specifications. We<br />
are founder members of SEDEX, which helps to risk-assess the supply<br />
chain according to the ETI Base Code.<br />
INVESTOR ENGAGEMENT: OPENNESS AND TRANSPARENCY<br />
COMMUNITY ENGAGEMENT: UNDERSTANDING AND HELPING<br />
We expect <strong>our</strong> local management teams to understand the issues<br />
facing their communities and we enc<strong>our</strong>age them to support local<br />
initiatives. At <strong>our</strong> annual Group Responsibility Awards ceremony we<br />
present <strong>our</strong> Good Neighb<strong>our</strong> Award to the site that has made the most<br />
positive impact in its local community.<br />
At the 2012 awards held in May, nine sites submitted an entry for<br />
<strong>our</strong> Good Neighb<strong>our</strong> Award and Ann Savage, GEF Chairperson, was<br />
delighted to announce Caledonian Produce as the overall winner.<br />
Caledonian successfully linked up with the local newspaper to ask<br />
people in its community which charities the business should support.<br />
This forged a positive relationship with the local paper and proved an<br />
effective way of engaging with the local community.<br />
In 2012, the Group donated over £159,000 to charitable organisations.<br />
The largest contributor within the Group was <strong>Bakkavor</strong> Spalding’s<br />
Staff Shop, based in Lincolnshire, which donates all proceeds to local<br />
charities and employee events.<br />
INDUSTRY ENGAGEMENT: BEING PART OF THE DEBATE<br />
Our Group Technical Director and Group CSR Manager actively engage<br />
with external CR-related forums and industry working groups and,<br />
between them, sit on all major customer working parties. Examples<br />
of industry engagement include: Industry Grocery Distribution (IGD)<br />
Industry Sustainability Group and Water Stewardship, IGD New and<br />
Emerging Technologies Group and IGD Technical Leadership Forum.<br />
We are committed to open, timely and unbiased communication with all<br />
stakeholders, whilst being conscious of the need to respect commercial<br />
sensitivities. More detail on <strong>our</strong> investor engagement programme can<br />
be found on page 48 in <strong>our</strong> Corporate Governance section.<br />
PAGE 40 VIEW THE FULL REPORT AT ANNUALREPORT12.BAKKAVOR.COM
BAKKAVOR ANNUAL REPORT AND ACCOUNTS 2012<br />
<strong>our</strong> responsibilities<br />
3. running <strong>our</strong> business sustainably<br />
IN THIS SECTION WE OUTLINE SOME OF THE KEY CSR<br />
INITIATIVES IMPLEMENTED ACROSS OUR BUSINESSES IN<br />
2012 AS WELL AS IDENTIFIED ACTIONS FOR 2013.<br />
By concentrating on these areas we aim to run<br />
<strong>our</strong> business in a sustainable way and uphold <strong>our</strong><br />
commitment to continuous improvement.<br />
BAKKAVOR ANNUAL REPORT AND ACCOUNTS 2012<br />
<strong>our</strong> responsibilities<br />
3. running <strong>our</strong> business sustainably<br />
10<br />
FOLLOWING OUR LAST EMPLOYEE SURVEY IN 2010,<br />
EMPLOYEE COMMUNICATION WAS IDENTIFIED AS A<br />
KEY IMPROVEMENT AREA.<br />
Sbakkavor apprenticeships<br />
taken up in 2012<br />
As a direct result of this, in 2012 we established<br />
a Group Communications Policy which sets out<br />
standards for Group and site communication.<br />
<strong>our</strong> 2013<br />
target is 30<br />
GROUP APPRENTICESHIPS<br />
2012 action<br />
In May 2012 we launched the <strong>Bakkavor</strong> Apprenticeship Scheme<br />
(BAS) offering Advanced Apprenticeships in Food Development,<br />
Manufacturing, Food Technology and Administration across various<br />
locations in the UK and working with the University of Lincoln as<br />
<strong>our</strong> learning provider. Successful applicants are paid more than the<br />
recommended weekly wage during their two-year apprenticeship<br />
and work towards an IPQ Level 3 Diploma in Food Industry Skills. In<br />
September 2012 we took on <strong>our</strong> first 10 apprentices.<br />
2013 focus<br />
Attracting good people into the business remains a priority. We aim to<br />
offer 30 BAS places in 2013 and have allocated dedicated res<strong>our</strong>ce inhouse<br />
to co-ordinate applicants and programmes.<br />
DIVERSITY<br />
2012 action<br />
Our ‘Better Together’ self-audit tool was designed in 2011 and launched<br />
at the beginning of 2012. During the year 16 sites completed the selfaudit<br />
and put in place action plans to improve workforce cohesion.<br />
2013 focus<br />
Following the first self-audits we have started to implement three action<br />
plans to ensure that <strong>our</strong> approach to diversity remains high on the agenda.<br />
• Diversity maps: <strong>our</strong> aim is to develop a diversity map for each<br />
business to assess and understand better <strong>our</strong> diversity profiles.<br />
• Diversity training: <strong>our</strong> aim initially is to train all managers in Dignity at<br />
Work (<strong>our</strong> internal diversity programme) and to ensure this training is<br />
refreshed every two years.<br />
• Embedding <strong>our</strong> values: this initiative, already underway, has been<br />
identified as a key activity to support a more cohesive workforce.<br />
EMPLOYEE COMMUNICATION<br />
2012 action<br />
At <strong>our</strong> 2012 GEF we relaunched <strong>our</strong> values using a new ‘winning team’<br />
theme to bring them to life and to embed them across the Group. The new<br />
look values have now been rolled out across the Group (see page 21).<br />
Following <strong>our</strong> last Employee Survey in 2010, employee communication<br />
was identified as a key improvement area. As a direct result of this, in<br />
2012 we established a Group Communications Policy which sets out<br />
standards for Group and site communication. As part of this policy we<br />
now publish a quarterly Group newsletter which updates all employees<br />
on activities across the Group and <strong>our</strong> General Managers brief their sites<br />
every quarter on the Group’s performance.<br />
Another initiative which came about as a direct result of the 2010<br />
employee survey was a need to improve the effectiveness of the SEF.<br />
Our first action was to benchmark <strong>our</strong> SEF against other companies.<br />
Although we were pleased to note that <strong>our</strong> SEF ranked highly<br />
against those of <strong>our</strong> peer group, we identified a need to improve the<br />
understanding of the role of the SEF amongst <strong>our</strong> middle managers and<br />
those responsible for chairing each local SEF.<br />
2013 focus<br />
We have developed customised training programmes for middle managers<br />
and SEF Chair people to improve the effectiveness of the SEF and we aim<br />
to measure their impact in the next employee survey due in 2013.<br />
INDUSTRY ENGAGEMENT<br />
2012 action<br />
In September 2012 we took part in a nationwide UK industry initiative<br />
to help tackle the issue of long-term youth unemployment through<br />
Skills for Work workshops. A number of <strong>our</strong> sites held half-day training<br />
sessions on CV writing and interview techniques.<br />
2013 focus<br />
We have pledged to continue <strong>our</strong> proactive involvement in this initiative<br />
and have agreed to take part in the 2013 Skills for Work week.<br />
PAGE 42 VIEW THE FULL REPORT AT ANNUALREPORT12.BAKKAVOR.COM
BAKKAVOR ANNUAL REPORT AND ACCOUNTS 2012<br />
board of directors*<br />
running <strong>our</strong> business with integrity<br />
1. Lydur Gudmundsson<br />
Non-executive Chairman<br />
Lydur founded <strong>Bakkavor</strong> Group with his brother Agust in 1986 and has<br />
served on its Board of Directors since its founding. He served as Chief<br />
Executive Officer of <strong>Bakkavor</strong> Group from 1986 to 2006, and has served as<br />
the Chairman of the Board of Directors since 2006. Lydur was educated at<br />
the Commercial College of Iceland.<br />
2. Agust Gudmundsson<br />
Chief Executive Officer<br />
Agust founded <strong>Bakkavor</strong> Group with his brother Lydur in 1986 and has<br />
served on the Board of Directors since the Company’s founding. He has<br />
served as Chief Executive Officer of <strong>Bakkavor</strong> Group since 2006, having<br />
previously served as the company’s Executive Chairman between 1986 and<br />
2006. Agust was educated at the College of Armuli in Reykjavík, Iceland.<br />
3. Halldor B. Ludvigsson<br />
Non-executive Director<br />
Halldor was elected to the <strong>Bakkavor</strong> Group Board of Directors in May<br />
2010. He serves as a Managing Director at Arion Banki’s corporate<br />
finance division. Before Halldor joined the bank, he held various<br />
management positions, including serving as the CEO of Maritech,<br />
an international technology company. He holds a master’s degree in<br />
Mechanical Engineering and a BSc in Computer Science from the<br />
University of Iceland. He is a member of the board of Atorka hf., Klakki<br />
ehf., Eignabjarg ehf., Landey ehf. and Interbulk plc.<br />
4. Bjarni Th. Bjarnason<br />
Non-executive Director<br />
Bjarni was elected to the Group’s Board of Directors in May 2010. He is the<br />
Deputy CEO and one of the founders of Arctica Finance hf., an advisory<br />
firm in Iceland. Bjarni has held various corporate advisory positions in<br />
Icelandic banks, serving last as head of corporate advisory at Landsbanki<br />
from 2003 to 2008. He is a member of the Board of Arvakur hf., Byrjun<br />
ehf., Arctica Eignarhaldsfelag ehf., SMI ehf., Viti fjarfestingafelag ehf. and<br />
Þorsmork ehf. Bjarni holds a BSc. degree in Mechanical Engineering from<br />
the University of Iceland and an MBA from Southern Methodist University.<br />
5. Gudmundur I. Sigurdsson<br />
Non-executive Director<br />
Gudmundur was elected to the <strong>Bakkavor</strong> Group Board of Directors on 25<br />
September 2012. From May 2010 to September 2012, he served as an<br />
alternate Director to the <strong>Bakkavor</strong> Group Board. Gudmundur is a partner<br />
at Lex law offices, an Icelandic legal firm, where he is an Attorney at Law.<br />
He holds a Cand jur. degree from the Faculty of Law of the University of<br />
Iceland and a Masters degree in Law (LL.M) from Duke University School<br />
of Law. Gudmundur is admitted to practise before the District C<strong>our</strong>t<br />
in Iceland, and from March 2013 he is admitted to practise before the<br />
Supreme C<strong>our</strong>t of Iceland.<br />
1<br />
2<br />
4<br />
WE ARE COMMITTED<br />
TO PRACTISING<br />
AND PROMOTING<br />
GOOD GOVERNANCE<br />
THROUGHOUT THE GROUP.<br />
3<br />
5<br />
* This is the structure of the Board as at 29 December 2012. Asgeir Thoroddsen resigned from<br />
the Group Board as Non-executive Director in September 2012.<br />
PAGE 43 VIEW THE FULL REPORT AT ANNUALREPORT12.BAKKAVOR.COM
BAKKAVOR ANNUAL REPORT AND 2012 ACCOUNTS 2012<br />
management board*<br />
aligning governance and business objectives<br />
1<br />
2 3<br />
4<br />
5 6<br />
7<br />
8<br />
1. Agust Gudmundsson<br />
Chief Executive Officer<br />
See previous page.<br />
2. Peter Gates<br />
Chief Financial Officer<br />
Peter was appointed CFO of <strong>Bakkavor</strong> Group in November 2010. He<br />
has worked in a number of international companies, including Saatchi<br />
& Saatchi Co. plc and Avis Europe plc. Peter spent much of 2009 at<br />
<strong>Bakkavor</strong> as Interim Group Treasurer. He is a Chartered Accountant and<br />
a member of the Association of Corporate Treasurers. Peter has a BSc<br />
(Hons) degree in Economics from the University of Southampton.<br />
3. Ann Savage<br />
Group Technical Director<br />
Ann was appointed Group Technical Director in 2004. She is responsible<br />
for Food Safety, Health and Safety management, Manufacturing<br />
Excellence and Environmental management at <strong>Bakkavor</strong>. Ann has more<br />
than 30 years of experience in technical, research and development and<br />
manufacturing roles within the retail and food industry. She studied at<br />
the Open University and has a Postgraduate Diploma in Management<br />
Studies from Nottingham University.<br />
4. John Gorman<br />
President – <strong>Bakkavor</strong> North America<br />
John took up his current position in January 2012, prior to which he<br />
worked as the Group’s Business Director of Fresh Meal Solutions in the<br />
UK. John has over 30 years’ experience in chilled food, 22 of which have<br />
been at <strong>Bakkavor</strong> and Geest. He has held senior roles in Operations,<br />
Technical and New Product Development and senior offices with a<br />
number of UK Food and Drink research organisations and associations.<br />
John studied Food Technology at Manchester Metropolitan University.<br />
5. Einar Gustafsson<br />
Managing Director – <strong>Bakkavor</strong> Asia<br />
Einar was appointed Managing Director for <strong>Bakkavor</strong> Asia in 2005 and<br />
has served within the Group for seven years. He began his career at<br />
Deloitte Consulting, after which he successfully turned around two<br />
businesses in the seafood industry. Einar has a BSc degree in Business<br />
Administration from the University of Southern California and an MBA<br />
from Columbia Business School.<br />
6. Mike Edwards<br />
Sector Managing Director<br />
Mike is Managing Director of the Meals Solutions sector in the UK. He<br />
joined <strong>Bakkavor</strong> in 2001 as a manufacturing manager and held various<br />
general and senior management roles within the Group before taking<br />
his current position. Prior to joining <strong>Bakkavor</strong> Mike worked in general<br />
management at Heinz. He has a BA (Hons) in Business Studies from<br />
Portsmouth Polytechnic.<br />
7. Ivan Clingan<br />
Sector Managing Director<br />
Ivan is Managing Director of the Prepared Produce sector in the UK. Since<br />
joining <strong>Bakkavor</strong> in 1990 Ivan worked in various financial, general and senior<br />
management roles before taking his current position. Prior to <strong>Bakkavor</strong> he<br />
worked at Nestle. Ivan has a BA (Joint Hons) in Finance and Economics<br />
from the University of Stirling and is a Qualified Accountant (CIMA).<br />
8. Steve Broadbent<br />
Sector Managing Director<br />
Steve is Managing Director of the Convenience Foods sector in the UK.<br />
He joined <strong>Bakkavor</strong> in 1997 as a general manager and held various roles in<br />
manufacturing, general and senior management before taking his current<br />
position. He entered the food industry in 1982 as a Graduate Trainee<br />
(Manufacturing) at Express Dairy UK Ltd (later a part of Northern Foods)<br />
and has a BSc (Hons) in Applied Biochemistry from Brunel University.<br />
* Gordon Pates, CEO UK & Europe, retired from the Group at the end of December 2012.<br />
PAGE 44 VIEW THE FULL REPORT AT ANNUALREPORT12.BAKKAVOR.COM
BAKKAVOR ANNUAL REPORT AND ACCOUNTS 2012<br />
corporate governance<br />
AT BAKKAVOR WE BELIEVE THAT EFFECTIVE<br />
GOVERNANCE IS REALISED THROUGH LEADERSHIP<br />
AND COLLABORATION.<br />
STAKEHOLDERS<br />
MANAGEMENT BOARD<br />
GROUP<br />
BOARD<br />
GROUP OPERATIONS<br />
OUR GOVERNANCE FRAMEWORK<br />
<strong>Bakkavor</strong> Group operates within a governance framework which we<br />
believe identifies all the elements of a sound approach to governance<br />
and responsibility.<br />
The Board, together with the Management Board, uses this framework<br />
to set and monitor governance and responsibility objectives, identify<br />
improvement opportunities and ensure that activities align with business<br />
strategy. Through this framework we provide assurance to all <strong>our</strong><br />
stakeholders that <strong>Bakkavor</strong> is a well-managed, responsible company.<br />
WHAT DOES GOVERNANCE MEAN FOR US<br />
At <strong>Bakkavor</strong>, governance is about making sure that the Group Board and<br />
the Management Board:<br />
• have assessed the necessary options and are taking the business in<br />
the right strategic direction<br />
• are leading and managing the business effectively and are<br />
accountable for their actions<br />
• have put in place appropriate controls which are used actively<br />
throughout the business<br />
• consider the interests of all <strong>our</strong> stakeholders in making<br />
executive decisions<br />
HOW DO WE MAKE THIS HAPPEN<br />
At <strong>Bakkavor</strong>, we believe that effective governance is realised through<br />
leadership and collaboration.<br />
The Group Board retains ultimate responsibility for upholding corporate<br />
governance standards and determining the strategic objectives of<br />
the Group.<br />
The Management Board implements the strategic objectives of the<br />
Group Board, determines investment policies, agrees on performance<br />
criteria and delegates to management of the Group operations the<br />
detailed planning and implementation of those objectives and policies<br />
in accordance with appropriate risk parameters.<br />
The Management Board monitors compliance with policies and<br />
achievement against objectives by holding management accountable<br />
for its activities through monthly and quarterly performance reporting<br />
and budget updates. In addition, the Management Board receives<br />
regular presentations from directors of key Group functions including<br />
Marketing, Human Res<strong>our</strong>ces and Legal, enabling it to explore specific<br />
issues and developments in greater detail.<br />
The governance framework is reinforced across the organisation and<br />
addresses all stakeholder interests through the five <strong>Bakkavor</strong> values,<br />
which define <strong>our</strong> approach to all aspects of <strong>our</strong> business. Our values<br />
are: Customer care, Can do, Teamwork, Innovation and Getting it right/<br />
Keeping it right. These values are fundamental to <strong>our</strong> ability to carry<br />
out <strong>our</strong> day-to-day business with integrity. We recruit new people and<br />
reward all managers against their ability to demonstrate <strong>Bakkavor</strong> values<br />
in the day-to-day running of the business. In 2012 <strong>our</strong> values were<br />
relaunched and communicated across the Group.<br />
PAGE 45 VIEW THE FULL REPORT AT ANNUALREPORT12.BAKKAVOR.COM
BAKKAVOR ANNUAL REPORT AND ACCOUNTS 2012<br />
corporate governance<br />
OUR BOARD OF DIRECTORS BRINGS A VALUABLE AND<br />
BALANCED RANGE OF EXPERIENCE.<br />
5 core values define <strong>our</strong> approach<br />
to all aspects of <strong>our</strong> business:<br />
• customer care<br />
• can do<br />
• teamwork<br />
• innovation<br />
• getting it right /<br />
keeping it right<br />
ABOUT OUR BOARD<br />
Board composition and effectiveness<br />
In conjunction with the issuance of Senior Secure Notes in 2011, the<br />
Company, <strong>Bakkavor</strong> Finance (2) plc, was incorporated and acts as a<br />
holding company of the Group. The Directors were therefore appointed<br />
either on or subsequent to the Company’s incorporation date. (For<br />
further details of Company appointments refer to the Directors’ <strong>Report</strong><br />
on page 51). The table below highlights the appointment of Board<br />
members to the overall Group, prior to the incorporation of the holding<br />
company, <strong>Bakkavor</strong> Finance (2) plc.<br />
Date of<br />
appointment<br />
Non-executive Chairman Lydur Gudmundsson 01/08/1986<br />
Chief Executive Officer Agust Gudmundsson 01/08/1986<br />
Non-executive Directors Bjarni Th. Bjarnason 14/05/2010<br />
Halldor B. Ludvigsson 14/05/2010<br />
Gudmundur I. Sigurdsson 25/09/2012<br />
Asgeir Thoroddsen<br />
Resigned<br />
25/09/2012<br />
BOARD MEETINGS<br />
The Board of Directors convened six times in 2012. The attendance is<br />
set out below.<br />
Scheduled<br />
Board meeting<br />
Board Director<br />
attendance in 2012<br />
Non-executive Chairman Lydur Gudmundsson 6/6<br />
Chief Executive Officer Agust Gudmundsson 6/6<br />
Non-executive Directors Asgeir Thoroddsen* 3/4<br />
Bjarni Th. Bjarnason 6/6<br />
Halldór B. Ludvigsson 6/6<br />
Gudmundur I. Sigurdsson* 2/2<br />
In advance of each regular Board meeting, the Board members are<br />
provided with a Board report which includes a comprehensive report<br />
of the Group’s financial and operational performance, and a broader<br />
market update. Board members are informed about all significant<br />
matters immediately.<br />
The majority of the Board Directors were independent during the<br />
financial reporting period, with three independent members and two<br />
non-independent members.<br />
It is considered that the size and composition of the Board of Directors<br />
makes it possible for it to discharge its duties efficiently and with integrity.<br />
Together, the Board of Directors brings a valuable and balanced range of<br />
experience as they all hold senior positions in professional and public life.<br />
(See page 43 for profiles of <strong>our</strong> Board of Directors).<br />
* Asgeir Thoroddsen, Non-executive Director, resigned from the Group Board on 25 September 2012.<br />
Gudmundur Sigurdsson was appointed to the Group Board on 25 September 2012.<br />
PAGE 46 VIEW THE FULL REPORT AT ANNUALREPORT12.BAKKAVOR.COM
BAKKAVOR ANNUAL REPORT AND ACCOUNTS 2012<br />
corporate governance<br />
OUR DECENTRALISED MODEL EMPOWERS THE<br />
MANAGEMENT OF OUR BUSINESSES TO IDENTIFY,<br />
EVALUATE AND MANAGE THE RISKS THEY FACE.<br />
LOSS OF KEY<br />
EMPLOYEES<br />
OPERATIONAL RISKS<br />
FOOD<br />
SAFETY &<br />
INTEGRITY<br />
GROUP TECHNICAL DIRECTOR<br />
COMMODITY<br />
PRICE INFLATION<br />
HEALTH<br />
AND SAFETY<br />
MARKET RISKS<br />
CONSUMER<br />
UNDERSTANDING<br />
CHIEF EXECUTIVE OFFICER<br />
CUSTOMER<br />
RELATIONSHIPS<br />
INTEREST<br />
RATES,<br />
LIQUIDITY<br />
AND CREDIT<br />
COVENANT<br />
COMPLIANCE<br />
CHIEF FINANCIAL OFFICER<br />
FINANCIAL RISKS<br />
RISK IDENTIFICATION AND MANAGEMENT<br />
Our decentralised model empowers the management of <strong>our</strong> businesses<br />
to identify, evaluate and manage the risks they face on a timely basis.<br />
Key risks and internal control procedures are reviewed at Group level<br />
by the Management Board and the management of principal risks<br />
is assigned to key members of the Management Board. It is their<br />
responsibility to report to the Board on a monthly basis regarding<br />
the actions associated with each of those risks.<br />
In 2011 we reported eight risks, the mitigation of which is paramount<br />
to the day-to-day running of <strong>our</strong> business and the achievement of <strong>our</strong><br />
long-term vision. Following a risk assessment in 2012, it was confirmed<br />
that all eight identified risks remain key risks to the business. These<br />
are: Food safety and integrity, Health & Safety, Loss of key employees,<br />
Customer relationships, Consumer understanding, Commodity price<br />
Inflation, Covenant compliance and Interest rates, Liquidity & credit.<br />
For more information about why these risks are deemed to be key,<br />
how we aim to mitigate them and who is responsible for managing<br />
them see page 49 and 50.<br />
CONTROLS AND COMPLIANCE<br />
The Board conducts an annual review of the Group’s systems of internal<br />
control. These systems provide an ongoing process that identifies,<br />
evaluates and manages the risks that are significant in relation to the<br />
fulfilment of the Group’s business objectives. The systems are designed<br />
to manage rather than to eliminate all possible risk and to provide<br />
reasonable, but not absolute, assurance against material misstatement<br />
or loss. The system also supports management’s decision-making,<br />
improves the reliability of business performance and assists in the<br />
preparation of the Company’s consolidated accounts.<br />
RISK MANAGEMENT PROCESS<br />
operational risks<br />
technical & she*<br />
audit team(s)<br />
group board<br />
management board<br />
Responsible for management of principal risks and<br />
reviewing key risks and internal control procedures<br />
alongside Audit committee<br />
financial risks<br />
Dedicated teams responsible for assessment and<br />
management of risks at operational level<br />
internal<br />
audit<br />
market risks<br />
marketing and<br />
npd* teams<br />
*SHE: Safety, Health and Environment<br />
*NPD: New Product Development<br />
PAGE 47 VIEW THE FULL REPORT AT ANNUALREPORT12.BAKKAVOR.COM
BAKKAVOR ANNUAL REPORT AND ACCOUNTS 2012<br />
corporate governance<br />
IN 2012 WE HELD OVER 600 MEETINGS AND TELEPHONE<br />
CALLS WITH INVESTORS AND ANALYSTS.<br />
INVESTOR ENGAGEMENT PROGRAMME<br />
200<br />
one-on-one<br />
investor meetings<br />
agm<br />
quarterly<br />
reporting<br />
corporate<br />
website<br />
relaunched<br />
>350<br />
attendees or call<br />
participants on<br />
results days<br />
45<br />
investors who<br />
t<strong>our</strong>ed <strong>our</strong><br />
factories<br />
AUDIT COMMITTEE<br />
The Board has delegated authority to the Audit Committee, which<br />
comprises key management across the business, to regularly monitor<br />
internal controls. Each year the Audit Committee meets to discuss<br />
and approve the nature and scope of the audit programme for the<br />
year. The Audit Committee then instructs the internal audit function to<br />
undertake the agreed schedule of audits, during which the effectiveness<br />
of the controls operating within the business are reviewed. The<br />
Group’s internal audit function, which comprises both employees and<br />
professionals from an external provider, RSM Tenon, has the skills and<br />
experience relevant to the operation of each business.<br />
In addition to <strong>our</strong> internal audit function, the completion of comprehensive<br />
internal control questionnaires is required from all Financial Controllers<br />
within each business unit. These self-assessment representations are<br />
designed to ensure that any material control breakdowns are highlighted<br />
and the operation of internal controls is addressed within each business<br />
unit. The results of these representations are reviewed by internal audit<br />
before being reported to the Audit Committee.<br />
AUDITORS<br />
The Audit Committee is also responsible for the appointment of the<br />
Company’s Auditor, Deloitte LLP. <strong>Annual</strong>ly the Committee reviews the<br />
relationships the Company has with Deloitte LLP and considers the<br />
level of non-audit services provided by the Auditor. The engagement<br />
of Deloitte LLP for non-audit services requires approval from the Group<br />
Financial Controller and, if significant, the Audit Committee, to ensure<br />
that any services provided do not impair the objectivity of the external<br />
Auditor. A list of non-audit services provided by Deloitte LLP in 2012<br />
and the associated fees has been provided in Note 6 of the Group’s<br />
financial statements.<br />
Disclosure of information to Auditor<br />
Each of the persons who is a Director at the date of approval of this<br />
<strong>Annual</strong> <strong>Report</strong> confirms that:<br />
• so far as the Director is aware, there is no relevant audit information<br />
of which the Company’s Auditor is unaware; and<br />
• the Director has taken all the steps that he ought to have taken<br />
as a Director in order to make himself aware of any relevant audit<br />
information and to establish that the Company’s Auditor is aware<br />
of that information.<br />
This confirmation is given and should be interpreted in accordance with<br />
the provisions of s418(2) of the Companies Act 2006.<br />
Deloitte LLP has expressed its willingness to continue in office as<br />
Auditor and a resolution to reappoint Deloitte LLP will be proposed at<br />
the Company’s <strong>Annual</strong> General Meeting.<br />
ENGAGING WITH INVESTORS<br />
The Board delegates the management of <strong>Bakkavor</strong>’s investor<br />
engagement programme to <strong>our</strong> CEO, CFO and Head of External Affairs.<br />
In 2012 the team ran a comprehensive programme and held over 600<br />
meetings and telephone calls with investors and analysts. Please refer<br />
to the Investor Relations section on <strong>our</strong> website for an overview of the<br />
2013 Financial Calendar.<br />
PAGE 48 VIEW THE FULL REPORT AT ANNUALREPORT12.BAKKAVOR.COM
BAKKAVOR ANNUAL REPORT AND ACCOUNTS 2012<br />
<strong>our</strong> risks<br />
WE HAVE IDENTIFIED EIGHT RISKS, THE SUCCESSFUL<br />
MITIGATION OF WHICH IS PARAMOUNT TO THE DAY-TO-DAY<br />
RUNNING OF OUR BUSINESS AND THE ACHIEVEMENT OF OUR<br />
LONG-TERM VISION. WE SHARE THESE WITH YOU BELOW.<br />
OUR EIGHT KEY RISKS TO THE BUSINESS<br />
1<br />
2<br />
FOOD SAFETY<br />
& INTEGRITY<br />
HEALTH<br />
AND SAFETY (H&S)<br />
WHY THIS RISK AFFECTS US<br />
Millions of people eat <strong>our</strong> products every day.<br />
We have a duty to make food that is safe for<br />
people to eat and is clearly and correctly labelled.<br />
We have a duty of care to take every reasonable<br />
step to secure and protect the H&S of <strong>our</strong><br />
employees across the Group. A relatively high<br />
proportion of <strong>our</strong> employees (over 80%) work in<br />
fast-moving manufacturing environments.<br />
WHAT MIGHT HAPPEN IF WE GET IT WRONG<br />
Failing to make safe products or label them<br />
accurately would damage <strong>our</strong> reputation in the<br />
industry and could also, ultimately, jeopardise the<br />
industry’s long-term prospects.<br />
Compromising on the H&S of <strong>our</strong> 19,000<br />
employees would damage <strong>our</strong> reputation within<br />
the industry and would further impact the business<br />
through loss of employee trust.<br />
FINANCIAL RISKS MARKET RISKS OPERATIONAL RISKS<br />
3<br />
4<br />
5<br />
6<br />
7<br />
8<br />
LOSS OF KEY<br />
EMPLOYEES<br />
CUSTOMER<br />
RELATIONSHIPS<br />
CONSUMER<br />
UNDERSTANDING<br />
COMMODITY<br />
PRICE INFLATION<br />
COVENANT<br />
COMPLIANCE<br />
INTEREST RATES,<br />
LIQUIDITY AND CREDIT<br />
We have a highly experienced senior<br />
management team which is passionate about<br />
the business and whom we consider to be a<br />
key competitive strength.<br />
We work with a concentrated number of some<br />
of the largest food retailers and foodservice<br />
providers in the world and we aim to be their<br />
supplier of choice.<br />
Our diverse and innovative product range is<br />
critical to developing customer relations and<br />
future growth.<br />
<strong>Bakkavor</strong> spends over £800 million on<br />
ingredients and packaging every year and may<br />
be exposed to fluctuating prices in significant<br />
areas of expenditure.<br />
We are subject to various financial covenants<br />
and undertakings as a consequence of <strong>our</strong><br />
borrowing agreements.<br />
We are a relatively highly leveraged company<br />
and therefore exposed to the external risk of<br />
interest rate fluctuations and the market’s view<br />
of <strong>our</strong> credit rating.<br />
We would be unable to fulfil <strong>our</strong> strategic growth<br />
objectives without the recruitment, development<br />
and retention of talented and committed people<br />
who understand and respect <strong>our</strong> values.<br />
Given the size and relatively small number of<br />
customers, any major customer loss would have<br />
a significantly negative impact on <strong>our</strong> turnover,<br />
manufacturing efficiency and profit.<br />
Investing in product areas which fail or<br />
underperform is costly in terms of res<strong>our</strong>ce,<br />
profitability and <strong>our</strong> reputation with <strong>our</strong> customers.<br />
In the short term, increases in cost prices adversely<br />
affect individual product margins. In the longer<br />
term, the inability to pass on significant commodity<br />
cost increases within a reasonable timeframe<br />
would impact the Group’s profit negatively.<br />
In order to achieve <strong>our</strong> growth objectives, we<br />
require a strong financial platform. Breaching<br />
any covenant would destabilise <strong>our</strong> platform<br />
for growth and may impair <strong>our</strong> ability to secure<br />
future financing.<br />
In order to achieve <strong>our</strong> growth objectives, we require<br />
a strong financial platform. An inability to repay<br />
interest or a downgrading of the Group’s credit rating<br />
may impair <strong>our</strong> ability to secure future financing.<br />
PAGE 49 VIEW THE FULL REPORT AT ANNUALREPORT12.BAKKAVOR.COM
BAKKAVOR ANNUAL REPORT AND ACCOUNTS 2012<br />
<strong>our</strong> risks<br />
WHO MANAGES OUR RISKS<br />
Management of all risks are assigned to Management Board<br />
members and discussed at each Management Board meeting.<br />
Risks 1 & 2: Ann Savage, Group Technical Director<br />
Risks 3, 4, 5 & 6: Agust Gudmundsson, Chief Executive Officer<br />
Risks 7 & 8: Peter Gates, Chief Financial Officer<br />
1<br />
HOW WE MITIGATE OUR RISKS<br />
We use Hazard Analysis Critical Control Point (HACCP) principles to<br />
identify the food safety controls required in <strong>our</strong> businesses. All operational<br />
staff are trained in food safety using documented procedures derived from<br />
the HACCP plan. We ensure compliance through audit of <strong>our</strong> sites and <strong>our</strong><br />
suppliers of key raw materials, using a combination of internal and external<br />
food safety experts.<br />
PROGRESS<br />
We have continued to invest in food safety processes in order to<br />
remain leading class in this area.<br />
Risk management in action:<br />
In July 2012 one of <strong>our</strong> sites was the subject of a malicious and<br />
isolated act of contamination. Our risk management processes<br />
prevented any contaminated products from leaving the factory.<br />
We took additional steps by installing CCTV and enc<strong>our</strong>aging<br />
employees to use <strong>our</strong> new ‘Speak out’ service. For more<br />
information see page 39.<br />
FINANCIAL RISKS MARKET RISKS OPERATIONAL RISKS<br />
2<br />
3<br />
4<br />
5<br />
6<br />
7<br />
8<br />
Our Group Technical Director is responsible for the Group’s H&S policies<br />
and performance and is supported by the Central Technical team which<br />
provides specialist expertise in key areas including H&S. H&S KPIs are<br />
reported monthly to the Management Board.<br />
The team’s role is to embed and monitor sound H&S practices and<br />
standards across the business and to develop a proactive accident<br />
prevention culture across the Group.<br />
We communicate <strong>our</strong> values internally in order to provide <strong>our</strong> employees<br />
with a cohesive framework. We recruit, appraise, reward and develop <strong>our</strong><br />
employees against these values. We are committed to ‘growing <strong>our</strong> own’<br />
people and provide relevant training to help <strong>our</strong> employees reach their<br />
potential. We have developed a ‘talent pipeline’ of employees based on<br />
performance and potential and we identify opportunities for them to grow<br />
within the business.<br />
Customer care is one of <strong>our</strong> five values. We invest in significant res<strong>our</strong>ce<br />
to manage and develop deep and long-lasting relationships with <strong>our</strong><br />
customers, ensuring they have access to dedicated <strong>Bakkavor</strong> employees<br />
at all levels of the decision-making process. At a senior management level<br />
we appoint Customer Champions in the UK to manage customer relations<br />
and long-term strategic account planning.<br />
We regularly commission consumer research and communicate its results<br />
to <strong>our</strong> marketing and product development teams. Market trends and<br />
<strong>Bakkavor</strong>’s market share performance are discussed at each <strong>Bakkavor</strong><br />
Management Board meeting.<br />
Through its central procurement team the Group aims to benefit from its<br />
scale and strong supplier relationships to achieve the requisite balance<br />
between price, quality, availability and service levels. Where possible it is<br />
the Group’s policy to pass on commodity price increases. Equally, it seeks to<br />
reduce costs and make products as efficiently as possible in order to offset<br />
any delays in achieving price increases.<br />
<strong>Bakkavor</strong> reviews its projections and covenant position monthly.<br />
The Group believes it is adequately placed to manage this risk<br />
successfully despite the current uncertain economic outlook and<br />
challenging macroeconomic conditions. Mitigating actions in 2012<br />
included successful price negotiations, cost reduction programmes and<br />
enhanced working capital policies, all of which will continue into 2013.<br />
These risks are actively managed by the Group’s Treasury Department. The<br />
Treasury function operates within the framework of strict Board-approved<br />
policies and procedures which are explained further in Note 29 of the<br />
Group Financial Statements.<br />
Our key H&S measure is Major Accidents per 100,000<br />
employees. In 2012 <strong>our</strong> performance improved by 26% and we<br />
continue to perform significantly better than the average for the<br />
food and drink industry. Our total number of accidents also fell<br />
by 10% in 2012.<br />
In 2012 we relaunched <strong>our</strong> values across the Group.<br />
See page 21.<br />
For the f<strong>our</strong>th year in a row we have hit or exceeded <strong>our</strong><br />
employee retention targets, achieving retention rates of 90%<br />
for managers and 92% for site-graded employees in 2012.<br />
We filled 45% of <strong>our</strong> vacancies internally in 2012.<br />
We continue to work collaboratively with customers to secure<br />
joint business plans and deliver growth across the categories<br />
in which we operate. In 2012, we received three supplier<br />
awards from <strong>our</strong> customers in recognition of <strong>our</strong> service and<br />
partnership approach.<br />
We launched over 2,000 products in 2012 and won 11 food<br />
product awards, testament to <strong>our</strong> product quality and innovation.<br />
The Group has increased its level of hedging and as at 29<br />
December 2012 32% of raw material spend for 2013 was hedged.<br />
We will continue to mitigate raw material price volatility through<br />
forward purchasing. However, in certain instances there is not<br />
always a seller willing to enter into such forward contracts.<br />
Further hedging arrangements will be secured where it is both<br />
practical and possible to do so.<br />
We renegotiated <strong>our</strong> leverage covenant in early 2012, providing<br />
increased headroom and allowing management to focus on the<br />
long-term strategy of the Group. The Directors consider that<br />
the Group has the flexibility to react to further deteriorating<br />
market conditions through implementing previously agreed early<br />
settlement arrangements with <strong>our</strong> core customers and reducing<br />
<strong>our</strong> capital expenditure programme. Further actions available to<br />
management include supply chain improvements and additional<br />
cuts to discretionary spend.<br />
Fixed interest rate swaps totalling £300 million matured in the<br />
year, leading to a reduction in interest payments. The Group<br />
continues to enter into forward contracts to reduce the Group’s<br />
exposure to foreign exchange rate movements.<br />
PAGE 50 VIEW THE FULL REPORT AT ANNUALREPORT12.BAKKAVOR.COM
BAKKAVOR ANNUAL REPORT AND ACCOUNTS 2012<br />
directors’ report<br />
THE DIRECTORS PRESENT THEIR ANNUAL REPORT ON<br />
THE AFFAIRS OF THE BAKKAVOR FINANCE (2) PLC GROUP<br />
(THE “GROUP”).<br />
This is accompanied by the financial statements<br />
and Auditor’s report for the 52 weeks ended<br />
29 December 2012. Comparatives are for the 52<br />
weeks ended 31 December 2011.<br />
index to principal directors’ report disclosures<br />
Auditor 48<br />
Board of Directors 52<br />
Charitable donations 52<br />
Creditor payment policy 52<br />
Directors’ responsibilities 52<br />
Disclosure of information to Auditor 48<br />
Employee involvement 39<br />
Employees with disabilities 52<br />
Equal opportunities 52<br />
Going concern 51<br />
Political donations 52<br />
Principal activities 51<br />
Profit 51<br />
Dividends 52<br />
PRINCIPAL ACTIVITIES<br />
The Group is a leading provider of fresh prepared food products in the<br />
United Kingdom. Our customers include some of the United Kingdom’s<br />
most reputable and well-known grocery retailers, including Tesco, Marks<br />
& Spencer, J Sainsbury, Waitrose, Asda and Morrisons, which sell <strong>our</strong><br />
products to their customers predominantly under their respective private<br />
labels. We have also established a significant presence in development<br />
markets for fresh prepared and private label food products, including<br />
Europe, the United States and China. The subsidiaries principally<br />
affecting the profits or net assets of the Group in the period are listed in<br />
Note 8 to the Company only financial statements.<br />
RESULTS FOR THE YEAR<br />
The results of the Group for the year are set out in the Group income<br />
statement. The profit for the year after taxation and exceptional items<br />
was £2.1 million (2011: loss after tax of £75.0 million). Further details of<br />
the Group’s financial performance are outlined in the Business Review.<br />
GOING CONCERN<br />
The Directors, in their detailed consideration of going concern, have<br />
reviewed the Group’s future cash forecasts and revenue projections,<br />
which they believe are based on prudent market data and past<br />
experience, and believe, based on those forecasts and projections, that<br />
it is appropriate to prepare the financial statements of the Company and<br />
the Group on a going concern basis.<br />
In arriving at this conclusion the Directors considered the Group’s<br />
financing arrangements, which comprise £350 million of seven-year<br />
listed bonds issued in February 2011 and £350 million of bank facilities<br />
committed to June 2014. The Company is in advanced discussions<br />
with its lenders regarding the refinancing of these bank facilities. Both<br />
the Company and its lenders are committed to the refinancing of both<br />
the term loan and revolving credit facility and the Board is confident of<br />
announcing new financing arrangements in the near future.<br />
Importantly, the Group’s liquidity remains particularly strong with<br />
£83.8 million of facilities undrawn as at 29 December 2012.<br />
The existing bank facilities are subject to a series of covenants set by<br />
the lenders. Financial covenants are measured quarterly and include an<br />
assessment of leverage (the ratio of net debt to EBITDA, being earnings<br />
before interest, tax, depreciation and amortisation); cash flow cover (the<br />
ratio of finance charges to cash generated from operations); interest<br />
cover (the ratio of finance charges to EBITDA); and capital expenditure<br />
limits. The key financial covenant is leverage; this was re-set earlier in<br />
the year following the successful restructuring of the Company’s parent.<br />
Under the revised covenant, leverage must be less than 5.75 times at<br />
the 2012 financial year-end and less than 5.0 times at the 2013 financial<br />
year-end. At 29 December 2012 the leverage ratio of net debt to EBITDA<br />
was 4.9 times. At the date of this report the Group has complied in<br />
all respects with the terms of its borrowing agreements, including its<br />
financial covenants, and forecasts to continue to do so.<br />
The Group believes it is adequately placed to manage covenant<br />
compliance successfully despite the challenging macroeconomic<br />
environment. In the event that conditions worsen, the Group has the<br />
flexibility to react by accessing additional working capital arrangements<br />
that we have already agreed with key stakeholders. Further actions<br />
available to management may include a reduction to <strong>our</strong> capital<br />
expenditure programme and further supply chain improvements.<br />
Consequently, the Directors have a reasonable expectation that the<br />
Company and the Group have adequate res<strong>our</strong>ces to comply with these<br />
covenants and meet their liabilities as they fall due for a period of at<br />
least 12 months from the date of approval of the financial statements.<br />
For this reason, they continue to adopt the going concern basis in<br />
preparing the financial statements.<br />
FUTURE DEVELOPMENTS<br />
As we enter the new financial year, the ongoing macroeconomic<br />
pressures on consumers and retailers combined with further inflation<br />
on raw material prices remain a challenge for the business. Despite this,<br />
the Directors are of the opinion that the strategic actions implemented<br />
in the current year, coupled with capacity and productivity investments<br />
across the Group, leave the Company in a stronger position to compete<br />
with these economic pressures. Further detail on future prospects are<br />
outlined in the Chairman’s Address and the Business Review.<br />
RESEARCH AND DEVELOPMENT<br />
The main focus of the Group’s research and development expenditure is<br />
product innovation. Research and development expenditure increased by<br />
14.5% to £6.3 million in 2012 (2011: £5.5 million).<br />
PAGE 51 VIEW THE FULL REPORT AT ANNUALREPORT12.BAKKAVOR.COM
BAKKAVOR ANNUAL REPORT AND ACCOUNTS 2012<br />
directors’ report<br />
DURING THE 2012 PERIOD THE GROUP MADE CHARITABLE<br />
DONATIONS OF £159,000 PRINCIPALLY TO LOCAL CHARITIES<br />
SERVING THE COMMUNITIES IN WHICH THE GROUP<br />
OPERATES (2011: £158,168).<br />
directors and their interests<br />
The Directors, who served throughout the period and to the date<br />
of this report are set out in the table below.<br />
Director Appointed Resigned<br />
A Gudmundsson 21 January 2011 -<br />
L Gudmundsson 7 March 2011 -<br />
B Bjarnason 7 March 2011 -<br />
H Ludvigsson 7 March 2011 -<br />
G Sigurdsson 25 September 2012 -<br />
A Thoroddsen 7 March 2011 25 September 2012<br />
Both A Gudmundsson and P Gates were appointed Directors on the date of incorporation, 21<br />
January 2011. On completion of the refinancing agreement, being 7 March 2011, P Gates resigned<br />
from the Board of Directors to allow for the Director’s of the Company’s parent, <strong>Bakkavor</strong> Group<br />
ehf., to be appointed. The Company has made qualifying third party indemnity provisions for the<br />
benefit of Directors who remain in force at the date of this report.<br />
EQUAL OPPORTUNITIES<br />
The Group is an equal opportunities employer. Equal opportunities are offered<br />
to all regardless of race, col<strong>our</strong>, nationality, ethnic origin, sex (including<br />
gender reassignment), marital or civil partnership status, disability, religion,<br />
belief, sexual orientation, pregnancy and maternity, age or trade union<br />
membership. All candidates and employees are treated equally in respect<br />
of recruitment, promotion, training, pay and other employment policies and<br />
conditions. All decisions are based on relevant merit and abilities.<br />
DISABLED EMPLOYEES<br />
The Group gives full and fair consideration to employment applications<br />
made by people with disabilities. We offer equal opportunity to all<br />
disabled candidates and employees who have a disability or who<br />
become disabled during the c<strong>our</strong>se of their employment. A full<br />
assessment of the individual’s needs is undertaken and reasonable<br />
adjustments are made to the work environment and/or practices in<br />
order to assist those with disabilities.<br />
DIVIDENDS<br />
The Directors do not propose payment of a dividend for year ended<br />
29 December 2012 (2011: £nil).<br />
FINANCIAL RISK MANAGEMENT POLICIES AND OBJECTIVES<br />
Information on the Group’s financial risk management objectives and<br />
policies and on the exposure of the Group to relevant risks in respect of<br />
financial instruments is set out in the Our Risks section and in Note 29,<br />
Financial Instruments.<br />
SUPPLIER PAYMENT POLICY<br />
The Company’s policy, which is also applied by the Group, is to settle on<br />
appropriate terms of payment with suppliers when agreeing the terms of<br />
each transaction, and to ensure that suppliers are made aware of those terms<br />
of payment and subsequently comply with those terms. Trade creditors of the<br />
Group at 29 December 2012 were equivalent to 66 (2011:60) days’ purchases,<br />
based on the average daily amount invoiced by suppliers during the year.<br />
POLITICAL DONATIONS<br />
No political donations were made during the period (2011: £nil).<br />
STATEMENT OF DIRECTORS’ RESPONSIBILITIES<br />
The Directors are responsible for preparing the <strong>Annual</strong> <strong>Report</strong> and the<br />
financial statements in accordance with applicable law and regulations.<br />
Company law requires the Directors to prepare financial statements for each<br />
financial year. Under that law the Directors have elected to prepare the financial<br />
statements in accordance with International Financial <strong>Report</strong>ing Standards<br />
(IFRSs) as adopted by the European Union. Under Company law the Directors<br />
must not approve the financial statements unless they are satisfied that they<br />
give a true and fair view of the state of affairs of the Company and the Group<br />
and of the profit or loss of the Group for that period. In preparing these financial<br />
statements, International Accounting Standard 1 requires that Directors:<br />
• properly select and apply accounting policies;<br />
• present information, including accounting policies, in a manner that<br />
provides relevant, reliable, comparable and understandable information;<br />
• provide additional disclosures when compliance with the specific<br />
requirements in IFRSs are insufficient to enable users to understand<br />
the impact of particular transactions, other events and conditions on<br />
the entity’s financial position and financial performance; and<br />
• make an assessment of the Company and the Group’s ability to<br />
continue as a going concern.<br />
The Directors are responsible for keeping adequate accounting records that<br />
are sufficient to show and explain the Group’s transactions and disclose<br />
with reasonable accuracy at any time the financial position of the Company<br />
and the Group and enable them to ensure that the financial statements<br />
comply with the Companies Act 2006. They are also responsible for<br />
safeguarding the assets of the Group and hence for taking reasonable<br />
steps for the prevention and detection of fraud and other irregularities.<br />
By order of the Board<br />
Agust Gudmundsson<br />
Director<br />
20 February 2013<br />
PAGE 52 VIEW THE FULL REPORT AT ANNUALREPORT12.BAKKAVOR.COM
BAKKAVOR ANNUAL REPORT AND ACCOUNTS 2012<br />
independent auditor’s report<br />
TO THE MEMBERS OF BAKKAVOR FINANCE (2) PLC<br />
We have audited the financial statements of <strong>Bakkavor</strong> Finance (2) plc (the ‘Company’) and its subsidiaries (the ‘Group’) for the 52 weeks ended 29<br />
December 2012 (‘period’) which comprise the consolidated income statement, consolidated statement of comprehensive income, consolidated<br />
statement of financial position, consolidated statement of changes in equity, consolidated statement of cash flows, and the related notes 1 to 39,<br />
Company income statement, Company statement of changes in equity, Company statement of financial position, Company statement of cash flows,<br />
and the related notes 1 to 13. The financial reporting framework that has been applied in their preparation is applicable law and International Financial<br />
<strong>Report</strong>ing Standards (IFRSs) as adopted by the European Union.<br />
This report is made solely to the Company’s members, as a body, in accordance with Chapter 3 of Part 16 of the Companies Act 2006. Our audit<br />
work has been undertaken so that we might state to the Company’s members those matters we are required to state to them in an auditor’s report<br />
and for no other purpose. To the fullest extent permitted by law, we do not accept or assume responsibility to anyone other than the Company and<br />
the Company’s members as a body, for <strong>our</strong> audit work, for this report, or for the opinions we have formed.<br />
Respective responsibilities of Directors and auditor<br />
As explained more fully in the Directors’ Responsibilities Statement, the Directors are responsible for the preparation of the financial statements and<br />
for being satisfied that they give a true and fair view. Our responsibility is to audit and express an opinion on the financial statements in accordance<br />
with applicable law and International Standards on Auditing (UK and Ireland). Those standards require us to comply with the Auditing Practices Board’s<br />
(APB’s) Ethical Standards for Auditors.<br />
Scope of the audit of the financial statements<br />
An audit involves obtaining evidence about the amounts and disclosures in the financial statements sufficient to give reasonable assurance that<br />
the financial statements are free from material misstatement, whether caused by fraud or error. This includes an assessment of: whether the<br />
accounting policies are appropriate to the group’s and the parent Company’s circumstances and have been consistently applied and adequately<br />
disclosed; the reasonableness of significant accounting estimates made by the Directors; and the overall presentation of the financial statements.<br />
In addition, we read all the financial and non-financial information in the annual report to identify material inconsistencies with the audited financial<br />
statements. If we become aware of any apparent material misstatements or inconsistencies we consider the implications of <strong>our</strong> report.<br />
Opinion on financial statements<br />
In <strong>our</strong> opinion the financial statements:<br />
• give a true and fair view of the state of the Group’s and the parent Company’s affairs as at 29 December 2012 and of the Group’s profit and<br />
Company’s result for the period then ended;<br />
• have been properly prepared in accordance with IFRSs as adopted by the European Union; and<br />
• have been prepared in accordance with the requirements of the Companies Act 2006.<br />
Separate opinion in relation to IFRSs as issued by the IASB<br />
As explained in note 2 to the financial statements, the Group in addition to applying IFRSs as adopted by the European Union, has also applied IFRSs<br />
as issued by the International Accounting Standards Board (IASB).<br />
In <strong>our</strong> opinion the Group financial statements comply with IFRSs as issued by the IASB.<br />
Opinion on other matter prescribed by the Companies Act 2006<br />
In <strong>our</strong> opinion the information given in the Directors’ <strong>Report</strong> for the financial year for which the financial statements are prepared is consistent with<br />
the financial statements.<br />
Matters on which we are required to report by exception<br />
We have nothing to report in respect of the following matters where the Companies Act 2006 requires us to report to you if, in <strong>our</strong> opinion:<br />
• adequate accounting records have not been kept by the parent Company, or returns adequate for <strong>our</strong> audit have not been received from branches<br />
not visited by us; or<br />
• the parent Company financial statements are not in agreement with the accounting records and returns; or<br />
• certain disclosures of Directors’ remuneration specified by law are not made; or<br />
• we have not received all the information and explanations we require for <strong>our</strong> audit.<br />
Christopher Robertson (Senior Statutory Auditor)<br />
for and on behalf of Deloitte LLP<br />
Chartered Accountants and Statutory Auditor, Birmingham, UK<br />
20 February 2013<br />
PAGE 53 VIEW THE FULL REPORT AT ANNUALREPORT12.BAKKAVOR.COM
BAKKAVOR ANNUAL REPORT AND ACCOUNTS 2012<br />
consolidated income statement<br />
52 WEEKS ENDED 29 DECEMBER 2012<br />
52 weeks ended 29 December 2012 52 weeks ended 31 December 2011<br />
Before<br />
Before<br />
non- Non- non- Nonrecurring<br />
recurring recurring recurring<br />
£m Notes items items Total items items Total<br />
Continuing operations<br />
Revenue 4,5 1,588.6 – 1,588.6 1,565.8 – 1,565.8<br />
Cost of sales (1,160.6) – (1,160.6) (1,158.2) – (1,158.2)<br />
Gross profit 428.0 – 428.0 407.6 – 407.6<br />
Distribution costs (78.0) – (78.0) (75.2) – (75.2)<br />
Other administrative costs (288.6) – (288.6) (276.2) – (276.2)<br />
Exceptional items (net) 7 – (4.4) (4.4) – 7.4 7.4<br />
<strong>Bakkavor</strong> Group ehf management charge (0.5) – (0.5) (1.2) – (1.2)<br />
Impairment of assets 8 – (1.0) (1.0) – (63.7) (63.7)<br />
Total administrative costs (289.1) (5.4) (294.5) (277.4) (56.3) (333.7)<br />
Profit/(loss) on disposal of subsidiary 31 – 0.4 0.4 – (1.0) (1.0)<br />
Loss on disposal of associate 32 – – – – (1.6) (1.6)<br />
Share of results of associates after tax 18 0.9 – 0.9 1.1 – 1.1<br />
Operating profit/(loss) 6 61.8 (5.0) 56.8 56.1 (58.9) (2.8)<br />
Investment revenue 10 0.1 – 0.1 0.1 – 0.1<br />
Finance costs 12 (61.2) – (61.2) (65.0) – (65.0)<br />
Other gains (net) 11 8.4 – 8.4 6.0 – 6.0<br />
Profit/(loss) before tax 9.1 (5.0) 4.1 (2.8) (58.9) (61.7)<br />
Tax 13 (2.7) (0.1) (2.8) 3.3 (0.8) 2.5<br />
Profit/(loss) for the period from continuing operations 6.4 (5.1) 1.3 0.5 (59.7) (59.2)<br />
Discontinued operations<br />
Profit/(loss) for the period from discontinued operations 14 – 0.8 0.8 (2.4) (13.4) (15.8)<br />
Profit/(loss) for the period 6.4 (4.3) 2.1 (1.9) (73.1) (75.0)<br />
Attributable to:<br />
Equity holders of the parent 6.7 (4.3) 2.4 (0.4) (73.1) (73.5)<br />
Non-controlling interests (0.3) – (0.3) (1.5) – (1.5)<br />
6.4 (4.3) 2.1 (1.9) (73.1) (75.0)<br />
PAGE 54 VIEW THE FULL REPORT AT ANNUALREPORT12.BAKKAVOR.COM
BAKKAVOR ANNUAL REPORT AND ACCOUNTS 2012<br />
consolidated statement of comprehensive income<br />
52 WEEKS ENDED 29 DECEMBER 2012<br />
52 weeks 52 weeks<br />
ended ended<br />
29 December 31 December<br />
£m Notes 2012 2011<br />
Profit/(loss) for the period 2.1 (75.0)<br />
Other comprehensive income/(expense)<br />
Continuing operations<br />
Exchange differences on translation of foreign operations (3.6) (2.0)<br />
Net exchange gains recycled to income statement on disposal of subsidiary 31 – (0.4)<br />
Actuarial loss on defined benefit pension schemes 36 (3.9) (18.9)<br />
Tax relating to components of other comprehensive income 13 0.9 5.0<br />
(6.6) (16.3)<br />
Discontinued operations<br />
Exchange differences on translation of foreign operations (0.1) (0.1)<br />
(6.7) (16.4)<br />
Total comprehensive expense (4.6) (91.4)<br />
Attributable to:<br />
Equity holders of the parent (4.3) (89.9)<br />
Non-controlling interests (0.3) (1.5)<br />
(4.6) (91.4)<br />
PAGE 55 VIEW THE FULL REPORT AT ANNUALREPORT12.BAKKAVOR.COM
BAKKAVOR ANNUAL REPORT AND ACCOUNTS 2012<br />
consolidated statement of financial position<br />
29 DECEMBER 2012<br />
£m Notes 29 December 2012 31 December 2011<br />
Non-current assets<br />
Goodwill 15 665.4 667.1<br />
Other intangible assets 16 26.9 35.7<br />
Property, plant and equipment 17 267.9 307.7<br />
Interests in associates 18 10.0 10.0<br />
Other investments 19 0.1 0.1<br />
Retirement benefit asset 36 10.0 9.3<br />
Current assets<br />
980.3 1,029.9<br />
Inventories 20 61.8 62.5<br />
Trade and other receivables 21 189.2 190.1<br />
Cash and cash equivalents 22 30.5 30.1<br />
Derivative financial instruments 24 0.6 0.4<br />
282.1 283.1<br />
Assets classified as held for sale 14 35.2 –<br />
317.3 283.1<br />
Total assets 1,297.6 1,313.0<br />
Current liabilities<br />
Trade and other payables 27 (302.7) (315.2)<br />
Current tax liabilities (22.7) (17.3)<br />
Borrowings 23 (31.8) (32.6)<br />
Obligations under finance leases 26 (0.1) (0.8)<br />
Provisions 28 (0.9) (1.8)<br />
Derivative financial instruments 24 (10.1) (17.9)<br />
(368.3) (385.6)<br />
Liabilities associated with assets classified as held for sale 14 (24.0) –<br />
Non-current liabilities<br />
(392.3) (385.6)<br />
Trade and other payables 27 (0.1) (0.3)<br />
Borrowings 23 (562.2) (586.3)<br />
Obligations under finance leases 26 (0.3) (1.8)<br />
Provisions 28 (10.9) (10.6)<br />
Deferred tax liabilities 25 (22.9) (27.1)<br />
(596.4) (626.1)<br />
Total liabilities (988.7) (1,011.7)<br />
Net assets 308.9 301.3<br />
Equity<br />
Share capital 30 0.1 0.1<br />
Share premium 30 315.2 302.4<br />
Merger reserve 30 45.2 45.2<br />
Capital reserve 30 4.0 4.0<br />
Translation reserve 30 20.0 23.7<br />
Retained earnings (75.6) (75.3)<br />
Equity attributable to owners of the parent 308.9 300.1<br />
Non-controlling interests – 1.2<br />
Total equity 308.9 301.3<br />
The financial statements of <strong>Bakkavor</strong> Finance (2) plc and the accompanying notes, which form an integral part of the consolidated financial statements,<br />
were approved by the Board of Directors on 20 February 2013. They were signed on behalf of the Board of Directors by:<br />
A Gudmundsson<br />
Director<br />
PAGE 56 VIEW THE FULL REPORT AT ANNUALREPORT12.BAKKAVOR.COM
BAKKAVOR ANNUAL REPORT AND ACCOUNTS 2012<br />
consolidated statement of changes in equity<br />
52 WEEKS ENDED 29 DECEMBER 2012<br />
Equity attributable to owners of the parent<br />
Non<br />
Share Share Merger Capital Translation Retained controlling Total<br />
£m capital premium reserve reserve reserve earnings Total interests equity<br />
Balance at 1 January 2011 0.1 96.6 45.2 4.0 26.2 12.1 184.2 3.5 187.7<br />
Loss for the period – – – – – (73.5) (73.5) (1.5) (75.0)<br />
Other comprehensive expense for the period – – – – (2.5) (13.9) (16.4) – (16.4)<br />
Total comprehensive expense for the period – – – – (2.5) (87.4) (89.9) (1.5) (91.4)<br />
Acquisition of subsidiary – – – – – – – (0.8) (0.8)<br />
New shares issued – 205.8 – – – – 205.8 – 205.8<br />
Balance at 31 December 2011 0.1 302.4 45.2 4.0 23.7 (75.3) 300.1 1.2 301.3<br />
Profit/(loss) for the period – – – – – 2.4 2.4 (0.3) 2.1<br />
Other comprehensive expense for the period – – – – (3.7) (3.0) (6.7) – (6.7)<br />
Total comprehensive expense for the period – – – – (3.7) (0.6) (4.3) (0.3) (4.6)<br />
Disposal of subsidiary – – – – – – – (0.6) (0.6)<br />
Acquisition of non-controlling interest – – – – – 0.3 0.3 (0.3) –<br />
New shares issued – 12.8 – – – – 12.8 – 12.8<br />
Balance at 29 December 2012 0.1 315.2 45.2 4.0 20.0 (75.6) 308.9 – 308.9<br />
PAGE 57 VIEW THE FULL REPORT AT ANNUALREPORT12.BAKKAVOR.COM
BAKKAVOR ANNUAL REPORT AND ACCOUNTS 2012<br />
consolidated statement of cash flows<br />
52 WEEKS ENDED 29 DECEMBER 2012<br />
52 weeks 52 weeks<br />
ended ended<br />
29 December 31 December<br />
£m Notes 2012 2011<br />
Net cash generated from operating activities 33 40.7 35.8<br />
Investing activities:<br />
Interest received 0.1 0.1<br />
Dividends received from associates 0.6 1.0<br />
Purchases of property, plant and equipment (32.4) (41.8)<br />
Proceeds on disposal of property, plant and equipment 3.3 1.9<br />
Payment of deferred consideration (0.2) (4.6)<br />
Acquisition of subsidiary net of cash acquired 32 – (0.2)<br />
Disposal of subsidiary net of cash disposed of 31 1.4 2.6<br />
Net cash used in investing activities (27.2) (41.0)<br />
Financing activities:<br />
Issue of shares 12.8 –<br />
Increase in borrowings 0.9 352.2<br />
Repayments of borrowings (25.4) (354.5)<br />
Repayments of obligations under finance leases (0.5) (2.9)<br />
Net cash used in financing activities (12.2) (5.2)<br />
Net increase/(decrease) in cash and cash equivalents 1.3 (10.4)<br />
Cash and cash equivalents at beginning of period 30.1 40.8<br />
Effect of foreign exchange rate changes (0.3) (0.3)<br />
Cash and cash equivalents at end of period 31.1 30.1<br />
Attributable to:<br />
Continuing operations 30.5 25.7<br />
Assets held for sale 0.6 4.4<br />
31.1 30.1<br />
PAGE 58 VIEW THE FULL REPORT AT ANNUALREPORT12.BAKKAVOR.COM
BAKKAVOR ANNUAL REPORT AND ACCOUNTS 2012<br />
notes to the consolidated financial statements<br />
52 WEEKS ENDED 29 DECEMBER 2012<br />
1<br />
GENERAL INFORMATION<br />
<strong>Bakkavor</strong> Finance (2) plc (the ‘Company’) is a Public Limited Company whose ultimate parent Company and controlling party is <strong>Bakkavor</strong> Group<br />
Limited (formerly <strong>Bakkavor</strong> Holdings Limited), a Company registered in the United Kingdom. The address of the registered office is given on page 109.<br />
The principal activities of the Company and its subsidiaries (the ‘Group’) comprise preparation and marketing of fresh prepared foods and the<br />
marketing and distribution of fresh produce. These activities are undertaken in the UK, Continental Europe, Asia, South Africa and the US and products<br />
are primarily sold through high street supermarkets.<br />
In the current year, the Group has adopted the following interpretations with no material impact on the financial statements of the Group:<br />
IFRS 1 Amendments First Time Adoption of IFRSs (Dec 2010)<br />
IFRS 7 Amendments Disclosures: Transfers of Financial Assets (Oct 2010)<br />
IAS 24 Amendments Related Party Disclosures (Nov 2009)<br />
IFRIC 14 Amendments Prepayments of a Minimum Funding Requirement (Nov 2009)<br />
Various Amendments Improvements to IFRSs (May 2010)<br />
At the date of authorisation of these financial statements, the following Standards and Interpretations which have not been applied in these financial<br />
statements were in issue but not yet effective (and in some cases have not yet been adopted by the EU):<br />
IFRS 1 Amendments Government loans (Mar 2012)<br />
IFRS 7 Amendments Disclosures: Offsetting Financial Assets and Financial Liabilities (Dec 2011)<br />
IFRS 9 Financial Instruments (Nov 2009)<br />
IFRS 9 Amendments Financial Instruments (Oct 2010)<br />
IFRS 10 Consolidated Financial Instruments (May 2011)<br />
IFRS 11 Joint Arrangements (May 2011)<br />
IFRS 12 Disclosures of Interests in Other Entities (May 2011)<br />
IFRS 13 Fair Value Measurement (May 2011)<br />
IAS 1 Amendments Presentation of Items of Other Comprehensive Income (June 2011)<br />
IAS 12 Amendments Deferred Tax: Recovery of Underlying Assets (Dec 2010)<br />
IAS 19 Amendments Employee Benefits (June 2011)<br />
IAS 27 Separate Financial Statements (May 2011)<br />
IAS 28 Investments in Associates and Joint Ventures (May 2011)<br />
IAS 32 Amendments Presentation: Offsetting Financial Assets and Financial Liabilities (Dec 2011)<br />
Various Amendments <strong>Annual</strong> Improvements 2009 – 2011 cycle (May 2012)<br />
Various Amendments<br />
Consolidated Financial Statements, Joint Arrangements and<br />
Disclosures of Interests in Other Entities: Transition Guidance (June 2012)<br />
Various Amendments IFRS 10, IFRS 12 and IAS 27: Investments Entities (Oct 2012)<br />
With the exception of IAS 19 Employee Benefits and IFRS 9 Financial Instruments, which the Group plans to adopt for the periods beginning on<br />
29 December 2013 and 4 January 2015 respectively, the Directors anticipate that the adoption of these Standards and Interpretations will have no<br />
material impact on the financial statements of the Group. The adoption of IAS 19 Employee Benefits and IFRS 9 Financial Instruments will impact<br />
the recognition and disclosure of Employee Benefits and the measurement and disclosure of Financial Instruments. It is not practical to quantify<br />
the future impact of the application of IFRS 9.<br />
PAGE 59 VIEW THE FULL REPORT AT ANNUALREPORT12.BAKKAVOR.COM
BAKKAVOR ANNUAL REPORT AND ACCOUNTS 2012<br />
notes to the consolidated financial statements<br />
continued<br />
2<br />
SIGNIFICANT ACCOUNTING POLICIES<br />
Basis of accounting<br />
The financial statements have been prepared in accordance with International Financial <strong>Report</strong>ing Standards (IFRSs) as issued by the International<br />
Accounting Standards Board (IASB). The financial statements have also been prepared in accordance with IFRSs adopted by the European Union.<br />
These financial statements are presented in Pounds Sterling because that is the currency of the primary economic environment in which the Group<br />
operates. Foreign operations are included in accordance with the foreign currency policy set out below.<br />
The financial statements have been prepared on the historical cost basis, except for the revaluation of financial instruments. The principal accounting<br />
policies adopted are set out below.<br />
Corporate Re-organisation<br />
In February 2011 a corporate re-organisation was completed in order to establish <strong>Bakkavor</strong> Finance (2) plc as an intermediate holding company of the<br />
Group and was accounted for using the principles of merger accounting.<br />
As the corporate re-organisation did not have a direct result on the Group and the underlying business has operated for all periods, the Board of<br />
Directors have prepared the financial statements to present all years on a comparative basis as if the Company had existed for all periods. Therefore the<br />
comparative figures and the first 20 days of January 2011 relate to its indirect parent, <strong>Bakkavor</strong> Group Limited (formerly <strong>Bakkavor</strong> Holdings Limited).<br />
Going Concern<br />
The Directors have reviewed the historical trading performance of the Group and the forecasts through to December 2015, to assess the level of<br />
finance required across the Group. See page 51, for the Directors’ consideration of Going Concern.<br />
Basis of consolidation<br />
The Group financial statements comprise the financial statements of the parent undertaking and its subsidiary undertakings, together with the<br />
Group’s share of the results of associated undertakings comprising a 53 or 52 week period ending on the Saturday nearest to 31 December. Where<br />
the fiscal year 2012 is quoted in these financial statements this relates to the 52 week period ended 29 December 2012. The fiscal year 2011 relates to<br />
the 52 week period ended 31 December 2011.<br />
Subsidiaries<br />
Subsidiary undertakings are included in the Group financial statements from the date on which control over the operating and financial policies is<br />
obtained, and cease to be consolidated from the date on which control is transferred out of the Group. Control exists when the Group has the power<br />
directly, or indirectly, to govern the financial and operating policies of an entity so as to obtain economic benefits from its activities.<br />
Changes in the Group’s interests in subsidiaries that do not result in a loss of control are accounted for as equity transactions. The carrying amount of<br />
the Group’s interests and the non-controlling interests are adjusted to reflect the changes in their relative interests in the subsidiaries. Any difference<br />
between the amount by which the non-controlling interests are adjusted and the fair value of the consideration paid or received is recognised directly<br />
in equity and attributed to the owners of the Company.<br />
Associates<br />
An associate is an entity over which the Group is in a position to exercise significant influence, through participation in the financial and operating<br />
policy decisions of the investee. Significant influence is the power to participate in the financial and operating policy decisions of the investee but<br />
is not control or joint control over those policies. The results, assets and liabilities of associates are incorporated in these financial statements using<br />
the equity method of accounting. Investments in associates are carried in the statement of financial position at cost as adjusted by post-acquisition<br />
changes in the Group’s share of the net assets of the associate, less any impairment in the value of individual investments.<br />
Goodwill within the associate is separately identifiable at the date of acquisition. Any negative goodwill is credited in the income statement<br />
in the period of acquisition. Losses may provide evidence of an impairment of the asset transferred in which case appropriate provision is made<br />
for impairment.<br />
Where a Group company transacts with an associate of the Group, profits and losses are eliminated to the extent of the Group’s interest in the<br />
relevant associate.<br />
PAGE 60 VIEW THE FULL REPORT AT ANNUALREPORT12.BAKKAVOR.COM
BAKKAVOR ANNUAL REPORT AND ACCOUNTS 2012<br />
notes to the consolidated financial statements<br />
continued<br />
2<br />
SIGNIFICANT ACCOUNTING POLICIES CONTINUED<br />
Business combinations<br />
Business acquisitions from third parties are accounted for using the acquisition method. The cost of the acquisition is measured at the aggregate of<br />
the fair values, at the date of exchange, of assets given, liabilities incurred or assumed, and equity instruments issued by the Group in exchange for<br />
control of the acquiree. The acquiree’s identifiable assets, liabilities and contingent liabilities that meet the conditions for recognition under IFRS 3 are<br />
recognised at their fair value at the acquisition date.<br />
Goodwill arising on business combinations is recognised as an asset and initially measured at cost, being the excess of the cost of the business<br />
combination over the Group’s interest in the net fair value of the identifiable assets, liabilities and contingent liabilities recognised. If, after the<br />
reassessment, the Group’s interest in the net fair value of the acquiree’s identifiable assets, liabilities and contingent liabilities exceeds the cost of the<br />
business combination, the excess is recognised immediately in the income statement.<br />
The share of non-controlling interests in the acquiree is initially measured at the non-controlling interests proportion of the net fair value of the assets,<br />
liabilities and contingent liabilities recognised.<br />
Where a business combination is achieved in stages, the Group’s previously-held interests in the acquired entity are re-measured to fair value at the<br />
acquisition date (i.e. the date the Group attains control) and the resulting gain or loss, if any, is recognised in the income statement.<br />
Assets held for sale and discontinued operations<br />
Disposal groups are classified as held for sale if their carrying amount will be recovered through a sale transaction rather than through continuing use.<br />
This condition is regarded as met only when the sale is highly probable, the disposal group is available for immediate sale in its present condition and<br />
management are committed to and expect to complete the sale within 12 months from the date of classification. Disposal groups classified as held<br />
for sale are measured at the lower of carrying amount and fair value less costs to sell.<br />
When the Group is committed to the loss of control of a subsidiary, through a sale transaction, all the assets and liabilities of that subsidiary are<br />
grouped together, but not offset, to present amounts classified as assets and liabilities held for sale separately in the statement of financial position.<br />
Comparative amounts for prior periods are not restated in the statement of financial position. Further disclosures on the components of the disposal<br />
group’s assets and liabilities are provided within the notes to the financial statements (see note 14).<br />
No depreciation is charged in respect of property, plant and equipment from the date the assets are classified as held for sale.<br />
A discontinued operation is a component of an entity that has either been disposed of or is classified as held for sale and represents a separate major<br />
line of business or geographical area of operation.<br />
A disposal group which qualifies as a discontinued operation is presented as a single amount and shown separately from continuing operations in the<br />
income statement and statement of comprehensive income. The components of the disposal group’s income or expense presented in the income<br />
statement are disclosed further in the notes to the financial statements (see note 14).<br />
When amounts relating to discontinued operations are separately presented in the income statement and statement of comprehensive income,<br />
comparative figures for prior periods are also restated in the income statement.<br />
Goodwill<br />
Goodwill arising on consolidation represents the excess of the cost of acquisition over the Group’s interest in the fair value of the identifiable<br />
assets and liabilities of a subsidiary or associate at the date of acquisition. Goodwill is initially recognised as an asset at cost and is subsequently<br />
measured at cost less any accumulated impairment losses. Goodwill which is recognised as an asset is reviewed for impairment at least annually or<br />
more frequently when there is an indication that the unit may be impaired. Any impairment is recognised immediately in the income statement and is<br />
not subsequently reversed.<br />
For the purpose of impairment testing, goodwill is allocated to each of the Group’s cash-generating units expected to benefit from the synergies of<br />
the combination. If the recoverable amount of the cash-generating unit is less than the carrying amount of the unit, the impairment loss is allocated<br />
first to reduce the carrying amount of any goodwill allocated to the unit and then to the other assets of the unit pro-rata on the basis of the carrying<br />
amount of each asset in the unit.<br />
On disposal of a subsidiary or associate, the attributable amount of goodwill is included in the determination of the profit or loss on disposal.<br />
Other intangible assets<br />
Intangible assets have finite useful lives over which the assets are amortised on a straight line basis. The amortisation charge for customer<br />
relationships and customer contracts is recognised as an expense over 10 years.<br />
PAGE 61 VIEW THE FULL REPORT AT ANNUALREPORT12.BAKKAVOR.COM
BAKKAVOR ANNUAL REPORT AND ACCOUNTS 2012<br />
notes to the consolidated financial statements<br />
continued<br />
2<br />
SIGNIFICANT ACCOUNTING POLICIES CONTINUED<br />
Property, plant and equipment<br />
All property, plant and equipment is stated in the statement of financial position at cost less any subsequent accumulated depreciation and<br />
subsequent accumulated impairment losses.<br />
Depreciation is charged so as to write off the cost or valuation of assets, other than land and properties under construction, over their estimated<br />
useful lives, using the straight-line method, on the following bases:<br />
Buildings – maximum period of 50 years<br />
Plant and machinery – 1 to 20 years<br />
Fixtures and equipment – 3 to 5 years<br />
Freehold land is not depreciated. Most plant and machinery is depreciated over 12 years.<br />
Assets held under finance leases are depreciated over their expected useful lives on the same basis as owned assets or, where shorter, over the term<br />
of the relevant lease.<br />
Reviews of the estimated remaining useful lives of and residual values of individual productive assets are performed annually, taking account of<br />
commercial and technological obsolescence as well as normal wear and tear. All items of property, plant and equipment are reviewed for impairment<br />
when there are indications that the carrying value may not be recoverable.<br />
The gain or loss arising on the disposal or retirement of an asset is determined as the difference between the sale proceeds and the carrying amount<br />
of the asset and is recognised in the income statement.<br />
Impairment<br />
The useful economic lives of intangible assets are determined based on a review of a combination of factors including the asset ownership rights and<br />
the nature of the overall product life cycle.<br />
Intangible assets and property, plant and equipment are tested for impairment when an event that might affect asset values has occurred. Examples<br />
of such triggering events include significant planned restructuring, a major change in market conditions or technology, expectations of future operating<br />
losses, or a significant reduction in cash flows.<br />
An impairment loss is recognised, in the income statement, to the extent that the carrying amount cannot be recovered either by selling the asset or<br />
by the discounted future earnings from operating the assets in accordance with IAS 36 “Impairment of Assets”.<br />
Inventories<br />
Inventories are stated at the lower of cost and net realisable value. Cost comprises direct materials and, where applicable, direct lab<strong>our</strong> costs and<br />
those overheads that have been incurred in bringing the inventories to their present location and condition. Cost is calculated using the weighted<br />
average method. Net realisable value represents the estimated selling price less all estimated costs of completion and costs to be incurred in<br />
marketing, selling and distribution.<br />
Assets held under leases<br />
Leases are classified as finance leases whenever the terms of the lease transfer substantially all the risks and rewards of ownership to the lessee.<br />
All other leases are classified as operating leases.<br />
Finance leases<br />
Assets held under finance leases are recognised as assets of the Group at their fair value or, if lower, at the present value of the minimum lease<br />
payments, each determined at the inception of the lease. The corresponding liability to the lessor is included in the statement of financial position<br />
as a finance lease obligation. Lease payments are apportioned between finance charges and reduction of the lease obligation so as to achieve a<br />
constant rate of interest on the remaining balance of the liability. The interest element of the finance cost is charged to the income statement over<br />
the lease period.<br />
Operating leases<br />
Rentals payable under operating leases are charged to income on a straight-line basis over the term of the relevant lease. Benefits received and<br />
receivable as an incentive to enter into an operating lease are also spread on a straight-line basis over the lease term. Income earned from operating<br />
leases is credited to the income statement when earned.<br />
PAGE 62 VIEW THE FULL REPORT AT ANNUALREPORT12.BAKKAVOR.COM
BAKKAVOR ANNUAL REPORT AND ACCOUNTS 2012<br />
notes to the consolidated financial statements<br />
continued<br />
2<br />
SIGNIFICANT ACCOUNTING POLICIES CONTINUED<br />
Revenue recognition<br />
Revenue is measured at the fair value of the consideration received or receivable and represents amounts receivable for goods provided in the normal<br />
c<strong>our</strong>se of business, net of discounts, VAT and other sales-related taxes.<br />
The Group sells fresh prepared foods and fresh produce.<br />
Revenue from the sales of these goods is recognised when all of the following conditions are satisfied:<br />
• the Group has transferred to the buyer the significant risks and rewards of ownership of the goods;<br />
• the Group retains neither continuing managerial involvement to the degree usually associated with ownership nor effective control over the<br />
goods sold;<br />
• the amount of revenue can be measured reliably;<br />
• it is probable that the economic benefits associated with the transaction will flow into the entity;<br />
• the costs incurred or to be incurred in respect of the transaction can be measured reliably.<br />
As a result, revenue for the sale of these goods is generally recognised upon delivery to the customer.<br />
Foreign currencies<br />
The individual financial statements of each Group company are presented in the currency of the primary economic environment in which it operates (its<br />
functional currency). For the purpose of the consolidated financial statements, the results and financial position of each Group company are expressed<br />
in Pounds Sterling, which is the functional currency of the Company, and the presentation currency for the consolidated financial statements.<br />
In preparing the financial statements of the individual companies, transactions in currencies other than the entity’s functional currency (foreign<br />
currencies) are recorded at the rates of exchange prevailing on the dates of the transactions. At each statement of financial position date, monetary<br />
assets and liabilities that are denominated in foreign currencies are retranslated at the rates prevailing on the statement of financial position date.<br />
Non-monetary items carried at fair value that are denominated in foreign currencies are translated at the rates prevailing at the date when the fair<br />
value was determined. Non-monetary items that are measured in terms of historical cost in a foreign currency are not retranslated.<br />
Exchange differences arising on the settlement of monetary items, and on the retranslation of monetary items, are included in the income statement<br />
for the period. Exchange differences arising on the retranslation of non-monetary items carried at fair value are included in the income statement for<br />
the period except for differences arising on the retranslation of non-monetary items carried at historical cost of which gains and losses are recognised<br />
directly in other comprehensive income.<br />
For the purpose of presenting consolidated financial statements, the assets and liabilities of the Group’s foreign operations are translated at exchange<br />
rates prevailing on the statement of financial position date. Income and expense items are translated at the annual average rate, unless exchange<br />
rates fluctuate significantly during that period, in which case the exchange rates at the date of transactions are used. Exchange differences arising,<br />
if any, are recognised in other comprehensive income and accumulated in the Group’s translation reserve.<br />
On the disposal of a foreign operation, all of the accumulated exchange differences in respect of that operation attributable to the Group are<br />
reclassified to the income statement. Goodwill and fair value adjustments arising on the acquisition of a foreign entity are treated as assets and<br />
liabilities of the foreign entity and translated at the closing rate.<br />
Research and development<br />
Research and development costs comprise all directly attributable costs necessary to create and produce new products which are both new in design<br />
and those being modified. Expenditure on research and development is recognised as an expense in the period in which it is incurred.<br />
Operating profit<br />
Operating profit is stated after (charging)/crediting exceptional items, disposal of subsidiaries and associates, impairment of assets and share of<br />
results of associates but before investment revenue and finance costs.<br />
Retirement benefit obligations<br />
Defined contribution plans<br />
A defined contribution plan is a pension plan under which the Group pays fixed contributions into a separate entity, which then invests the contributions<br />
to buy annuities for the pension liabilities as they become due based on the value of the fund and hence the Group has no legal or constructive<br />
obligations to pay further contributions. Obligations for contributions to defined contribution pension plans are recognised as an expense in the income<br />
statement as employee service is received. Prepaid contributions are recognised as an asset to the extent that a cash refund or a reduction in future<br />
payments is available. Payments made to state-managed retirement benefit schemes are dealt with as payments to defined contribution schemes<br />
where the Group’s obligations under the schemes are equivalent to those arising in a defined contribution retirement benefit scheme.<br />
PAGE 63 VIEW THE FULL REPORT AT ANNUALREPORT12.BAKKAVOR.COM
BAKKAVOR ANNUAL REPORT AND ACCOUNTS 2012<br />
notes to the consolidated financial statements<br />
continued<br />
2<br />
SIGNIFICANT ACCOUNTING POLICIES CONTINUED<br />
Retirement benefit obligations continued<br />
Defined benefit pension plans<br />
A defined benefit plan is a pension plan that defines the amount of pension benefit that an employee will receive on retirement, usually dependent on<br />
factors such as age, years of service and compensation.<br />
For defined benefit schemes, the cost of providing benefits is determined using the Projected Unit Credit Method, with actuarial valuations being<br />
carried out at each statement of financial position date. Actuarial gains and losses are recognised in full in the period in which they occur. They are<br />
recognised outside of the income statement and presented in the statement of comprehensive income.<br />
Past service cost is recognised immediately to the extent that the benefits are already vested, and otherwise is amortised on a straight-line basis over<br />
the average period until the benefits become vested.<br />
The retirement benefit recognised in the statement of financial position represents the present value of the defined benefit obligation as adjusted for<br />
unrecognised past service cost, and as reduced by the fair value of scheme assets. Any asset resulting from this calculation is limited to past service<br />
cost, plus the present value of available refunds and reductions in future contributions to the scheme.<br />
Taxation<br />
The tax expense represents the sum of the tax currently payable and deferred tax.<br />
The tax currently payable is based on taxable profit for the year. Taxable profit differs from net profit as reported in the income statement because it<br />
excludes items of income or expense that are taxable or deductible in other years and it further excludes items that are never taxable or deductible. The<br />
Group’s liability for current tax is calculated using tax rates that have been enacted or substantively enacted by the statement of financial position date.<br />
Deferred tax is the tax expected to be payable or recoverable on differences between the carrying amounts of assets and liabilities in the financial<br />
statements and the corresponding tax bases used in the computation of taxable profit, and is accounted for using the statement of financial position<br />
liability method. Deferred tax liabilities are generally recognised for all taxable temporary differences and deferred tax assets are recognised to the<br />
extent that it is probable that taxable profits will be available against which deductible temporary differences can be utilised. Such assets and liabilities<br />
are not recognised if the temporary difference arises from the initial recognition of goodwill or from the initial recognition (other than in a business<br />
combination) of other assets and liabilities in a transaction that affects neither the tax profit nor the accounting profit.<br />
Deferred tax liabilities are recognised for taxable temporary differences arising on investments in subsidiaries and associates, except where the Group<br />
is able to control the reversal of the temporary difference and it is probable that the temporary difference will not reverse in the foreseeable future.<br />
The carrying amount of deferred tax assets is reviewed at each statement of financial position date and reduced to the extent that it is no longer<br />
probable that sufficient taxable profits will be available to allow all or part of the asset to be recovered.<br />
Deferred tax is calculated at the tax rates that are expected to apply in the period when the liability is settled or the asset is realised. Deferred tax is<br />
charged or credited in the income statement, except when it relates to items charged or credited directly to equity, in which case the deferred tax is<br />
also dealt with in equity.<br />
Deferred tax assets and liabilities are offset when there is a legally enforceable right to set off current tax assets against current tax liabilities and when<br />
they relate to income taxes levied by the same taxation authority and the Group intends to settle its current tax assets and liabilities on a net basis.<br />
Financial assets<br />
All financial assets are recognised and derecognised on a trade date where the purchase or sale of a financial asset is under a contract whose<br />
terms require delivery of the financial asset within the timeframe established by the market concerned, and are initially measured at fair value, plus<br />
transaction costs, except for those financial assets classified as at fair value through profit or loss, which are initially measured at fair value.<br />
Financial assets are classified into the following specified categories: financial assets at ‘fair value through profit or loss’ (FVTPL), and ‘loans and<br />
receivables’. The classification depends on the nature and purpose of the financial assets and is determined at the time of initial recognition.<br />
Financial liabilities<br />
Financial liabilities held by the Group are classified as other financial liabilities at amortised cost and derivatives at FVTPL.<br />
Loans and receivables<br />
Trade receivables and other receivables that have fixed or determinable payments that are not quoted in an active market are classified as ‘loans and<br />
receivables’. Loans and receivables are measured at amortised cost using the effective interest method, less any impairment. Interest income is<br />
recognised by applying the effective interest rate, except for short term receivables when the recognition of interest would be immaterial.<br />
PAGE 64 VIEW THE FULL REPORT AT ANNUALREPORT12.BAKKAVOR.COM
BAKKAVOR ANNUAL REPORT AND ACCOUNTS 2012<br />
notes to the consolidated financial statements<br />
continued<br />
2<br />
SIGNIFICANT ACCOUNTING POLICIES CONTINUED<br />
Financial assets and financial liabilities continued<br />
Other financial liabilities<br />
Other financial liabilities, including borrowings, are initially measured at fair value, net of transaction costs. Other financial liabilities are subsequently<br />
measured at amortised cost using the effective interest method, with interest expense recognised on an effective yield basis.<br />
Effective interest method<br />
Income is recognised on an effective interest basis for debt instruments other than those financial liabilities designated as at FVTPL. The effective<br />
interest method is a method of calculating the amortised cost of a debt instrument and of allocating interest income over the relevant period.<br />
The effective interest rate is the rate that exactly discounts estimated future cash payments through the expected life of the debt instrument, or,<br />
where appropriate, a shorter period, to the net carrying amount on initial recognition.<br />
Financial assets and financial liabilities at FVTPL<br />
Financial assets and financial liabilities are classified as at FVTPL when the financial asset/liability is either held for trading or it is designated as<br />
at FVTPL.<br />
A financial asset/liability is classified as held for trading if:<br />
• It has been acquired/incurred principally for the purpose of selling/disposal in the near term; or<br />
• It is a part of a portfolio of identified financial instruments that the Group manages together and has a recent actual pattern of short-term<br />
profit-taking; or<br />
• It is a derivative that is not designated and effective as a hedging instrument.<br />
A financial asset/liability other than a financial asset/liability held for trading may be designated as at FVTPL upon initial recognition if:<br />
• Such designation eliminates or significantly reduces a measurement or recognition inconsistency that would otherwise arise; or<br />
• The financial asset/liability forms part of a group of financial assets or financial liabilities or both, which is managed and its performance is evaluated<br />
on a fair value basis, in accordance with the Group’s documented risk management or investment strategy, and information about the Group is<br />
provided internally on that basis; or<br />
• It forms part of a contract containing one or more embedded derivatives, and IAS 39 Financial Instruments: Recognition and Measurement permits<br />
the entire combined contract (asset or liability) to be designated as at FVTPL.<br />
Financial assets/liabilities at FVTPL are stated at fair value, with any resultant gain or loss recognised in the income statement. The net gain or loss<br />
recognised in the income statement incorporates any dividend or interest earned on the financial asset and interest paid on the financial liability. Fair<br />
value is determined in the manner described in note 29.<br />
Impairment of financial assets<br />
Financial assets, other than those at FVTPL, are assessed for indicators of impairment at each statement of financial position date. Financial assets<br />
are impaired where there is objective evidence that, as a result of one or more events that occurred after the initial recognition of the financial asset,<br />
the estimated future cash flows of the financial asset have been affected.<br />
Objective evidence of impairment could include:<br />
• significant financial difficulty of the issuer or counterparty; or<br />
• default or delinquency in interest or principal payments; or<br />
• it becoming probable that the borrower will enter bankruptcy or financial re-organisation.<br />
For certain categories of financial assets such as trade receivables, assets that are assessed not to be impaired individually are, in addition, assessed<br />
for impairment on a collective basis. Objective evidence of impairment for a portfolio of receivables could include the Group’s past experience of<br />
collecting payments, an increase in the number of delayed payments in the portfolio past the average credit period, as well as observable changes<br />
in national and local economic conditions that correlate with default on receivables. For financial assets carried at amortised cost, the amount of the<br />
impairment is the difference between the asset’s carrying amount and the present value of estimated future cash flows, discounted at the financial<br />
asset’s original effective interest rate.<br />
The carrying amount of the financial asset is reduced by the impairment loss directly for all financial assets with the exception of trade receivables,<br />
where the carrying amount is reduced through the use of an allowance account. When a trade receivable is considered uncollectible, it is written<br />
off against the allowance account. Subsequent recoveries of amounts previously written off are credited against the allowance account. Changes in<br />
the carrying amount of the allowance account are recognised in the income statement. If in a subsequent period, the amount of the impairment loss<br />
decreases and the decrease can be related objectively to an event occurring after the impairment was recognised, the previously recognised impairment<br />
loss is reversed through the income statement to the extent that the carrying amount of the asset at the date the impairment is reversed does not<br />
exceed what the amortised cost would have been had the impairment not been recognised.<br />
PAGE 65 VIEW THE FULL REPORT AT ANNUALREPORT12.BAKKAVOR.COM
BAKKAVOR ANNUAL REPORT AND ACCOUNTS 2012<br />
notes to the consolidated financial statements<br />
continued<br />
2<br />
SIGNIFICANT ACCOUNTING POLICIES CONTINUED<br />
Financial assets and financial liabilities continued<br />
Derecognition of financial assets and financial liabilities<br />
The Group derecognises a financial asset only when the contractual rights to the cash flows from the asset expire; or it transfers the financial asset<br />
and substantially all the risks and rewards of ownership of the asset to another entity. Financial liabilities are derecognised when, and only when the<br />
Group’s obligations are discharged, cancelled or expire.<br />
Derivative financial instruments<br />
The Group’s activities expose it primarily to the financial risks of changes in foreign currency exchange rates and interest rates. The Group uses foreign<br />
exchange forward contracts and interest rate swap contracts to manage these exposures. The Group does not use derivative financial instruments for<br />
speculative purposes. The use of financial derivatives is governed by the Group’s policies approved by the Board of Directors, which provide written<br />
principles on the use of financial derivatives. Changes in the fair value of derivative financial instruments are recognised in the income statement<br />
as they arise. Derivatives embedded in other financial instruments or other host contracts are treated as separate derivatives when their risks and<br />
characteristics are not closely related to those of host contracts and the host contracts are not carried at fair value, with gains or losses reported in<br />
the income statement.<br />
Provisions<br />
Provisions are recognised when the Group has a present obligation (legal or constructive) as a result of a past event, it is probable that the Group will<br />
be required to settle that obligation and a reliable estimate can be made of the amount of the obligation.<br />
The amount recognised as a provision is the best estimate of the consideration required to settle the present obligation at the statement of financial<br />
position date, taking into account the risks and uncertainties surrounding the obligation. Where a provision is measured using the cash flows<br />
estimated to settle the present obligation, its carrying amount is the present value of those cash flows. When some or all of the economic benefits<br />
required to settle a provision are expected to be recovered from a third party, a receivable is recognised as an asset if it is virtually certain that<br />
reimbursement will be received and the amount of the receivable can be measured reliably.<br />
A restructuring provision is recognised when the Group has developed a detailed formal plan for the restructuring and has raised a valid expectation<br />
in those affected that it will carry out the restructuring by starting to implement the plan or announcing its main features to those affected by it. The<br />
measurement of a restructuring provision includes only the direct expenditures arising from the restructuring, which are those amounts that are both<br />
necessarily entailed by the restructuring and not associated with the ongoing activities of the entity. Present obligations arising from onerous contacts<br />
are recognised and measured as provisions. An onerous contract is considered to exist where the Group has a contract under which the unavoidable<br />
costs of meeting the obligations under the contract exceed the economic benefits expected to be received under it.<br />
Contingent liabilities<br />
A contingent liability is a possible obligation that arises from past events and the existence of which will only be confirmed by the occurrence or<br />
non-occurrence of one or more uncertain future events not wholly within the control of the Group or the amount of the obligation cannot be measured<br />
reliably. A contingent liability is not recognised but it is disclosed in the notes to the financial statements and is not recognised when the obligation is<br />
not probable. When an outflow becomes probable, it is recognised as a provision.<br />
3<br />
CRITICAL ACCOUNTING JUDGEMENTS AND KEY SOURCES OF ESTIMATION UNCERTAINTY<br />
Critical judgements in applying the Group’s accounting policies<br />
The following are areas of particular significance to the Group’s financial statements and include the application of judgement, which is fundamental<br />
to the compilation of a set of financial statements:<br />
Assets held for sale and discontinued operations<br />
On 23 November 2012 the Group entered into an agreement with a leading European food co-operative to sell its French and Spanish businesses<br />
Cinquieme Saison Saint-Pol SAS, Cinquieme Saison Macon SAS, <strong>Bakkavor</strong> France SAS, Crudi SAS and Sogesol SAS. This transaction is subject to<br />
competition authority clearance but the Directors believe it highly probable that the sale will complete within 12 months and so under the terms of<br />
IFRS 5 ‘Non-current Assets Held for Sale and Discontinued Operations’ these assets are considered to be a disposal group classified as held for sale<br />
and measured at the lower of carrying amount and fair value less costs to sell.<br />
The Directors consider the disposal group to be a separate major geographical area of operations and so the group has been classified as a<br />
discontinued operation in these financial statements.<br />
PAGE 66 VIEW THE FULL REPORT AT ANNUALREPORT12.BAKKAVOR.COM
BAKKAVOR ANNUAL REPORT AND ACCOUNTS 2012<br />
notes to the consolidated financial statements<br />
continued<br />
3<br />
CRITICAL ACCOUNTING JUDGEMENTS AND KEY SOURCES OF ESTIMATION UNCERTAINTY CONTINUED<br />
Going concern<br />
The Directors, in their detailed consideration of going concern, have reviewed the Group’s future cash forecasts and revenue projections, which they<br />
believe are based on prudent market data and past experience, and believe, based on those forecasts and projections, that it is appropriate to prepare<br />
the financial statements of the Company and the Group on a going concern basis.<br />
In arriving at this conclusion the Directors considered the Group’s financing arrangements, which comprise £350 million of seven-year listed bonds<br />
issued in February 2011 and £350 million of bank facilities committed to June 2014. The Company is in advanced discussions with its lenders regarding<br />
the refinancing of these bank facilities. Both the Company and its lenders are committed to the refinancing of both the Term loan and Revolving Credit<br />
Facility and the Board is confident of announcing new financing arrangements in the near future. Importantly, the Group’s liquidity remains particularly<br />
strong with £83.8 million of facilities undrawn as at 29 December 2012.<br />
The existing bank facilities are subject to a series of covenants set by the lenders. Financial covenants are measured quarterly and include an<br />
assessment of leverage (the ratio of net debt to EBITDA, being earnings before interest, tax, depreciation and amortisation); cash flow cover (the ratio<br />
of finance charges to cash generated from operations); interest cover (the ratio of finance charges to EBITDA) and capital expenditure limits. The key<br />
financial covenant is leverage; this was re-set earlier in the year following the successful restructuring of the Company’s parent. Under the revised<br />
covenant, leverage must be less than 5.75 times at the 2012 financial year-end and less than 5.0 times at the 2013 financial year-end. At 29 December<br />
2012 the leverage ratio of net debt to EBITDA was 4.9 times. At the date of this report the Group has complied in all respects with the terms of its<br />
borrowing agreements, including its financial covenants and forecasts to continue to do so.<br />
The Group believes it is adequately placed to manage covenant compliance successfully despite the challenging macroeconomic environment.<br />
In the event that conditions worsen, the Group has the flexibility to react by accessing additional working capital arrangements that we have already<br />
agreed with key stakeholders. Further actions available to management may include a reduction to <strong>our</strong> capital expenditure programme and supply<br />
chain improvements. Consequently the Directors have a reasonable expectation that the Company and the Group have adequate res<strong>our</strong>ces<br />
to comply with these covenants and meet their liabilities as they fall due for a period of at least 12 months from the date of approval of the financial<br />
statements. For this reason they continue to adopt the going concern basis in preparing the financial statements.<br />
Impairment of goodwill and other intangible assets<br />
The recoverable amount of CGUs are determined based on the higher of net realisable value and value-in use calculations. These calculations require<br />
the use of estimates. The Group has considered the impact of the assumptions used on the calculations and has conducted sensitivity analysis on the<br />
impairment tests of the CGUs carrying values. See notes 15 and 16 for further details.<br />
Fair value of derivatives and other financial instruments<br />
Derivative financial instruments and certain other financial assets are recorded at fair value in the statement of financial position. The fair value of<br />
the financial instruments that do not have quoted market prices requires significant judgement and estimates. The Directors use their judgement in<br />
selecting an appropriate valuation technique for these financial instruments. Valuation techniques commonly used by market practitioners are applied.<br />
For derivative financial instruments, assumptions are made based on quoted market rates adjusted for specific features of the instrument. Other<br />
financial instruments are valued using a discounted cash flow analysis based on assumptions supported, where possible, by observable market<br />
prices or rates. The estimation of fair value of unlisted shares includes some assumptions not supported by observable market prices or rates. These<br />
assumptions are based on past and expected future performance. Details of the assumptions used and of the results of sensitivity analyses regarding<br />
these assumptions are disclosed in note 29.<br />
Pensions<br />
The Group maintains a number of defined benefit pension plans for which it has recorded a pension asset or liability. The pension asset/liability<br />
is based on an actuarial valuation that requires a number of assumptions including discount rate, mortality rates and actual return on plan assets<br />
that may necessitate material adjustments to this asset/liability in the future. The assumptions used by the Group are the best estimates based on<br />
historical trends and the composition of the work force. Details of the principal actuarial assumptions used in calculating the recognised asset/liability<br />
for the defined benefit plan are given in note 36.<br />
Recognition of deferred tax assets and current tax provision<br />
The recognition of deferred tax assets is based upon whether it is probable that sufficient and suitable taxable profits will be available in the future<br />
against which the reversal of temporary differences can be deducted. Where the temporary differences related to losses, the availability of the losses<br />
to offset against forecast taxable profits is also considered. Recognition therefore involves judgement regarding the future financial performance of<br />
the particular legal entity or tax group in which the deferred tax asset has been recognised.<br />
The Group had unrecognised deferred tax assets as a result of unused tax losses of £40.5 million (2011: £17.9 million), available for offset against<br />
future profits. Deferred tax assets are not recognised on the losses carried forward to the extent that it is not probable that the losses will be utilised.<br />
The Group operates in various countries and its income tax returns are subject to audit and adjustment by local tax authorities. The nature of the<br />
Group’s tax exposures is often complex and subject to change and the amounts at issue can be substantial. The Group develops an estimate of the<br />
potential tax liability based on the tax positions taken, historical experience and its internal tax expertise. These estimates are refined as additional<br />
information becomes known. Any outcome upon settlement that differs from a recorded provision may result in a materially higher or lower tax<br />
expense in future periods.<br />
PAGE 67 VIEW THE FULL REPORT AT ANNUALREPORT12.BAKKAVOR.COM
BAKKAVOR ANNUAL REPORT AND ACCOUNTS 2012<br />
notes to the consolidated financial statements<br />
continued<br />
4<br />
SEGMENT INFORMATION<br />
The chief operating decision-maker has been defined as the Management Board headed by the Chief Executive Officer. They review the Group’s<br />
internal reporting in order to assess performance and allocate res<strong>our</strong>ces. Management has determined the segments based on these reports.<br />
As at the statement of financial position date, the Group is organised as follows:<br />
• UK:<br />
• International:<br />
The preparation and marketing of fresh prepared foods and fresh produce for distribution in the UK.<br />
The preparation and marketing of fresh prepared foods and fresh produce outside of the UK.<br />
During 2012, management reviewed its current reporting segments and has met the disclosure requirements for combining all of the non-UK<br />
segments into one category, which is represented by the International segment. The UK Prepared and UK Produce segments have also been<br />
combined into one reporting segment. This results in UK and International being presented as the Group’s two segments.<br />
The Group’s segment measure of profit represents operating profit before exceptional items, disposals of subsidiaries, associates and property,<br />
plant and equipment, impairment of assets, management charges and share of results of associates. Measures of total assets are provided to the<br />
Management Board; however, cash and cash equivalents, short term deposits and some other central assets are not allocated to individual segments.<br />
Measures of segment liabilities are not provided to the Management Board.<br />
The following table provides an analysis of the Group’s segment information for the period to 29 December 2012:<br />
£m UK International Un-allocated Group total Discontinued Continuing<br />
operations operations total<br />
Revenue 1,407.0 287.2 – 1,694.2 105.6 1,588.6<br />
Segment profit 63.1 0.7 – 63.8 1.1 62.7<br />
Exceptional items (2.9) (0.7) – (3.6) 0.8 (4.4)<br />
Impairment of assets (1.0) – – (1.0) – (1.0)<br />
<strong>Bakkavor</strong> Group ehf management charge (0.5) – (0.5)<br />
Profit on disposal of subsidiary 0.4 – 0.4<br />
Loss on disposal of property, plant and equipment (1.3) – (1.3)<br />
Share of results of associates 0.9 – 0.9<br />
Operating profit 58.7 1.9 56.8<br />
Investment revenue 0.1 – 0.1<br />
Finance costs (61.5) (0.3) (61.2)<br />
Other gains (net) 8.4 – 8.4<br />
Profit before tax 5.7 1.6 4.1<br />
Tax (3.6) (0.8) (2.8)<br />
Profit for the period 2.1 0.8 1.3<br />
Other segment information:<br />
Depreciation and amortisation (41.1) (10.2) – (51.3) (3.1) (48.2)<br />
Adjusted EBITDA 104.2 10.9 – 115.1 4.2 110.9<br />
Capital additions 22.6 9.2 – 31.8 1.2 30.6<br />
Total assets 1,077.9 178.4 41.3 1,297.6 35.2 1,262.4<br />
Discontinued operations relate to the Group’s International segment.<br />
The Group manages the performance of its businesses through the use of ‘Adjusted EBITDA’. EBITDA is generally defined as operating profit/ (loss)<br />
before share of results of associates, depreciation and amortisation. In calculating Adjusted EBITDA, we further exclude restructuring costs, asset<br />
impairments and those additional charges or credits that are one-off in nature and significance.<br />
PAGE 68 VIEW THE FULL REPORT AT ANNUALREPORT12.BAKKAVOR.COM
BAKKAVOR ANNUAL REPORT AND ACCOUNTS 2012<br />
notes to the consolidated financial statements<br />
continued<br />
4<br />
SEGMENT INFORMATION CONTINUED<br />
The following table provides an analysis of the Group’s segment information for the period to 31 December 2011 as restated:<br />
£m UK International Un-allocated Group total Discontinued Continuing<br />
operations operations total<br />
Revenue 1,387.8 289.9 – 1,677.7 111.9 1,565.8<br />
Segment profit/(loss) 59.4 (5.0) – 54.4 (2.1) 56.5<br />
Exceptional items 8.5 (1.3) – 7.2 (0.2) 7.4<br />
Impairment of assets (37.3) (39.6) – (76.9) (13.2) (63.7)<br />
<strong>Bakkavor</strong> Group ehf management charge (1.2) – (1.2)<br />
Loss on disposal of subsidiary (1.0) – (1.0)<br />
Loss on disposal of associate (1.6) – (1.6)<br />
Loss on disposal of property, plant and equiptment (0.3) – (0.3)<br />
Share of results of associates 1.1 – 1.1<br />
Operating loss (18.3) (15.5) (2.8)<br />
Investment revenue 0.1 – 0.1<br />
Finance costs (65.2) (0.2) (65.0)<br />
Other gains (net) 6.0 – 6.0<br />
Loss before tax (77.4) (15.7) (61.7)<br />
Tax 2.4 (0.1) 2.5<br />
Loss for the period (75.0) (15.8) (59.2)<br />
Other segment information:<br />
Depreciation and amortisation (41.2) (12.1) – (53.3) (4.3) (49.0)<br />
Adjusted EBITDA 100.6 7.1 – 107.7 2.2 105.5<br />
Capital additions 31.6 4.9 – 36.5 1.5 35.0<br />
Total assets 1,082.4 189.8 40.8 1,313.0 42.7 1,270.3<br />
Discontinued operations relate to the Group’s International segment.<br />
The effect of reclassifying certain overseas operations on revenue and adjusted EBITDA for 2011 is £19.6 million and £0.2 million profit respectively<br />
which reduces the UK segment and increases the International segment by these amounts.<br />
Major customers<br />
In 2012 the Group’s five largest customers accounted for 80% (2011: 80%) of <strong>our</strong> total revenue from continuing operations, with no single customer<br />
representing more than 31% (2011: 30%) of <strong>our</strong> global revenue from continuing operations. The Group does not enter into long-term contracts with<br />
its retail customers.<br />
5<br />
REVENUE<br />
52 weeks 52 weeks<br />
ended ended<br />
29 December 31 December<br />
£m 2012 2011<br />
Continuing operations<br />
Sales of goods 1,588.6 1,565.8<br />
Investment revenue 0.1 0.1<br />
1,588.7 1,565.9<br />
Discontinued operations<br />
Sales of goods (note 14) 105.6 111.9<br />
PAGE 69 VIEW THE FULL REPORT AT ANNUALREPORT12.BAKKAVOR.COM
BAKKAVOR ANNUAL REPORT AND ACCOUNTS 2012<br />
notes to the consolidated financial statements<br />
continued<br />
6<br />
OPERATING PROFIT/(LOSS)<br />
Operating profit/(loss) for the period has been arrived at after charging/(crediting):<br />
52 weeks 52 weeks<br />
ended ended<br />
29 December 31 December<br />
£m 2012 2011<br />
Continuing operations<br />
Depreciation of property, plant and equipment – owned 39.5 38.7<br />
– leased – 1.2<br />
Research and development costs 6.3 5.5<br />
Cost of inventory recognised as an expense 796.0 811.8<br />
Write down of inventories recognised as an expense 0.8 0.2<br />
Amortisation of intangible assets 8.7 9.2<br />
Impairment of assets (note 8) 1.0 63.7<br />
Exceptional items (note 7) 4.4 (7.4)<br />
Loss on disposal of property, plant and equipment 1.3 0.3<br />
(Profit)/loss on disposal of subsidiary (note 31) (0.4) 1.0<br />
Loss on disposal of associate (note 32) – 1.6<br />
Staff costs (note 9) 368.3 336.3<br />
Discontinued operations<br />
Depreciation of property, plant and equipment – owned 2.4 2.8<br />
– leased 0.7 1.2<br />
Research and development costs 0.1 0.1<br />
Cost of inventory recognised as an expense 52.0 56.3<br />
Amortisation of intangible assets – 0.2<br />
Impairment of assets (note 8) – 13.2<br />
Exceptional items (note 7) (0.8) 0.2<br />
Staff costs (note 9) 29.5 31.7<br />
The analysis of auditor remuneration is as follows:<br />
52 weeks 52 weeks<br />
ended ended<br />
29 December 31 December<br />
£’000 2012 2011<br />
Fees payable to the Company’s auditor for the audit of the Company’s annual accounts 70 85<br />
The audit of the Company’s subsidiaries pursuant to legislation 420 549<br />
Total audit fees 490 634<br />
Tax services 82 313<br />
Fees payable to the Company’s auditor and their associates for other services to the Group 45 281<br />
Total non-audit fees 127 594<br />
Of the total prior period non-audit fees, £539,000 relates to the refinancing that was completed in February 2011.<br />
PAGE 70 VIEW THE FULL REPORT AT ANNUALREPORT12.BAKKAVOR.COM
BAKKAVOR ANNUAL REPORT AND ACCOUNTS 2012<br />
notes to the consolidated financial statements<br />
continued<br />
7<br />
EXCEPTIONAL ITEMS (NET)<br />
Exceptional items are those that, in management’s judgement, should be disclosed by virtue of their nature or amount. Exceptional items are<br />
as follows:<br />
52 weeks 52 weeks<br />
ended ended<br />
29 December 31 December<br />
£m 2012 2011<br />
Continuing operations<br />
Restructuring costs (2.8) (7.7)<br />
Temporary site closure (1.6) –<br />
Defined benefit pension scheme credit – 12.0<br />
Legal settlement – 3.1<br />
(4.4) 7.4<br />
Discontinued operations<br />
Restructuring costs – (0.2)<br />
Legal settlement 0.8 –<br />
0.8 (0.2)<br />
Restructuring costs<br />
In 2012, the Group incurred £2.8 million (2011: £7.7 million) of restructuring costs from continuing operations, primarily relating to redundancy costs.<br />
The Group did not incur any restructuring costs in 2012, relating to discontinued operations (2011: £0.2 million).<br />
Temporary site closure<br />
During the period, a malicious act of contamination at one of <strong>our</strong> sites led to its temporary closure. This charge related primarily to the costs<br />
associated with the disposal of products, extending <strong>our</strong> installation of CCTV cameras, and the increased costs of working, including additional<br />
lab<strong>our</strong> costs and further security measures.<br />
Defined benefit pension scheme<br />
The exceptional non-cash credit of £12.0 million in 2011, relates to the defined benefit pension scheme. This has arisen due to the closure of the<br />
defined benefit pension scheme to future accrual as at the end of March 2011.<br />
Other exceptional items<br />
During 2012, discontinued operations within the Group received £0.8 million (2011: £nil) from a legal claim made in relation to the acquisition of<br />
a building. This claim has now been settled. In 2011, the Group’s continuing operations received £3.1 million from the settlement of a legal claim.<br />
The allocation of exceptional items by segment is shown in note 4 of the accounts.<br />
8<br />
IMPAIRMENT OF ASSETS<br />
52 weeks 52 weeks<br />
ended ended<br />
29 December 31 December<br />
£m 2012 2011<br />
Continuing operations<br />
Impairment of goodwill – 59.1<br />
Impairment of intangible assets – 2.9<br />
Impairment of property, plant and equipment 1.0 1.7<br />
1.0 63.7<br />
Discontinued operations<br />
Impairment of goodwill – 12.1<br />
Impairment of intangible assets – 1.1<br />
– 13.2<br />
The annual impairment review of the carrying value of goodwill and intangible assets has resulted in no impairment charge being recognised<br />
within the Group (2011: £63.7 million from continuing operations and £13.2 million from discontinued operations).<br />
During the period, the Group has impaired property, plant and equipment by £1.0 million (2011: £1.7 million), within continuing operations in its<br />
UK businesses.<br />
PAGE 71 VIEW THE FULL REPORT AT ANNUALREPORT12.BAKKAVOR.COM
BAKKAVOR ANNUAL REPORT AND ACCOUNTS 2012<br />
notes to the consolidated financial statements<br />
continued<br />
9<br />
STAFF COSTS<br />
The average monthly number of employees (including executive Directors) during the year was:<br />
2012 2011<br />
Number Number<br />
Continuing operations<br />
Production 15,921 14,874<br />
Management and administration 1,630 1,688<br />
Sales and distribution 826 830<br />
18,377 17,392<br />
Discontinued operations<br />
Production 858 856<br />
Management and administration 121 127<br />
Sales and distribution 29 43<br />
1,008 1,026<br />
Their aggregate remuneration comprised:<br />
52 weeks 52 weeks<br />
ended ended<br />
29 December 31 December<br />
£m 2012 2011<br />
Continuing operations<br />
Wages and salaries 329.1 310.4<br />
Social security and other costs 36.4 36.0<br />
Other pension costs/(income) 2.8 (10.1)<br />
368.3 336.3<br />
Discontinued operations<br />
Wages and salaries 21.2 22.8<br />
Social security and other costs 8.3 8.9<br />
29.5 31.7<br />
In 2011, other pension costs included £12.0 million defined benefit pension credits as per note 36.<br />
The Directors’ emoluments were as follows:<br />
52 weeks 52 weeks<br />
ended ended<br />
29 December 31 December<br />
£’000 2012 2011<br />
Directors’ emoluments excluding pension contributions 844 819<br />
Directors’ pension contributions 109 124<br />
953 943<br />
The aggregate emoluments of the highest paid director were £532,793 (2011: £596,520). The accrued pension contributions of the highest paid<br />
director at 29 December 2012 were £73,750 (2011: £76,250).<br />
PAGE 72 VIEW THE FULL REPORT AT ANNUALREPORT12.BAKKAVOR.COM
BAKKAVOR ANNUAL REPORT AND ACCOUNTS 2012<br />
notes to the consolidated financial statements<br />
continued<br />
10<br />
INVESTMENT REVENUE<br />
52 weeks 52 weeks<br />
ended ended<br />
29 December 31 December<br />
£m 2012 2011<br />
Continuing operations<br />
Interest on bank deposits 0.1 0.1<br />
11<br />
OTHER GAINS (NET)<br />
52 weeks 52 weeks<br />
ended ended<br />
29 December 31 December<br />
£m 2012 2011<br />
Continuing operations<br />
Change in the fair value of derivative financial instruments 8.0 6.3<br />
Foreign exchange gains/(losses) 0.4 (0.3)<br />
8.4 6.0<br />
12<br />
FINANCE COSTS<br />
52 weeks 52 weeks<br />
ended ended<br />
29 December 31 December<br />
£m 2012 2011<br />
Continuing operations<br />
Interest on borrowings 53.5 60.3<br />
Interest on obligations under finance leases – 0.1<br />
Amortisation of refinancing costs 6.9 3.8<br />
Unwinding of discount on provisions (note 28) 0.8 0.8<br />
61.2 65.0<br />
Discontinued operations<br />
Interest on borrowings 0.1 0.1<br />
Interest on obligations under finance leases 0.2 0.1<br />
0.3 0.2<br />
PAGE 73 VIEW THE FULL REPORT AT ANNUALREPORT12.BAKKAVOR.COM
BAKKAVOR ANNUAL REPORT AND ACCOUNTS 2012<br />
notes to the consolidated financial statements<br />
continued<br />
13<br />
TAX<br />
52 weeks 52 weeks<br />
ended ended<br />
29 December 31 December<br />
£m 2012 2011<br />
Continuing operations<br />
Current tax:<br />
Current period 0.9 3.8<br />
Prior period adjustment 4.9 (1.3)<br />
Deferred tax:<br />
Current period (note 25) (3.0) (5.5)<br />
Prior period adjustment (note 25) – 0.5<br />
2.8 (2.5)<br />
Discontinued operations<br />
Current tax 0.8 0.1<br />
Deferred tax (note 25) – –<br />
0.8 0.1<br />
Corporation tax is calculated at 24.5% (2011: 26.5%) of the estimated assessable profit/(loss) for the period. Taxation for other jurisdictions is<br />
calculated at the rates prevailing in the respective jurisdictions. Of the charge to current tax, £0.8 million (2011: £0.1 million) related to profits/(losses)<br />
arising in the disposal group, classed as a discontinued operation during the period.<br />
The charge/(credit) for the period can be reconciled to the profit/(loss) per the income statement as follows:<br />
2012 2012 2011 2011<br />
£m % £m %<br />
Profit/(loss) before tax: 4.1 100.0 (61.7) (100.0)<br />
Tax at the blended UK corporation tax rate of 24.5% (2011: 26.5%) 1.0 24.5 (16.3) (26.5)<br />
Non-deductible expenses 1.0 24.5 17.4 28.2<br />
Adjustment in respect of prior periods 4.9 119.5 (0.8) (1.3)<br />
R&D tax credits (0.5) (12.2) (1.7) (2.8)<br />
Tax effect of utilisation of tax losses not previously recognised (0.4) (9.8) (0.7) (1.1)<br />
Tax effect of losses carried forward not recognised 1.1 26.8 1.6 2.6<br />
Overseas taxes at different rates (0.2) (4.9) 0.9 1.5<br />
Release of deferred tax on IBA reversal (2.1) (51.2) (0.8) (1.3)<br />
Deferred tax change in rate (2.0) (48.9) (2.1) (3.4)<br />
Tax charge/(credit) and effective tax rate for the period 2.8 68.3 (2.5) (4.1)<br />
In addition to the amount credited to the income statement, a £0.9 million credit (2011: £5.0m credit) relating to tax has been recognised directly in<br />
other comprehensive income. No other tax charges/credits have been recognised directly in equity.<br />
During the year the relevant deferred tax balances have been re-measured as a result of the change in the UK main corporation tax rate to 24%, which<br />
was substantively enacted on 26 March 2012 and became effective from 1 April 2012; and to 23%, which was substantively enacted on 3 July 2012<br />
and will be effective from 1 April 2013.<br />
Further reductions to the UK corporation tax rate were announced in the March 2012 Budget and December 2012 Autumn Statement. The changes<br />
propose to reduce the rate to 21% by 1 April 2014. The changes had not been substantively enacted at the balance sheet date and therefore are not<br />
recognised in these financial statements.<br />
PAGE 74 VIEW THE FULL REPORT AT ANNUALREPORT12.BAKKAVOR.COM
BAKKAVOR ANNUAL REPORT AND ACCOUNTS 2012<br />
notes to the consolidated financial statements<br />
continued<br />
14<br />
ASSETS HELD FOR SALE AND DISCONTINUED OPERATIONS<br />
On 23 November 2012, the Group entered into an agreement with a leading European food co-operative, to sell its French and Spanish businesses<br />
comprising Cinquieme Saison Saint-Pol SAS, Cinquieme Saison Macon SAS, <strong>Bakkavor</strong> France SAS, Crudi SAS and Sogesol SA for €33 million<br />
(£27 million) debt free and cash free. Completion of the transaction is subject to competition authority clearance, which the Directors believe<br />
will be obtained in the first half of 2013.<br />
The Directors believe this transaction to be highly probable based on the ongoing willingness of both parties to complete the transaction, as<br />
demonstrated by a signed sale and purchase agreement and a commitment from both the Group and the purchaser to address questions raised by<br />
the competition authorities as they continue to review the proposed transaction.<br />
As a result these operations have been classified as a disposal group. Therefore the assets and liabilities of the disposal group are presented<br />
separately in the statement of financial position and the assets and liabilities are classified as held for sale. The disposal group also qualifies as a<br />
discontinued operation and has been presented as such in the income statement.<br />
The proceeds from the disposal are expected to exceed the book value of the related net assets and accordingly no impairment losses have been<br />
recognised on the classification of these operations as held for sale.<br />
The results of the discontinued operations, which represent a separate major geographical area, have been included in the consolidated income<br />
statement as follows:<br />
52 weeks 52 weeks<br />
ended ended<br />
29 December 31 December<br />
£m Notes 2012 2011<br />
Discontinued operations<br />
Revenue 4 105.6 111.9<br />
Cost of sales (75.7) (81.6)<br />
Gross profit 29.9 30.3<br />
Distribution costs (9.4) (10.3)<br />
Other administrative costs (19.4) (22.1)<br />
Exceptional items 7 0.8 (0.2)<br />
Impairment of assets 8 – (13.2)<br />
Total administrative costs (18.6) (35.5)<br />
Operating profit/(loss) 6 1.9 (15.5)<br />
Finance costs 12 (0.3) (0.2)<br />
Profit/(loss) before tax 1.6 (15.7)<br />
Tax 13 (0.8) (0.1)<br />
Profit/(loss) for the period from discontinued operations 0.8 (15.8)<br />
Attributable to:<br />
Equity holders of the parent 0.8 (15.8)<br />
During the year, discontinued operations contributed £0.3 million (2011: cash contributed £1.2 million) to the Group’s net operating cash flows, paid<br />
£1.2 million (2011: paid £2.6 million) in respect of investing activities and paid £0.3 million (2011: paid £1.1 million) in respect of financing activities.<br />
PAGE 75 VIEW THE FULL REPORT AT ANNUALREPORT12.BAKKAVOR.COM
BAKKAVOR ANNUAL REPORT AND ACCOUNTS 2012<br />
notes to the consolidated financial statements<br />
continued<br />
14Non-current assets<br />
Property, plant and equipment 17 20.5<br />
ASSETS HELD FOR SALE AND DISCONTINUED OPERATIONS CONTINUED<br />
The major classes of assets and liabilities comprising the operations classified as held for sale are as follows:<br />
29 December<br />
£m Notes 2012<br />
Current assets<br />
Inventories 2.5<br />
Trade and other receivables 11.6<br />
Cash and cash equivalents 0.6<br />
14.7<br />
Total assets classified as held for sale 35.2<br />
Current liabilities<br />
Trade and other payables (21.5)<br />
Current tax liabilities (0.5)<br />
Obligations under finance leases (0.5)<br />
(22.5)<br />
Non-current liabilities<br />
Obligations under finance leases (1.5)<br />
Total liabilities associated with assets classified as held for sale (24.0)<br />
Net assets of disposal group 11.2<br />
15<br />
GOODWILL<br />
£m<br />
Cost<br />
At 1 January 2011 739.9<br />
Adjustment to consideration on acquisition of subsidiaries (note 32) 0.1<br />
Acquisition of subsidiaries (note 32) 0.4<br />
Disposal of subsidiary (note 31) (1.3)<br />
Exchange differences (0.8)<br />
At 31 December 2011 738.3<br />
Adjustment to consideration on acquisition of subsidiaries (note 32) 0.1<br />
Exchange differences (2.5)<br />
At 29 December 2012 735.9<br />
Accumulated impairment losses<br />
At 1 January 2011 –<br />
Impairment (71.2)<br />
At 31 December 2011 (71.2)<br />
Exchange differences 0.7<br />
At 29 December 2012 (70.5)<br />
Carrying amount<br />
At 29 December 2012 665.4<br />
At 31 December 2011 667.1<br />
PAGE 76 VIEW THE FULL REPORT AT ANNUALREPORT12.BAKKAVOR.COM
BAKKAVOR ANNUAL REPORT AND ACCOUNTS 2012<br />
notes to the consolidated financial statements<br />
continued<br />
15<br />
GOODWILL CONTINUED<br />
Goodwill acquired in a business combination is allocated, at acquisition, to the CGUs that are expected to benefit from that business combination.<br />
A summary of the allocation of the carrying value of goodwill is as follows:<br />
29 December 31 December<br />
£m 2012 2011<br />
UK 604.1 604.1<br />
International 61.3 63.0<br />
The recoverable amounts of the CGUs are determined based on value in use calculations.<br />
665.4 667.1<br />
The following impairments have been recognised within the Group’s two reporting segments during the period presented:<br />
29 December 31 December<br />
£m 2012 2011<br />
Continuing operations<br />
UK – 34.3<br />
International – 24.8<br />
– 59.1<br />
Discontinued operations<br />
International – 12.1<br />
– 12.1<br />
There have been no impairments to goodwill in 2012. The 2011 goodwill impairment arose as a result of adverse trading conditions.<br />
The key assumptions used in the impairment reviews were as follows:<br />
• Discount rates: Management uses post-tax rates that reflect current market assessments of the time value of money and the risks specific to the<br />
CGUs. The present value of the future cash flows is calculated using a pre-tax discount rate that ranges from 9.0% to 10.0% (2011: 10.0% to 10.9%).<br />
• Growth rates: The revenue growth rates are based on industry growth forecasts. Changes in selling prices and direct costs are based on past practices<br />
and expectations of future changes in the market. The Group this year has prepared cash flow forecasts derived from the most recent financial<br />
budgets approved by management for the next three years and extrapolated cash flows for the following two years based on an estimated growth<br />
rate, determined by business unit, to provide a five year forecast. Cash flows are then extrapolated using a perpetuity growth rate of 2 per cent (2011:<br />
2 per cent). The forecast cashflow of CGUS in those territories with growth rates below 2% perpetuity have been adjusted to reflect this.<br />
The assumptions used, and the impact of sensitivities on these assumptions, are shown below:<br />
£m UK International<br />
Sensitivity:<br />
Head room of impairment test based on management assumptions 156.1 9.9<br />
If the pre-tax discount rate were to be increased by a factor of 5%, this would result in an impairment charge of £2.7 million and for an increase of<br />
10% the impairment charge would be £27.5 million. A 10% reduction in the perpetuity growth rate would not result in any further impairment charge.<br />
PAGE 77 VIEW THE FULL REPORT AT ANNUALREPORT12.BAKKAVOR.COM
BAKKAVOR ANNUAL REPORT AND ACCOUNTS 2012<br />
notes to the consolidated financial statements<br />
continued<br />
16<br />
OTHER INTANGIBLE ASSETS<br />
Customer Customer<br />
£m Relationships Contracts Total<br />
Cost<br />
At 1 January 2011 92.7 1.6 94.3<br />
Exchange differences (0.1) – (0.1)<br />
At 31 December 2011 92.6 1.6 94.2<br />
Exchange differences (0.2) – (0.2)<br />
At 29 December 2012 92.4 1.6 94.0<br />
Amortisation<br />
At 1 January 2011 (44.2) (0.9) (45.1)<br />
Impairment (4.0) – (4.0)<br />
Charge for the period (9.2) (0.2) (9.4)<br />
At 31 December 2011 (57.4) (1.1) (58.5)<br />
Charge for the period (8.5) (0.2) (8.7)<br />
Exchange differences 0.1 – 0.1<br />
At 29 December 2012 (65.8) (1.3) (67.1)<br />
Carrying amount<br />
At 29 December 2012 26.6 0.3 26.9<br />
At 31 December 2011 35.2 0.5 35.7<br />
There have been no impairments to other intangible assets in 2012 (2011: £4.0 million).<br />
The breakdown of where the impairments have occurred by reporting segment is as follows:<br />
29 December 31 December<br />
£m 2012 2011<br />
Continuing operations<br />
UK – 1.3<br />
International – 1.6<br />
– 2.9<br />
Discontinued operations<br />
International – 1.1<br />
– 1.1<br />
PAGE 78 VIEW THE FULL REPORT AT ANNUALREPORT12.BAKKAVOR.COM
BAKKAVOR ANNUAL REPORT AND ACCOUNTS 2012<br />
notes to the consolidated financial statements<br />
continued<br />
17<br />
PROPERTY, PLANT AND EQUIPMENT<br />
Land Plant Fixtures<br />
and and and<br />
£m buildings machinery equipment Total<br />
Cost<br />
At 1 January 2011 196.7 261.1 67.4 525.2<br />
Additions 2.9 31.9 1.7 36.5<br />
Acquisition of subsidiary (note 32) – – 0.2 0.2<br />
Disposal of subsidiary (note 31) (2.0) – (2.2) (4.2)<br />
Disposals – (7.9) (0.4) (8.3)<br />
Reclassification from assets held for sale 6.1 – – 6.1<br />
Exchange differences (0.5) (1.2) (0.4) (2.1)<br />
At 31 December 2011 203.2 283.9 66.3 553.4<br />
Additions 5.0 24.2 2.6 31.8<br />
Disposal of subsidiary (note 31) (1.7) (0.8) (0.2) (2.7)<br />
Disposals (7.2) (4.3) (1.8) (13.3)<br />
Transfer to assets held for sale (13.1) (20.5) (17.4) (51.0)<br />
Exchange differences (1.2) (2.0) 0.2 (3.0)<br />
At 29 December 2012 185.0 280.5 49.7 515.2<br />
Accumulated depreciation and impairment<br />
At 1 January 2011 (78.9) (104.7) (27.0) (210.6)<br />
Charge for the period (8.1) (28.3) (7.5) (43.9)<br />
Disposals of subsidiary (note 31) 0.3 – 0.9 1.2<br />
Disposals – 7.6 0.3 7.9<br />
Impairment of assets (0.7) (0.8) (0.2) (1.7)<br />
Exchange differences 0.3 0.8 0.3 1.4<br />
At 31 December 2011 (87.1) (125.4) (33.2) (245.7)<br />
Charge for the period (7.9) (28.0) (6.7) (42.6)<br />
Disposals of subsidiary (note 31) 0.7 0.4 0.1 1.2<br />
Disposals 2.7 4.2 1.8 8.7<br />
Impairment of assets – (0.9) (0.1) (1.0)<br />
Transfer to assets held for sale 5.8 14.3 10.4 30.5<br />
Exchange differences 0.6 1.1 (0.1) 1.6<br />
At 29 December 2012 (85.2) (134.3) (27.8) (247.3)<br />
Carrying amount<br />
At 29 December 2012 99.8 146.2 21.9 267.9<br />
At 31 December 2011 116.1 158.5 33.1 307.7<br />
During the period, the Group has expanded its disclosure of property, plant and equipment to include plant and machinery as a separate category.<br />
The Group believes this better represents the categories of assets held by the Group and as a result the prior period disclosure has been revised to<br />
reflect this change.<br />
The carrying value of the Group’s fixtures and equipment includes an amount of £0.5 million (2011: £4.2 million) in respect of assets held under<br />
finance leases.<br />
At 29 December 2012, the Group had entered into contractual commitments for the acquisition of property, plant and equipment amounting to<br />
£3.2 million (2011: £3.4 million).<br />
During the period, the Group impaired property, plant and equipment by £1.0 million (2011: £1.7 million, UK Produce), within continuing operations in<br />
its UK businesses.<br />
PAGE 79 VIEW THE FULL REPORT AT ANNUALREPORT12.BAKKAVOR.COM
BAKKAVOR ANNUAL REPORT AND ACCOUNTS 2012<br />
notes to the consolidated financial statements<br />
continued<br />
18Aggregated amounts relating to associates<br />
Total assets 16.3 15.9<br />
Total liabilities (10.6) (10.4)<br />
Net assets 5.7 5.5<br />
INTERESTS IN ASSOCIATES<br />
29 December 31 December<br />
£m 2012 2011<br />
Group’s share of net assets of associates 2.0 2.0<br />
Premium on acquisition 8.0 8.0<br />
Interests in associates 10.0 10.0<br />
Revenue 64.5 75.5<br />
Profit for the period 2.2 3.0<br />
Group’s share of associates’ profit for the period 0.9 1.1<br />
Details of the principal associated undertakings of the Group at 29 December 2012 were as follows:<br />
Proportion of voting interest Place of registration Method of<br />
Name 2012 2011 and operation accounting<br />
Manor Fresh Limited 27.5% 27.5% United Kingdom Equity<br />
La Rose Noire Limited 45.0% 45.0% Hong Kong Equity<br />
Manor La Rose Gastro<br />
Fresh Noire Primo<br />
£m Limited Limited Limited Total<br />
Share of net assets/costs<br />
At 1 January 2011 0.5 9.3 2.4 12.2<br />
Share of profit after tax 0.3 0.8 – 1.1<br />
Currency movement – 0.1 – 0.1<br />
Dividend payment (0.2) (0.8) – (1.0)<br />
Disposal of associate – – (2.4) (2.4)<br />
At 31 December 2011 0.6 9.4 – 10.0<br />
Share of profit after tax 0.1 0.8 – 0.9<br />
Currency movement – (0.3) – (0.3)<br />
Dividend payment (0.1) (0.5) – (0.6)<br />
At 29 December 2012 0.6 9.4 – 10.0<br />
19<br />
OTHER INVESTMENTS<br />
Non listed<br />
investments<br />
£m held at cost<br />
At 31 December 2011 and 29 December 2012 0.1<br />
20<br />
INVENTORIES<br />
29 December 31 December<br />
£m 2012 2011<br />
Raw materials and packaging 49.3 48.2<br />
Work-in-progress 2.2 2.4<br />
Finished goods 10.3 11.9<br />
61.8 62.5<br />
PAGE 80 VIEW THE FULL REPORT AT ANNUALREPORT12.BAKKAVOR.COM
BAKKAVOR ANNUAL REPORT AND ACCOUNTS 2012<br />
notes to the consolidated financial statements<br />
continued<br />
21<br />
TRADE AND OTHER RECEIVABLES<br />
29 December 31 December<br />
£m 2012 2011<br />
Amounts receivable from trade customers 159.2 164.8<br />
Allowance for doubtful debts (0.8) (3.2)<br />
Net amounts receivable from trade customers 158.4 161.6<br />
Deferred consideration 0.1 –<br />
Other receivables 13.1 10.7<br />
Prepayments 17.6 17.8<br />
189.2 190.1<br />
The average credit period taken on sales of goods is 34 days (2011 – 36 days). An allowance has been made for estimated irrecoverable amounts from<br />
the sale of goods of £0.8 million (2011: £3.2 million). Allowances against receivables are made on a specific basis based on objective evidence and<br />
previous default experience. Receivables are therefore deemed past due but not impaired when the contractual obligation to pay has been exceeded,<br />
but as yet no objective evidence or previous default experience indicates this debt will be irrecoverable.<br />
The Directors consider that the carrying amount of trade and other receivables approximates to their fair value due to their short-term nature.<br />
The following table is an ageing analysis of trade receivables:<br />
29 December 31 December<br />
£m 2012 2011<br />
Not past due 145.2 145.3<br />
Past due by 1 – 30 days 12.0 14.7<br />
Past due by 31 – 60 days 1.2 1.5<br />
Past due by 61 – 90 days 0.2 0.5<br />
Past due by more than 90 days 0.6 2.8<br />
159.2 164.8<br />
Trade receivables renegotiated in 2012 that would have otherwise have been past due or impaired amounted to £nil (2011: £nil)<br />
The majority of the Group’s customers are all leading UK retailers, representing more than 80% (2011: 80%) of the Group’s revenue and therefore<br />
hold fav<strong>our</strong>able credit ratings. On this basis the Group does not see any need to charge interest, seek collateral or credit enhancements to secure any<br />
of its trade receivables due to their short term nature.<br />
The following table is an analysis of the movement of the Group’s trade receivables allowance for doubtful debts:<br />
29 December 31 December<br />
£m 2012 2011<br />
Balance at beginning of the period (3.2) (4.4)<br />
Allowances recognised against receivables (0.3) (1.1)<br />
Amounts written off as uncollectible during the period 0.4 0.5<br />
Amounts recovered during the period 0.4 1.5<br />
Allowance reversed 1.6 0.3<br />
Transferred to asset held for sale 0.3 –<br />
Balance at end of the period (0.8) (3.2)<br />
The following table is an analysis of the Group’s net trade receivables by currency:<br />
29 December 31 December<br />
£m 2012 2011<br />
GBP 132.7 125.3<br />
USD 4.7 4.6<br />
Euro 15.3 25.2<br />
CZK 0.3 0.3<br />
ZAR 1.6 1.7<br />
RMB 2.5 3.3<br />
CAD 0.3 0.1<br />
HKD 1.0 1.1<br />
158.4 161.6<br />
PAGE 81 VIEW THE FULL REPORT AT ANNUALREPORT12.BAKKAVOR.COM
BAKKAVOR ANNUAL REPORT AND ACCOUNTS 2012<br />
notes to the consolidated financial statements<br />
continued<br />
22<br />
CASH AND CASH EQUIVALENTS<br />
29 December 31 December<br />
£m 2012 2011<br />
Cash and cash equivalents 30.5 30.1<br />
Cash and cash equivalents comprise cash held by the Group and short-term bank deposits with an original maturity of three months or less which are<br />
readily convertible to a known amount of cash and are subject to an insignificant risk of change in value.<br />
The carrying amount of these assets approximates their fair value.<br />
23<br />
BORROWINGS<br />
29 December 31 December<br />
£m 2012 2011<br />
Bank overdrafts 4.4 4.1<br />
Bank loans 237.2 262.8<br />
8.25% Senior Secured Notes 352.4 352.0<br />
594.0 618.9<br />
Borrowings repayable as follows:<br />
On demand or within one year 31.8 32.6<br />
In the second year 217.4 16.6<br />
In the third to fifth years inclusive 344.8 569.7<br />
594.0 618.9<br />
Analysed as:<br />
Amount due for settlement within 12 months (shown within current liabilities) 31.8 32.6<br />
Amount due for settlement after 12 months 562.2 586.3<br />
594.0 618.9<br />
Borrowings by currency<br />
29 December 31 December<br />
£m 2012 2011<br />
GBP 587.5 611.8<br />
Euro 4.5 5.1<br />
RMB 1.4 1.5<br />
CZK 0.4 0.3<br />
HKD 0.2 0.2<br />
594.0 618.9<br />
PAGE 82 VIEW THE FULL REPORT AT ANNUALREPORT12.BAKKAVOR.COM
BAKKAVOR ANNUAL REPORT AND ACCOUNTS 2012<br />
notes to the consolidated financial statements<br />
continued<br />
23<br />
BORROWINGS CONTINUED<br />
29 December 31 December<br />
2012 2011<br />
% %<br />
The weighted average interest rates paid were as follows:<br />
Bank overdrafts 1.84 1.78<br />
Bank loans 6.85 6.93<br />
The Group has a £50 million (2011: £300 million) interest rate swap in place at 29 December 2012. The 8.25% Senior Secured Notes due in 2018,<br />
were issued at a fixed rate, but the Group’s term loan and other borrowings are arranged at floating rates, thus exposing the Group to cash flow<br />
interest rate risk.<br />
The Directors estimate the fair value of the Group’s borrowings are not materially different from their book value due to the current rates available to<br />
the Group being in line with the rates agreed over the facilities and the relative costs of renegotiation of the debt as compared to the capital value.<br />
29 December 31 December<br />
£m 2012 2011<br />
Analysis of net debt<br />
Cash and cash equivalents 30.5 30.1<br />
Borrowings (21.0) (19.5)<br />
Unamortised fees 5.3 4.0<br />
Interest accrual (16.1) (17.1)<br />
Finance leases (0.1) (0.8)<br />
Debt due within one year (31.9) (33.4)<br />
Borrowings (570.9) (597.6)<br />
Unamortised fees 8.7 11.3<br />
Finance leases (0.3) (1.8)<br />
Debt due after one year (562.5) (588.1)<br />
Total net debt (563.9) (591.4)<br />
The <strong>Bakkavor</strong> Finance (2) plc bond and bank facilities are subject to various restrictive financial covenants including interest cover ratio (EBITDA<br />
as a multiple of finance charges), leverage (net debt as a multiple of EBITDA) and cashflow cover (cashflow as a multiple of finance charges).<br />
At 29 December 2012 the Group was in compliance with all such covenants. The key features of the bond and loans are as follows:<br />
<strong>Bakkavor</strong> Finance (2) plc bond<br />
<strong>Bakkavor</strong> Finance (2) plc has £350 million (2011: £350 million) of 8.25% Senior Secured Notes due in 2018. Interest on the Notes is payable<br />
semi-annually each year on February 15 and August 15. The Notes will mature on 15 February 2018.<br />
<strong>Bakkavor</strong> Finance (2) plc bank facilities<br />
<strong>Bakkavor</strong> Finance (2) plc has a Term loan of £260 million of which £25 million has been repaid, and a Revolving credit facility (RCF) of £90 million (2011:<br />
£120 million) which both expire on 30 June 2014. The RCF facility was reduced in the period by £30 million as part of an amendment agreement which<br />
saw the Group’s leverage covenant amended. The Group has repaid £25 million and so has drawn £235 million (2011: £260 million) of the Term loan<br />
but has not drawn any (2011: £nil) of the RCF as at 29 December 2012. The RCF facility includes a £5 million (2011: £10 million) ‘carve out’ for overdraft<br />
and £17.5 million (2011: £20 million) for ancillary facilities. At 29 December 2012, £6.2 million (2011: £13.7 million) of the ‘carve out’ was utilised.<br />
The Term loan is repaid in instalments with £4.9 million paid in June 2012 and £4.8 million on 31 December 2012. This is then followed by payments<br />
of £9.2 million in June 2013 and December 2013, with the balance then due on maturity in June 2014. During the period, the Group repaid a further<br />
£19.7 million from the proceeds of business/asset disposals and equity issues to reduce the balance of the Term loan. The interest rate of the Term<br />
loan at 29 December 2012 was a variable rate of 5.48% (2011: 5.63%) which represents LIBOR plus a margin of 4.5%. Both the Senior Secured<br />
Notes and bank facilities are secured by fixed and floating charges over the assets of <strong>Bakkavor</strong> Finance (2) plc and its subsidiaries as governed by<br />
the Inter-creditor Agreement.<br />
PAGE 83 VIEW THE FULL REPORT AT ANNUALREPORT12.BAKKAVOR.COM
BAKKAVOR ANNUAL REPORT AND ACCOUNTS 2012<br />
notes to the consolidated financial statements<br />
continued<br />
24<br />
DERIVATIVE FINANCIAL INSTRUMENTS<br />
Held for trading derivatives that are not designated in hedge accounting relationships:<br />
29 December 31 December<br />
£m 2012 2011<br />
Foreign currency contracts – included in current assets 0.6 0.4<br />
Foreign currency contracts (0.6) (2.0)<br />
Interest rate contracts (9.5) (15.9)<br />
Included in current liabilities (10.1) (17.9)<br />
Total (9.5) (17.5)<br />
Further details of derivative financial instruments are provided in note 29.<br />
25<br />
DEFERRED TAX<br />
The following are the major deferred tax liabilities and assets recognised by the Group and movements thereon during the current and prior reporting<br />
period.<br />
Accelerated<br />
Retirement<br />
tax Fair value Impairment benefit<br />
£m depreciation gains Intangibles Provisions losses obligations Total<br />
At 1 January 2011 29.6 (6.6) 13.3 (1.4) (1.6) 3.2 36.5<br />
Charge/(credit) to income (7.3) 2.4 (4.4) 0.1 0.1 4.1 (5.0)<br />
Credit to equity – – – – – (5.0) (5.0)<br />
Translation of overseas balances 0.6 – – – – – 0.6<br />
As 31 December 2011 22.9 (4.2) 8.9 (1.3) (1.5) 2.3 27.1<br />
Charge/(credit) to income (3.0) 2.1 (2.7) (0.4) 0.1 0.9 (3.0)<br />
Credit to equity – – – – – (0.9) (0.9)<br />
Translation of overseas balances (0.3) – – – – – (0.3)<br />
As 29 December 2012 19.6 (2.1) 6.2 (1.7) (1.4) 2.3 22.9<br />
Certain deferred tax assets and liabilities have been offset and the net liability is shown as deferred tax liabilities in the statement of financial position.<br />
At the statement of financial position date, the Group had unused tax losses of £40.5 million (2011: £17.9 million) available for offset against future<br />
profits. Deferred tax assets are not recognised on the losses carried forward to the extent that it is not probable that the losses will be utilised.<br />
The Group is not aware of any temporary differences associated with undistributed earnings of subsidiaries due to the availability of tax credits<br />
against such liabilities. The Group is in a position to control the timing of the reversal of any such temporary differences should they arise.<br />
Temporary differences arising in connection with interests in associates are insignificant.<br />
PAGE 84 VIEW THE FULL REPORT AT ANNUALREPORT12.BAKKAVOR.COM
BAKKAVOR ANNUAL REPORT AND ACCOUNTS 2012<br />
notes to the consolidated financial statements<br />
continued<br />
26<br />
OBLIGATIONS UNDER FINANCE LEASES<br />
Minimum<br />
lease payments<br />
Present value of<br />
minimum lease payments<br />
29 December 31 December 29 December 31 December<br />
£m 2012 2011 2012 2011<br />
Amounts payable under finance leases:<br />
Within one year 0.1 0.9 0.1 0.8<br />
In the second to fifth years inclusive 0.3 2.3 0.3 1.8<br />
0.4 3.2 0.4 2.6<br />
Less: future finance charges – (0.6) – –<br />
Present value of lease obligations 0.4 2.6 0.4 2.6<br />
Analysed as:<br />
Amount due for settlement within 12 months (shown within current liabilities) 0.1 0.8<br />
Amount due for settlement after 12 months 0.3 1.8<br />
0.4 2.6<br />
It is the Group’s policy to lease certain fixtures and equipment under finance leases. The weighted average lease term outstanding is 2.8 years<br />
(2011: 4.5 years). For the 52 weeks ended 29 December 2012, the weighted average effective borrowing rate was 3.94% (2011: 4.20%). Interest rates<br />
are fixed at the contract date. All leases are on a fixed repayment basis and no arrangements have been entered into for contingent rental payments.<br />
Obligations are denominated in Euros amounting to £0.3 million (2011: £2.3 million) and Hong Kong dollars £0.1 million (2011: £0.1 million) and the fair<br />
value of the Group’s lease obligations approximates their carrying amount. In 2011, there was also £0.2 million of finance lease obligations denominated<br />
in Sterling which have now expired. The Group’s obligations under finance leases are secured by the lessors’ rights over the leased assets.<br />
27<br />
TRADE AND OTHER PAYABLES<br />
29 December 31 December<br />
£m 2012 2011<br />
Trade payables 190.6 197.1<br />
Social security and other taxation 2.0 3.2<br />
Deferred consideration 0.1 0.3<br />
Other payables 30.5 31.4<br />
Accruals 79.6 83.5<br />
302.8 315.5<br />
Less: amounts due after one year<br />
Deferred consideration – (0.1)<br />
Other payables (0.1) (0.2)<br />
Trade and other payables due within one year 302.7 315.2<br />
Trade payables and accruals principally comprise amounts outstanding for trade purchases and ongoing costs. The average credit period taken for<br />
trade purchases is 66 days (2011 – 60 days). No interest is incurred against trade payables.<br />
The Directors consider that the carrying amount of trade payables approximates to their fair value.<br />
The following table is an analysis of the Group’s trade payables by currency:<br />
29 December 31 December<br />
£m 2012 2011<br />
GBP 153.2 143.7<br />
USD 3.1 3.3<br />
Euro 28.5 43.6<br />
CZK 0.4 0.4<br />
ZAR 1.8 1.7<br />
RMB 3.2 3.4<br />
CAD 0.4 0.2<br />
HKD – 0.8<br />
190.6 197.1<br />
PAGE 85 VIEW THE FULL REPORT AT ANNUALREPORT12.BAKKAVOR.COM
BAKKAVOR ANNUAL REPORT AND ACCOUNTS 2012<br />
notes to the consolidated financial statements<br />
continued<br />
28<br />
PROVISIONS<br />
Onerous leases<br />
and other Dilapidation<br />
£m provisions provisions Total<br />
At 1 January 2011 6.6 7.9 14.5<br />
Increase of provision 3.0 – 3.0<br />
Release of provision (2.8) (1.1) (3.9)<br />
Utilisation of provision (2.0) – (2.0)<br />
Unwinding of discount 0.4 0.4 0.8<br />
At 31 December 2011 5.2 7.2 12.4<br />
Included in current liabilities 1.2 0.6 1.8<br />
Included in non-current liabilities 4.0 6.6 10.6<br />
At 31 December 2011 5.2 7.2 12.4<br />
Increase of provision 0.9 – 0.9<br />
Release of provision (0.8) – (0.8)<br />
Utilisation of provision (1.1) (0.4) (1.5)<br />
Unwinding of discount 0.3 0.5 0.8<br />
At 29 December 2012 4.5 7.3 11.8<br />
Included in current liabilities 0.9 – 0.9<br />
Included in non-current liabilities 3.6 7.3 10.9<br />
Onerous lease and other provisions include provisions related to unused premises. Of this, £4.5 million (2011: £5.2 million) relates to onerous leases<br />
and related costs that will be utilised over the term of the individual leases to which they relate.<br />
Releases of provisions relate to onerous leases that have been subsequently reviewed due to changing circumstances and adjustments to the<br />
ongoing provisions. The release of provisions follows the original treatment, which are released in administrative costs.<br />
Dilapidation provisions relate to obligations under various property leases to ensure that, at the end of the leases, the buildings are in the condition<br />
agreed with the landlords. The provisions will be utilised at the end of the individual lease terms to which they relate.<br />
29<br />
FINANCIAL INSTRUMENTS<br />
Capital risk management<br />
The Group manages its capital to ensure that entities in the Group will be able to continue as a going concern while maximising the return to<br />
stakeholders through the optimisation of debt and equity balance. The capital structure of the Group consists of borrowings as disclosed in note 23,<br />
cash and cash equivalents and equity attributable to owners of the parent, comprising issued capital, reserves and retained earnings.<br />
The Group manages its capital by collating timely and reliable information to produce various internal reports such as capital expenditure and weekly<br />
cash reports, which enable the Board of Directors to assess the Group’s capital, and manage that capital effectively and in line with the Group’s<br />
objectives. The gearing of the Group is constantly monitored and managed to ensure that the ratio between debt and equity is at an acceptable level<br />
and enables the Group to operate as a going concern and maximise stakeholders return.<br />
Gearing ratio<br />
The gearing ratio at the period end is as follows:<br />
29 December 31 December<br />
£m 2012 2011<br />
Debt 594.4 621.5<br />
Cash and cash equivalents (30.5) (30.1)<br />
Net debt 563.9 591.4<br />
Equity 308.9 301.3<br />
Net debt to net debt plus equity percentage 64.6% 66.2%<br />
Debt is defined as long and short term borrowings, as disclosed in note 23 and finance leases payable.<br />
PAGE 86 VIEW THE FULL REPORT AT ANNUALREPORT12.BAKKAVOR.COM
BAKKAVOR ANNUAL REPORT AND ACCOUNTS 2012<br />
notes to the consolidated financial statements<br />
continued<br />
29<br />
FINANCIAL INSTRUMENTS CONTINUED<br />
Externally imposed capital requirement<br />
The Group is subject to externally imposed capital requirements on capital expenditure as a result of bank covenants, which we have fully complied<br />
with throughout the period (see note 23, Borrowings).<br />
Significant accounting policies<br />
Details of the significant accounting policies and methods adopted, including the criteria for recognition, the basis of measurement and the basis on<br />
which income and expenses are recognised, in respect of each class of financial asset, financial liability and equity instrument are disclosed in note 2<br />
to the financial statements.<br />
Categories of Financial Instruments<br />
29 December 31 December<br />
£m 2012 2011<br />
Financial assets<br />
Fair value through profit and loss:<br />
Derivative financial instruments 0.6 0.4<br />
Loans and receivables at amortised cost:<br />
Trade receivables 158.4 161.6<br />
Deferred consideration 0.1 –<br />
Other receivables 13.1 10.7<br />
Cash and cash equivalents 30.5 30.1<br />
202.7 202.8<br />
Financial liabilities<br />
Fair value through profit and loss:<br />
Derivative financial instruments 10.1 17.9<br />
Other Financial liabilities at amortised cost:<br />
Trade payables 190.6 197.1<br />
Deferred consideration 0.1 0.3<br />
Other payables 30.5 31.4<br />
Borrowings 594.0 618.9<br />
Finance leases 0.4 2.6<br />
825.7 868.2<br />
The fair value of the financial assets approximates to their carrying value due to the short term nature of the receivables. Fair values have been<br />
determined as level 2 under IFRS 7.<br />
The fair value of other financial liabilities at amortised cost approximates to their carrying value. The trade and other payables approximate to their<br />
fair value due to the short term nature of the payables. The finance lease fair value approximates to the carrying value based on discounted future<br />
cash flows.<br />
Financial risk management<br />
The Group is exposed to a number of financial risks such as access to and cost of funding, interest rate exposure, currency exposure and working<br />
capital management. The Group seeks to minimise these risks where possible and does this by constantly monitoring, reviewing, effectively<br />
managing and using derivative financial instruments as detailed in the Directors’ report. Use of financial instruments is governed by Group policies<br />
which are approved by the Board of Directors. The treasury function does not operate as a profit centre, makes no speculative transactions and only<br />
enters into or trades financial instruments to manage specific exposures.<br />
To ensure the management of those financial risks faced by the Group remain effective, it is very important that any new businesses that are<br />
acquired by the Group are immediately integrated. This means the new business is providing timely and accurate information to the central Treasury<br />
department, so they can produce group reports on key financial risks that reflect the ultimate position of the Group at that time.<br />
Further details on financial risks are provided within the Our Risks section on page 49 and 50.<br />
PAGE 87 VIEW THE FULL REPORT AT ANNUALREPORT12.BAKKAVOR.COM
BAKKAVOR ANNUAL REPORT AND ACCOUNTS 2012<br />
notes to the consolidated financial statements<br />
continued<br />
29<br />
FINANCIAL INSTRUMENTS CONTINUED<br />
Market risk<br />
The Group’s activities expose it primarily to the financial risks of changes in foreign currency exchange rates and interest rates. The Group enters into<br />
a variety of derivative financial instruments to manage its exposure to interest rate and foreign currency risk, including:<br />
• Forward foreign exchange contracts to hedge the exchange rate risk arising on revenues and purchases in foreign currencies.<br />
• Interest rate swaps to mitigate the risk of rising interest rates.<br />
Market risk exposures are supplemented by sensitivity analysis. There has been no change to the Group’s exposure to market risks or the manner in<br />
which it manages and measures the risk.<br />
Foreign currency risk management<br />
Foreign currency risk management occurs at a transactional level on revenues and purchases in foreign currencies and at a translational level in<br />
relation to the translation of overseas operations. Board policy is for Group Treasury to hedge a rolling 12 month forecast of transactional exposures<br />
using forward foreign exchange contracts and foreign exchange options. The Group monitors foreign exchange rates to assess the potential impact on<br />
group profits if exchange rates move significantly and a summary of hedges in place are reported monthly to the Board of Directors.<br />
The Group’s main foreign exchange risk is to the Euro and US dollar.<br />
During the 52 week period to 29 December 2012, the Euro weakened against Sterling by 2.1%, with the closing rate at €1.2219 compared to<br />
€1.1972 at the prior period end. The average rate for the 52 week period to 29 December 2012 was €1.2335, a weakening of the Euro of 7.0%<br />
versus prior year.<br />
In the same period the US dollar, weakened against Sterling by 4.0%, with the closing rate at $1.6155 compared to $1.5541 at the prior period end.<br />
The average rate for the period to 29 December 2012 was $1.5851, a 1.2% strengthening of the US dollar versus the prior year.<br />
The net foreign exchange impact on profit from transactions is a gain of £0.4 million (2011: loss of £0.3 million).<br />
Foreign currency sensitivity analysis<br />
A sensitivity analysis has been performed on the financial assets and liabilities to a sensitivity of 10% increase/decrease in the exchange rates.<br />
A 10% increase/decrease has been used, and represents management’s assessment of the reasonably possible change in foreign exchange rates.<br />
The sensitivity analysis includes only outstanding foreign currency denominated monetary items and adjusts their translation at the period end for a<br />
10% change in foreign currency rates. The sensitivity analysis includes external loans as well as loans to foreign operations within the Group where<br />
the denomination of the loan is in a currency other than the currency of the lender or the borrower. A positive number below indicates an increase in<br />
profit where Sterling strengthens 10% against the relevant currency.<br />
Profit or (loss)<br />
Profit or (loss)<br />
10% Strengthening 10% Weakening<br />
29 December 31 December 29 December 31 December<br />
£m 2012 2011 2012 2011<br />
Euro (1.4) (1.1) 1.8 1.2<br />
USD (1.3) (1.0) 1.6 1.1<br />
RMB (0.1) 0.1 0.1 (0.1)<br />
ZAR (0.2) (0.2) 0.2 0.2<br />
PAGE 88 VIEW THE FULL REPORT AT ANNUALREPORT12.BAKKAVOR.COM
BAKKAVOR ANNUAL REPORT AND ACCOUNTS 2012<br />
notes to the consolidated financial statements<br />
continued<br />
29<br />
FINANCIAL INSTRUMENTS CONTINUED<br />
Foreign currency risk management continued<br />
Forward foreign exchange contracts<br />
It is the policy of the Group to enter into forward foreign exchange contracts to cover specific foreign currency payments and receipts. The Group<br />
also enters into forward foreign exchange contracts to manage the risk associated with anticipated sales and purchase transactions to minimise the<br />
exposure generated.<br />
The following table details the Sterling forward foreign currency contracts outstanding as at 29 December 2012:<br />
Average Foreign Contract Fair<br />
exchange currency value value<br />
rate (m) (£m) (£m)<br />
Outstanding contracts 2012 2011 2012 2011 2012 2011 2012 2011<br />
Buy Euros:<br />
Less than 3 months 1.24 1.16 26.0 16.4 21.0 14.2 0.2 (0.5)<br />
3 to 6 months 1.25 1.17 12.0 16.5 9.6 14.2 0.1 (0.3)<br />
6 to 12 months 1.25 1.17 3.5 9.0 2.8 7.7 – (0.1)<br />
Buy US Dollars:<br />
Less than 3 months 1.59 1.56 2.9 6.8 1.8 5.9 (0.1) (0.1)<br />
3 to 6 months 1.59 1.59 1.1 2.0 0.7 1.2 – 0.1<br />
6 to 12 months 1.59 1.58 1.5 1.4 1.0 0.9 – –<br />
36.9 44.1 0.2 (0.9)<br />
The following table details the Euro forward foreign currency contracts outstanding as at 29 December 2012:<br />
Average Foreign Contract Fair Fair<br />
exchange currency value value value<br />
rate (m) (€m) (€m) (£m)<br />
Outstanding contracts 2012 2011 2012 2011 2012 2011 2012 2011 2012 2011<br />
Buy US Dollars:<br />
Less than 3 months – 1.37 – 0.5 – 0.4 – – – –<br />
3 to 6 months 1.26 – 1.6 – 2.0 – 0.1 – – –<br />
6 to 12 months 1.25 1.38 6.4 10.4 8.0 7.5 0.3 (0.5) 0.3 (0.5)<br />
10.0 7.9 0.4 (0.5) 0.3 (0.5)<br />
The following table details the South African Rand (ZAR) forward foreign currency contracts outstanding as at 29 December 2012:<br />
Average Foreign Contract Fair Fair<br />
exchange currency value value value<br />
rate (m) (ZARm) (ZARm) (£m)<br />
Outstanding contracts 2012 2011 2012 2011 2012 2011 2012 2011 2012 2011<br />
Buy Sterling:<br />
Less than 3 months 13.04 12.72 0.2 0.2 2.0 2.8 (2.8) (1.6) (0.2) (0.1)<br />
3 to 6 months 13.68 12.93 0.2 0.1 3.0 1.0 (2.8) (0.4) (0.2) (0.1)<br />
6 to 12 months 13.63 – 0.2 – 2.5 – (2.0) – (0.1) –<br />
7.5 3.8 (7.6) (2.0) (0.5) (0.2)<br />
Interest rate risk management<br />
The Group is exposed to interest rate risk on borrowings. The risk is managed by maintaining an appropriate mix between fixed and floating rate<br />
borrowings. Interest rate risk management balances debt financing as a tool to improve the returns through leverage in the capital structure with the<br />
potential for an increase in interest rates to impact profits negatively. The Group also uses derivative financial instruments such as interest rate swaps<br />
to minimise the risk associated with variable interest rates. As a result of this policy, at the year end 8.4% of the Group’s borrowings were covered by<br />
interest rate swaps and collars (2011: 48%). The Group has in issue £350 million of 8.25% fixed rate Senior Secured Notes that are listed on the Irish<br />
Stock Exchange (see note 23). Board approval is required for the use of any interest rate derivative. Further information on interest rate risk is provided<br />
in the Our Risks section on page 49 and 50.<br />
PAGE 89 VIEW THE FULL REPORT AT ANNUALREPORT12.BAKKAVOR.COM
BAKKAVOR ANNUAL REPORT AND ACCOUNTS 2012<br />
notes to the consolidated financial statements<br />
continued<br />
29<br />
FINANCIAL INSTRUMENTS CONTINUED<br />
Interest rate risk management continued<br />
Interest rate sensitivity analysis<br />
Interest rate sensitivity analysis has been performed on the financial assets and liabilities to illustrate the impact on Group profits and equity if interest<br />
rates increased/decreased. This analysis assumes the liabilities outstanding at the period end were outstanding for the whole period. A 100 basis<br />
points increase or decrease has been used, comprising management’s assessment of reasonably possible changes in interest rates.<br />
Profit/(loss) Profit/(loss)<br />
29 December 31 December<br />
£m 2012 2011<br />
Effects of 100 basis points increase in interest rate (1.9) (0.7)<br />
Effects of 100 basis points decrease in interest rate 1.9 0.7<br />
It is assumed that all other variables remained the same when preparing the interest rate sensitivity analysis.<br />
Interest rate swaps<br />
Under interest rate swap contracts, the Group agrees to exchange the difference between fixed and floating rate interest amounts calculated on<br />
agreed notional principal amounts. Such contracts enable the Group to mitigate the risk of changing interest rates on the fair value of issued fixed<br />
rate borrowings held and the cash flow exposures on the issued variable rate borrowings held. The fair value of interest rate swaps at the reporting<br />
date is determined by discounting the future cash flows using the yield curves at the reporting date and the credit risk inherent in the contract, and is<br />
disclosed below. The average interest rate is based on the outstanding balances at the end of the financial year.<br />
The following table details the notional principal amounts and remaining terms of interest rate swap contracts and collars outstanding as at<br />
29 December 2012:<br />
Average contract fixed<br />
Notional<br />
interest rate principal amount Fair value<br />
2012 2011 2012 2011 2012 2011<br />
% % £m £m £m £m<br />
Interest rate swaps<br />
0 to 1 years – 5.03 – 150.0 – (4.4)<br />
1 to 5 years 4.90 – 50.0 – (9.5) –<br />
Over 5 years – 4.90 – 50.0 – (9.9)<br />
Collars<br />
0 to 1 years – 4.37 – 100.0 – (1.6)<br />
50.0 300.0 (9.5) (15.9)<br />
The interest rate swaps settle on a quarterly basis. The floating rate on the interest rate swaps is 3 months LIBOR. The Group will settle the difference<br />
between fixed and floating interest rates on a net basis.<br />
Credit risk management<br />
Credit risk refers to the risk of financial loss to the Group if a counterparty defaults on its contractual obligations of the loans and receivables at<br />
amortised cost held in the balance sheet.<br />
The Group’s main credit risk is attributable to its trade receivables. The Group’s top five customers, all leading UK retailers, continue to represent more<br />
than 80% (2011: 80%) of the Group’s revenue. These customers hold fav<strong>our</strong>able credit ratings and consequently reduce the credit risk for the Group’s<br />
overall trade receivables.<br />
The credit risk on liquid funds and derivative financial instruments is limited because the counterparties are banks with good credit ratings assigned by<br />
international credit rating agencies. Group policy dictates that Group deposits are shared between banks to spread the risk. Currently Group deposits<br />
are shared between banks that are counterparties in the Group’s secured committed bank facilities. <strong>Bakkavor</strong> Finance (2) plc current bank credit limit<br />
consists of a £260 million Term loan, of which £25 million has been repaid and a £90 million RCF facility, through a bank syndicate. Barclays Capital is<br />
the syndicate agent of this facility and they manage the syndicate and participation with other counterparties.<br />
Processes are in place to manage receivables and overdue debt and to ensure that appropriate action is taken to resolve issues on a timely basis.<br />
Credit control operating procedures are in place to review all new customers. Existing customers are reviewed as management become aware of<br />
changes of circumstances for specific customers. The amounts presented in the statement of financial position are net of appropriate allowance for<br />
doubtful trade receivables, specific customer risk and assessment of the current economic environment. The carrying amount of financial assets<br />
recorded in the financial statements, which is net of impairment losses, represents the Group’s maximum exposure to credit risk.<br />
PAGE 90 VIEW THE FULL REPORT AT ANNUALREPORT12.BAKKAVOR.COM
BAKKAVOR ANNUAL REPORT AND ACCOUNTS 2012<br />
notes to the consolidated financial statements<br />
continued<br />
29<br />
FINANCIAL INSTRUMENTS CONTINUED<br />
Commodity risk management<br />
The Group acquires substantial amounts of raw materials for its operations, including dairy, wheat and rapeseed oil. The Group is exposed to<br />
commodity price and supply risks for these raw materials. The Group takes actions to reduce overall material costs and exposure to price fluctuations.<br />
This is done in a number of ways. For example, the Group buys raw materials from suppliers all over the world, thereby decreasing geographic risk<br />
and frequently tenders to benchmark market prices. In general <strong>our</strong> requirements are managed using contracts for periods of between three to twelve<br />
months forward. The Group also manage any local currency exposure in line with agreed contracts.<br />
Liquidity risk management<br />
Liquidity risk refers to the risk that the Group may not be able to fund the day to day running of the Group. Liquidity risk is reviewed by the Board of<br />
Directors on a monthly basis. The Group manages liquidity risk by monitoring actual and forecast cash flows and matching the maturity profiles of<br />
financial assets and liabilities. The Group also monitors the drawdown of borrowings against the available banking facilities and reviews the level of<br />
reserves. Liquidity risk management ensures sufficient borrowings funding is available for the Group’s day to day needs. Board policy is to maintain<br />
reasonable headroom of unused committed bank facilities in a range of maturities at least 12 months beyond the period end.<br />
Maturity profile of financial liabilities<br />
The following table illustrates the Group’s remaining contractual maturity for its financial liabilities when they fall due.<br />
29 December 31 December<br />
£m 2012 2011<br />
Due within one year:<br />
Trade payables 190.6 197.1<br />
Deferred consideration 0.1 0.2<br />
Other payables 30.5 31.2<br />
Derivative financial instruments 10.1 17.9<br />
Borrowings 21.0 19.5<br />
Finance leases 0.1 0.9<br />
Interest on borrowings 57.7 65.6<br />
Total due within one year 310.1 332.4<br />
In the second to fifth years inclusive:<br />
Other payables 0.1 0.2<br />
Deferred consideration – 0.1<br />
Borrowings 220.9 247.6<br />
Finance leases 0.3 2.3<br />
Interest on borrowings 126.0 136.2<br />
Total due in the second to fifth years 347.3 386.4<br />
Due after five years:<br />
Borrowings 350.0 350.0<br />
Interest on borrowings 13.8 43.2<br />
Total due after five years 363.8 393.2<br />
The weighted average interest rates for the Group’s borrowings are found in note 23 and in note 26 for Finance leases.<br />
PAGE 91 VIEW THE FULL REPORT AT ANNUALREPORT12.BAKKAVOR.COM
BAKKAVOR ANNUAL REPORT AND ACCOUNTS 2012<br />
notes to the consolidated financial statements<br />
continued<br />
30Issued and fully paid:<br />
55,258 (2011: 53,258) Ordinary shares of £1 each 0.1 0.1<br />
SHARE CAPITAL AND RESERVES<br />
Share capital<br />
29 December 31 December<br />
£m 2012 2011<br />
Shares issued in the period:<br />
2,000 (2011: 53,258) Ordinary shares of £1 each – –<br />
During the period, the Company has issued £2,000 of share capital. The share issues were made in September and December 2012, each amounting<br />
to £1,000. The proceeds from the share issue have been used to repay bank borrowings during the period.<br />
Share premium<br />
As a result of the share issue, £4,605,427 and £8,201,142 of share premium was created in September and December 2012 respectively. The<br />
proceeds from the share issue have been used to repay bank borrowings during the period. In the prior period, £302.4 million of share premium was<br />
created of which £96.6 million was in relation to the acquisition of <strong>Bakkavor</strong> Finance (3) Limited and £205.8 million a related party loan, which was<br />
capitalised.<br />
Merger reserve<br />
The incorporation of <strong>Bakkavor</strong> Finance (2) plc as an intermediate holding Company of the Group in 2011 was accounted for using the principles of<br />
merger accounting.<br />
Capital reserve<br />
The capital reserve of £4.0 million arose in 2009 following the capitalisation of an inter-Company balance between <strong>Bakkavor</strong> London Limited and<br />
<strong>Bakkavor</strong> Group ehf.<br />
Translation reserve<br />
The translation reserve represents foreign exchange rate differences arising on the consolidation of the Group’s foreign operations. The assets and<br />
liabilities of the Group’s foreign operations are translated at exchange rates prevailing on the balance sheet date. Income and expense items are<br />
translated at the average exchange rates for the period. Exchange differences arising, if any, are recognised in the translation reserve.<br />
31<br />
DISPOSAL OF SUBSIDIARIES<br />
In February 2012, the Group received a final payment of £0.1 million relating to the disposal of <strong>Bakkavor</strong> Traiteur SAS on 7 September 2011.<br />
In March 2012, Creative Foods a 100% owned subsidiary of <strong>Bakkavor</strong> Finance (2) plc based in China, disposed of its 80% interest in Yantai<br />
Longshun Foods for a cash consideration of RMB 16.0 million (£1.5 million), of which RMB 1.0 million (£0.1 million) is outstanding at 29 December<br />
2012. This transaction resulted in a profit on disposal of £0.3 million being recorded in the income statement. Cash of £0.1 million was disposed of<br />
with the business.<br />
2011<br />
On 7 September 2011 the Group disposed of its interest in <strong>Bakkavor</strong> Traiteur SAS for a cash consideration of €1.9 million (£1.6 million), resulting in a<br />
loss on disposal of £1.0 million, net of £0.1 million of disposal costs. The loss on disposal includes £0.4 million of foreign currency translation gains<br />
recycled from the translation reserve to the income statement on disposal.<br />
The net effect of the disposal was as follows:<br />
£m<br />
Net assets 2.9<br />
Disposal costs 0.1<br />
Recycle net foreign exchange gains (0.4)<br />
Loss on disposal (1.0)<br />
Total consideration 1.6<br />
PAGE 92 VIEW THE FULL REPORT AT ANNUALREPORT12.BAKKAVOR.COM
BAKKAVOR ANNUAL REPORT AND ACCOUNTS 2012<br />
notes to the consolidated financial statements<br />
continued<br />
32<br />
The net effect of the transaction was as follows:<br />
£m<br />
Carrying value of 35% investment in English Village Salads 0.3<br />
Cost of additional 35% investment in English Village Salads –<br />
Amount recognised within equity attributable to equity holders of the parent 0.3<br />
ACQUISITION OF BUSINESSES<br />
On 31 March 2012 the Group acquired the remaining 35% of English Village Salads Limited to increase the Group’s ownership to 100% for a total<br />
cash consideration of £40,000, prior to the closure of the business. This transaction has been accounted for as an equity transaction as the Group has<br />
increased its stake in an existing subsidiary without any changes in control.<br />
2011<br />
On 21 December 2011 the Group acquired 52% of Gastro Primo Limited in Hong Kong, to increase its ownership to 100%, for a cash consideration<br />
of US$1.0 million (£0.6 million) and deferred consideration of US$0.4 million (£0.3 million). Gastro Primo held £0.4 million of cash at the date of<br />
acquisition. This has resulted in goodwill of £1.2 million being recognised and also a loss on disposal of an associate of £1.6 million being recorded in<br />
the income statement.<br />
The net effect of the acquisition was as follows:<br />
£m<br />
Fair value of 100% of Gastro Primo 1.7<br />
Book value and fair value of net assets acquired (0.5)<br />
Goodwill on acquisition 1.2<br />
The loss on disposal of an associate was as follows:<br />
£m<br />
Carrying value of original 48% investment in Gastro Primo 2.4<br />
Fair value of 48% investment in Gastro Primo 0.8<br />
Loss on disposal of an associate (1.6)<br />
On 3 November 2011 the Group acquired the remaining 20% of <strong>Bakkavor</strong> China Limited that it did not own for a cash consideration of US$30,000,<br />
which resulted in the recognition of £0.8 million negative goodwill. This negative goodwill was recognised in the income statement.<br />
PAGE 93 VIEW THE FULL REPORT AT ANNUALREPORT12.BAKKAVOR.COM
BAKKAVOR ANNUAL REPORT AND ACCOUNTS 2012<br />
notes to the consolidated financial statements<br />
continued<br />
33<br />
NOTES TO THE STATEMENT OF CASH FLOWS<br />
29 December 31 December<br />
£m 2012 2011<br />
Operating profit/(loss) – continuing operations 56.8 (2.8)<br />
– discontinued operations 1.9 (15.5)<br />
58.7 (18.3)<br />
Adjustments for:<br />
Share of results of associates (0.9) (1.1)<br />
Depreciation of property, plant and equipment 42.6 43.9<br />
Amortisation of intangible assets 8.7 9.4<br />
Loss on disposal of property, plant and equipment 1.3 0.3<br />
(Profit)/loss on disposal of subsidiary (note 31) (0.4) 1.0<br />
Loss on disposal of associate (note 32) – 1.6<br />
Impairment of assets 1.0 76.9<br />
Net retirement benefits charge less contributions (4.6) (16.4)<br />
Operating cash flows before movements in working capital 106.4 97.3<br />
Increase in inventories (2.2) (5.9)<br />
(Increase)/decrease in receivables (10.8) 0.5<br />
Increase in payables 11.9 13.3<br />
(Decrease)/increase in exceptional creditor (1.6) 1.5<br />
Decrease in provisions (1.5) (3.0)<br />
Cash generated by operations 102.2 103.7<br />
Income taxes paid (1.0) (3.4)<br />
Interest paid (60.5) (64.5)<br />
Net cash from operating activities 40.7 35.8<br />
34<br />
CONTINGENT LIABILITIES AND COMMITMENTS<br />
The Group may from time to time, and in the normal c<strong>our</strong>se of business, be subject to claims from customers and counterparties. The Group regularly<br />
reviews all of these claims to determine any possible financial loss to the Group. No provision was considered necessary in the consolidated financial<br />
statements. In addition, there are a number of legal claims or potential claims against the Group, the outcome of which cannot at present be foreseen.<br />
Provision has been made for all probable liabilities.<br />
As at 29 December 2012 the Group had purchase commitments for the next 12 months to guarantee supply and price of raw materials of<br />
£117.5 million (2011: £51.6 million).<br />
PAGE 94 VIEW THE FULL REPORT AT ANNUALREPORT12.BAKKAVOR.COM
BAKKAVOR ANNUAL REPORT AND ACCOUNTS 2012<br />
notes to the consolidated financial statements<br />
continued<br />
35<br />
OPERATING LEASE ARRANGEMENTS<br />
The Group as lessee<br />
52 weeks 52 weeks<br />
ended ended<br />
29 December 31 December<br />
£m 2012 2011<br />
Continuing operations<br />
Minimum lease payments under operating leases recognised as an expense in the period 10.8 9.6<br />
Discontinued operations<br />
Minimum lease payments under operating leases recognised as an expense in the period 0.7 0.8<br />
At the statement of financial position date, the Group had outstanding commitments for future minimum lease payments under non-cancellable<br />
operating leases, which fall due as follows:<br />
Land and buildings<br />
Other<br />
29 December 31 December 29 December 31 December<br />
£m 2012 2011 2012 2011<br />
Operating leases which expire:<br />
Within one year 6.1 6.1 4.3 3.9<br />
Within two to five years 23.8 20.3 6.4 5.6<br />
After five years 42.2 44.7 2.1 –<br />
72.1 71.1 12.8 9.5<br />
The Group leases various offices and operational facilities under non-cancellable operating lease arrangements. The leases have various terms,<br />
escalation clauses and renewal rights. The Group also leases plant and machinery under non-cancellable operating lease agreements.<br />
36<br />
RETIREMENT BENEFIT SCHEMES<br />
The Group operates a number of pension schemes in the UK and overseas. These schemes are either trust or contract based and have been set up in<br />
accordance with appropriate legislation. The assets of each of the pension schemes are held separately from the assets of the Company.<br />
In the UK, the two main schemes are a defined contribution scheme which is open to all UK employees joining the Group (full or part time) and the<br />
other a funded defined benefit scheme which was closed for future accrual in March 2011.<br />
Pension (credits)/costs charged in arriving at profit on ordinary activities before taxation were:<br />
52 weeks 52 weeks<br />
ended ended<br />
29 December 31 December<br />
£m 2012 2011<br />
UK defined benefit scheme net credit (1.8) (1.6)<br />
UK defined benefit scheme exceptional credit – (12.0)<br />
UK defined contribution scheme net charge 4.3 3.2<br />
Overseas net charge 0.3 0.3<br />
Total charge/(credit) 2.8 (10.1)<br />
During the prior period, an exceptional credit arose due to the defined benefit scheme closing to future accrual in March 2011.<br />
Defined contribution schemes<br />
The total cost charged to income of £4.6 million (2011: £3.5 million) represents contributions payable to these schemes by the Group at rates specified<br />
in the rules of the plans. No amounts were owing at the period end for the defined contribution schemes (2011: £nil)<br />
PAGE 95 VIEW THE FULL REPORT AT ANNUALREPORT12.BAKKAVOR.COM
BAKKAVOR ANNUAL REPORT AND ACCOUNTS 2012<br />
notes to the consolidated financial statements<br />
continued<br />
36<br />
RETIREMENT BENEFIT SCHEMES CONTINUED<br />
Defined benefit schemes<br />
A full actuarial valuation of plan assets and the present value of the defined benefit obligation for funding purposes was carried out at 31 March 2010<br />
and was updated for IAS 19 purposes to 29 December 2012 by a qualified independent actuary. The projected unit cost method was used to value the<br />
liabilities and was conducted by a qualified independent actuary with Towers Watson Limited.<br />
The major assumptions used in this IAS 19 valuation were:<br />
29 December 31 December<br />
2012 2011<br />
Expected rate of salary increases – –<br />
Future pension increases 2.90% 2.95%<br />
Expected return on scheme assets 5.80% 6.25%<br />
Discount rate applied to scheme liabilities 4.60% 5.00%<br />
Inflation assumption (CPI) 1.95% 2.00%<br />
The mortality table is based on scheme specific postcode fitted SAPS tables with a 102% multiplier for male members and 108% multiplier for female<br />
members. Long cohort improvements are applied from 2002 to 2010. Future improvements are in line with CMIB improvements with a 1.0% pa long<br />
term trend, giving life expectancies as follows:<br />
Males expected Males expected Females expected Females expected<br />
future lifetime future lifetime future lifetime future lifetime<br />
2012 2011 2012 2011<br />
Member aged 45 in 2010 41.7 41.6 44.0 43.9<br />
Member aged 65 in 2010 22.2 22.1 24.1 24.1<br />
The sensitivities regarding the principal assumptions used to measure the scheme liabilities are set out below:<br />
Approximate impact<br />
Assumption Change in assumption on scheme liabilities<br />
Discount rate Increase/decrease by 0.1% Decrease/increase by 1.5% – 2.0%<br />
Rate of inflation Increase/decrease by 0.1% Increase/decrease by 0.5% – 1.5%<br />
Rate of salary growth N/A N/A<br />
Rate of mortality Increase by 1 year Increase by 3%<br />
Amounts recognised in income in respect of these defined benefit schemes are as follows:<br />
52 weeks 52 weeks<br />
ended ended<br />
29 December 31 December<br />
£m 2012 2011<br />
Current service cost – (1.1)<br />
Interest cost (7.9) (9.0)<br />
Expected return on scheme assets 9.7 11.7<br />
Gain from curtailments – 12.0<br />
Total credit 1.8 13.6<br />
All of the credits for each period presented have been included in total administrative expenses, except for the gain from curtailments recorded in<br />
2011, which is shown within exceptional items. Actuarial gains and losses have been reported in other comprehensive income. At 31 March 2011 the<br />
scheme closed to future accrual and this has been allowed for in the liability calculations. The closure of the scheme led to a £12.0 million credit to the<br />
income statement in the prior period and is disclosed within exceptional items.<br />
The actual return on scheme assets was a £18.4 million gain (2011: £4.8 million loss).<br />
Cumulative amount of actuarial gains and losses recognised in other comprehensive income since the date of IFRS transition is £49.1 million loss<br />
(2011: £45.2 million loss).<br />
PAGE 96 VIEW THE FULL REPORT AT ANNUALREPORT12.BAKKAVOR.COM
BAKKAVOR ANNUAL REPORT AND ACCOUNTS 2012<br />
notes to the consolidated financial statements<br />
continued<br />
36<br />
RETIREMENT BENEFIT SCHEMES CONTINUED<br />
The amount included in the statement of financial position arising from the Group’s obligations in respect of its defined benefit retirement benefit<br />
schemes is as follows:<br />
29 December 31 December<br />
£m 2012 2011<br />
Fair value of scheme assets 185.8 170.6<br />
Present value of defined benefit obligations (175.8) (161.3)<br />
Surplus in scheme 10.0 9.3<br />
Related deferred taxation liability (2.3) (2.3)<br />
7.7 7.0<br />
The assumptions used by the actuary are the best estimates chosen from a range of possible actuarial assumptions which, due to the timescale<br />
covered, may not necessarily be borne out in practice.<br />
Movements in the present value of defined benefit obligations were as follows:<br />
29 December 31 December<br />
£m 2012 2011<br />
Opening balance (161.3) (167.9)<br />
Current service cost – (1.1)<br />
Interest cost (7.9) (9.0)<br />
Contributions from scheme members – (0.8)<br />
Benefits paid 6.0 7.9<br />
Loss on change of assumptions (12.6) (1.5)<br />
Experience loss – (0.9)<br />
Gain from curtailments – 12.0<br />
Closing balance (175.8) (161.3)<br />
Movements in the fair value of scheme assets were as follows:<br />
29 December 31 December<br />
£m 2012 2011<br />
Opening balance 170.6 179.7<br />
Expected return on scheme assets 9.7 11.7<br />
Experience gain/(loss) 8.7 (16.5)<br />
Contributions from the sponsoring Companies 2.8 2.8<br />
Contributions from scheme members – 0.8<br />
Benefits paid (6.0) (7.9)<br />
Closing balance 185.8 170.6<br />
PAGE 97 VIEW THE FULL REPORT AT ANNUALREPORT12.BAKKAVOR.COM
BAKKAVOR ANNUAL REPORT AND ACCOUNTS 2012<br />
notes to the consolidated financial statements<br />
continued<br />
36<br />
RETIREMENT BENEFIT SCHEMES CONTINUED<br />
The analysis of the scheme assets and the expected rate of return at the statement of financial position date was as follows:<br />
Expected return<br />
Fair value of assets<br />
29 December 31 December 29 December 31 December<br />
2012 2011 2012 2011<br />
% % £m £m<br />
UK equities 7.15 6.90 61.8 56.2<br />
Overseas equities 7.15 6.90 24.0 57.5<br />
Corporate bonds 3.60 4.20 37.3 35.9<br />
High yield bonds 4.75 – 42.2 –<br />
UK government bonds 2.30 2.50 12.4 12.0<br />
Property 5.30 5.60 7.2 8.7<br />
Cash – – 0.9 0.3<br />
185.8 170.6<br />
29 December 31 December 1 January 2 January 27 December<br />
£m 2012 2011 2011 2010 2008<br />
Fair value of scheme assets 185.8 170.6 179.7 156.4 127.9<br />
Present value of defined benefit obligations (175.8) (161.3) (167.9) (169.6) (127.5)<br />
Surplus/(deficit) in the scheme 10.0 9.3 11.8 (13.2) 0.4<br />
Experience (losses)/gains adjustments on scheme liabilities:<br />
Amount – (0.9) (5.6) 3.5 4.9<br />
Percentage of scheme liabilities (%) – (0.56) (3.34) 2.06 3.84<br />
Experience gains/(losses) on scheme assets:<br />
Amount 8.7 (16.5) 12.8 21.6 (51.3)<br />
Percentage of scheme assets (%) 4.68 (9.67) 7.12 13.81 (40.11)<br />
The actual amount of contributions expected to be paid to the pension scheme during 2013 is £4.2 million. Employer contributions, except for deficit<br />
reduction contributions, ceased in March 2011 when the scheme closed to future accrual.<br />
The next triennial valuation is scheduled to be carried out as at 31 March 2013.<br />
The deficit reduction contributions have been agreed between the Group and the trustees. These are paid over a five year recovery period ending on<br />
31 March 2016. The recovery contributions are paid monthly and the agreed rates were £2 million in the first year, £3 million in the second year and<br />
£4.5 million in the following three years.<br />
The Group estimate the scheme liabilities on average fall due over 20 years.<br />
The Trustees currently adopt a policy of 70% return seeking assets (equities) and 30% liability matching assets (bonds/property) which will be<br />
reviewed periodically. A review of the investment strategy is currently underway following the closure of the scheme to future accrual.<br />
The Group and the Trustees work closely together in matters concerning the <strong>Bakkavor</strong> Pension Scheme. Regular meetings and correspondence<br />
on matters concerning the scheme are shared in an open manner between both parties.<br />
PAGE 98 VIEW THE FULL REPORT AT ANNUALREPORT12.BAKKAVOR.COM
BAKKAVOR ANNUAL REPORT AND ACCOUNTS 2012<br />
notes to the consolidated financial statements<br />
continued<br />
37<br />
RELATED PARTY TRANSACTIONS<br />
Transactions between the Company and its subsidiaries, which are related parties, have been eliminated on consolidation and are not disclosed in this<br />
note. Transactions between the Group and its associates are disclosed below. Transactions between the Company and its subsidiaries and associates<br />
are disclosed in the Company’s separate financial statements.<br />
Trading transactions<br />
During the period, Group companies entered into the following transactions with related parties who are not members of the Group:<br />
<strong>Bakkavor</strong> Group<br />
management<br />
Sale of goods Purchase of goods Interest charge charge<br />
£m 2012 2011 2012 2011 2012 2011 2012 2011<br />
Associates – 0.2 – 0.1 – – – –<br />
<strong>Bakkavor</strong> Group ehf. – – – – – 0.7 0.5 1.2<br />
Amounts owed from Amounts owed to<br />
related parties<br />
related parties<br />
£m 2012 2011 2012 2011<br />
<strong>Bakkavor</strong> Group ehf. 0.1 – 0.1 0.1<br />
Associates – – – 0.3<br />
The amount owed from <strong>Bakkavor</strong> Group ehf of £0.1 million (2011: £0.1 million) is included within the current assets section under Trade and other<br />
receivables. Amounts owed to <strong>Bakkavor</strong> Group ehf of £0.1 million (2011: £0.1 million) are included in the current liabilities section within Trade and<br />
other payables.<br />
Loans between the Group and related parties are all based on varying terms of interest. Related party loans are repayable between one and five years<br />
and incur interest based on the three month libor rate plus 3%.<br />
The amounts outstanding are unsecured. No guarantees have been given or received. No provisions have been made for doubtful debts in respect of<br />
the amounts owed by related parties.<br />
Remuneration of key management personnel<br />
The remuneration of the Directors and senior management, who are the key management personnel of the Company, is set out below in aggregate<br />
for each of the categories specified in IAS 24 Related Party Disclosures.<br />
29 December 31 December<br />
£m 2012 2011<br />
Short-term employee benefits 5.5 6.1<br />
Post – employment benefits 0.4 0.7<br />
5.9 6.8<br />
38<br />
39<br />
EVENTS AFTER THE STATEMENT OF FINANCIAL POSITION DATE<br />
There were no significant events after the statement of financial position date.<br />
CONTROLLING PARTY<br />
On 27 September 2012, <strong>Bakkavor</strong> Group Limited (formerly <strong>Bakkavor</strong> Holdings Limited) became the parent company of the <strong>Bakkavor</strong> Group following<br />
a shareholder meeting of <strong>Bakkavor</strong> Group ehf (EHF) where it was agreed to implement a decrease in the share capital of EHF and to effect the<br />
distribution of EHF’s shares in <strong>Bakkavor</strong> Group Limited to EHF’s shareholders.<br />
The company name of <strong>Bakkavor</strong> Holdings Limited was formally changed to <strong>Bakkavor</strong> Group Limited to reflect its status as parent of the <strong>Bakkavor</strong><br />
Group.<br />
The Company’s ultimate parent company and ultimate controlling party is <strong>Bakkavor</strong> Group Limited, a Company registered in the United Kingdom.<br />
The largest Group in which the results of the Group are consolidated is that headed by <strong>Bakkavor</strong> Group Limited. It has included this Group in its group<br />
financial statements, copies of which are available from West Marsh Road, Spalding, Lincolnshire, PE11 2BB, United Kingdom.<br />
The Company’s immediate parent Company is <strong>Bakkavor</strong> Finance (1) Limited.<br />
PAGE 99 VIEW THE FULL REPORT AT ANNUALREPORT12.BAKKAVOR.COM
BAKKAVOR ANNUAL REPORT AND ACCOUNTS 2012<br />
company income statement<br />
52 WEEKS ENDED 29 DECEMBER 2012<br />
52 weeks 50 weeks<br />
ended ended<br />
29 December 31 December<br />
£m Notes 2012 2011<br />
Continuing operations<br />
Finance costs 4 (55.0) (46.2)<br />
Loss before tax (55.0) (46.2)<br />
Tax 5 55.0 12.2<br />
Loss and total comprehensive income for the period – (34.0)<br />
The accompanying notes are an integral part of this income statement.<br />
The Company has no recognised gains and losses other than the loss above, and therefore no separate statement of comprehensive income<br />
is presented.<br />
company statement of changes in equity<br />
52 WEEKS ENDED 29 DECEMBER 2012<br />
Share Share Retained Total<br />
£m capital premium earnings equity<br />
New shares issued 0.1 302.4 – 302.5<br />
Loss for the period – – (34.0) (34.0)<br />
Balance at 31 December 2011 0.1 302.4 (34.0) 268.5<br />
New shares issued – 12.8 – 12.8<br />
Balance at 29 December 2012 0.1 315.2 (34.0) 281.3<br />
PAGE 100 VIEW THE FULL REPORT AT ANNUALREPORT12.BAKKAVOR.COM
BAKKAVOR ANNUAL REPORT AND ACCOUNTS 2012<br />
company statement of financial position<br />
29 DECEMBER 2012<br />
£m Notes 29 December 2012 31 December 2011<br />
Non-current assets<br />
Investment in subsidiaries 7 929.4 929.4<br />
Current assets<br />
Amounts due from other group companies 11 55.0 12.2<br />
Current liabilities<br />
Borrowings 6 (57.8) (35.7)<br />
Amounts due to other group companies 11 (83.1) (51.6)<br />
Other payables – (0.1)<br />
(140.9) (87.4)<br />
Non-current liabilities<br />
Borrowings 6 (562.2) (585.7)<br />
Net assets 281.3 268.5<br />
Equity<br />
Share capital 10 0.1 0.1<br />
Share premium 10 315.2 302.4<br />
Retained earnings (34.0) (34.0)<br />
Total equity 281.3 268.5<br />
The financial statements of <strong>Bakkavor</strong> Finance (2) plc, company number 7501697, and the accompanying notes, which form an integral part of the<br />
Company financial statements, were approved by the Board of Directors on 20 February 2013. They were signed on behalf of the Board of Directors by:<br />
A Gudmundsson<br />
Director<br />
PAGE 101 VIEW THE FULL REPORT AT ANNUALREPORT12.BAKKAVOR.COM
BAKKAVOR ANNUAL REPORT AND ACCOUNTS 2012<br />
company statement of cash flows<br />
52 WEEKS ENDED 29 DECEMBER 2012<br />
52 weeks 50 weeks<br />
ended ended<br />
29 December 31 December<br />
£m 2012 2011<br />
Increase in payables 40.5 50.4<br />
Cash generated by operations 40.5 50.4<br />
Interest paid (51.6) (43.1)<br />
Net cash (used in)/generated from operating activities (11.1) 7.3<br />
Investing activities:<br />
Acquisition of subsidiary – (627.1)<br />
Net cash used in investing activities – (627.1)<br />
Financing activities:<br />
Issue of shares 12.8 0.1<br />
Increase in borrowings 23.0 654.7<br />
Repayment of borrowings (24.7) (35.0)<br />
Net cash generated from financing activities 11.1 619.8<br />
Net increase in cash and cash equivalents – –<br />
Cash and cash equivalents at beginning of period – –<br />
Cash and cash equivalents at end of period – –<br />
PAGE 102 VIEW THE FULL REPORT AT ANNUALREPORT12.BAKKAVOR.COM
BAKKAVOR ANNUAL REPORT AND ACCOUNTS 2012<br />
notes to the company financial statements<br />
52 WEEKS ENDED 29 DECEMBER 2012<br />
1<br />
GENERAL INFORMATION<br />
<strong>Bakkavor</strong> Finance (2) plc (the ‘Company’) is a Public Limited Company whose ultimate parent company and controlling party is <strong>Bakkavor</strong> Group Limited<br />
(formerly <strong>Bakkavor</strong> Holdings Limited), a company registered in the United Kingdom.<br />
As the Company was incorporated and registered as a Public Limited Company during the prior period, the comparative Company financial statements<br />
are for the 50 week period to 31 December 2011.<br />
2<br />
SIGNIFICANT ACCOUNTING POLICIES<br />
The separate financial statements of the Company are presented as required by the Companies Act 2006. As permitted by that Act, the separate<br />
financial statements have been prepared in accordance with International Financial <strong>Report</strong>ing Standards (IFRSs) as issued by the International<br />
Accounting Standards Board (IASB). The financial statements have also been prepared in accordance with IFRSs adopted by the European Union.<br />
The financial statements have been prepared on the historical cost basis, except for the revaluation of financial instruments. The principal accounting<br />
policies adopted are the same as those set out in note 2 to the consolidated financial statements except as set out below.<br />
Investments in subsidiaries are stated at cost less, where appropriate, provisions for impairment.<br />
Going concern for the Company has been considered along with the Group, by the Directors. This consideration is set out in note 3 to the<br />
consolidated financial statements.<br />
3<br />
EMPLOYEES, DIRECTORS AND AUDIT REMUNERATION<br />
Audit fees of £70,000 (2011: £85,000) for the period ended 29 December 2012 have been borne by fellow Group Company <strong>Bakkavor</strong> Foods Limited.<br />
The Company has no employees and payments to Directors for the period ended 29 December 2012 (2011: £nil) have been borne by fellow Group<br />
Company <strong>Bakkavor</strong> Foods Limited.<br />
4<br />
FINANCE COSTS<br />
52 weeks 50 weeks<br />
ended ended<br />
29 December 31 December<br />
£m 2012 2011<br />
Interest on borrowings 45.0 41.1<br />
Amortisation of refinancing costs 6.9 3.8<br />
Interest on loans from other group companies 3.1 1.3<br />
55.0 46.2<br />
PAGE 103 VIEW THE FULL REPORT AT ANNUALREPORT12.BAKKAVOR.COM
BAKKAVOR ANNUAL REPORT AND ACCOUNTS 2012<br />
notes to the company financial statements<br />
continued<br />
5<br />
TAX<br />
The credit for the period can be reconciled to the loss per the income statement as follows:<br />
52 weeks 50 weeks<br />
ended<br />
ended<br />
29 December 31 December<br />
2012 2011<br />
£m % £m %<br />
Loss before tax (55.0) (100.0) (46.2) (100.0)<br />
Group relief surrendered at tax rate of 100% (2011: 26.5%) 55.0 100.0 12.2 26.5<br />
Tax credit and effective tax rate for the period 55.0 100.0 12.2 26.5<br />
6<br />
BORROWINGS<br />
29 December 31 December<br />
£m 2012 2011<br />
Bank overdraft 32.6 9.7<br />
Bank loans 235.0 259.7<br />
8.25% senior secured notes 352.4 352.0<br />
620.0 621.4<br />
Borrowings repayable as follows:<br />
On demand or within one year 57.8 35.7<br />
In the second year 217.4 16.0<br />
In the third to fifth years inclusive 344.8 569.7<br />
620.0 621.4<br />
Analysed as:<br />
Amount due for settlement within 12 months (shown within current liabilities) 57.8 35.7<br />
Amount due for settlement after 12 months 562.2 585.7<br />
620.0 621.4<br />
All borrowings are denominated in Pounds Sterling.<br />
7<br />
INVESTMENTS IN SUBSIDIARIES<br />
Investment<br />
in Group<br />
£m Companies<br />
Balance at 29 December 2012 and 31 December 2011 929.4<br />
PAGE 104 VIEW THE FULL REPORT AT ANNUALREPORT12.BAKKAVOR.COM
BAKKAVOR ANNUAL REPORT AND ACCOUNTS 2012<br />
notes to the company financial statements<br />
continued<br />
8<br />
SUBSIDIARIES<br />
As at 29 December 2012, <strong>Bakkavor</strong> Finance (2) plc held investments in the share capital in the following Companies (ownership in dormant Companies<br />
have not been listed):<br />
Place of registration<br />
Name and operation Principal activity Interest<br />
Directly held investments:<br />
<strong>Bakkavor</strong> Finance (3) Limited United Kingdom Holding Company 100%<br />
Indirectly held investments:<br />
<strong>Bakkavor</strong> Foods Limited United Kingdom Preparation and marketing of fresh prepared foods 100%<br />
Heli Food Fresh AS Czech Republic Preparation and marketing of fresh prepared foods 100%<br />
Anglia Crown Limited United Kingdom Preparation and marketing of fresh prepared foods 100%<br />
<strong>Bakkavor</strong> Fresh Cook Limited United Kingdom Preparation and marketing of fresh prepared foods 100%<br />
<strong>Bakkavor</strong> Overseas Limited United Kingdom Importer and exporter of machinery and equipment 100%<br />
Vaco BV Belgium Preparation and marketing of fresh prepared foods 100%<br />
<strong>Bakkavor</strong> (SA) (Pty) Limited South Africa Preparation and marketing of fresh prepared foods 100%<br />
Creative Food Group Limited<br />
(includes 12 further subsidiaries within Hong Kong and China) Hong Kong Produce and manufactures salad products 100%<br />
Italpizza Srl Italy Manufacture of branded and private label pizza products 100%<br />
Two Chefs on a Roll Inc USA Manufacture of custom and private label sav<strong>our</strong>y and bakery products 100%<br />
<strong>Bakkavor</strong> Foods Canada Inc Canada Preparation and marketing of fresh prepared foods 100%<br />
<strong>Bakkavor</strong> Estates Limited United Kingdom Property management 100%<br />
<strong>Bakkavor</strong> Finance Limited United Kingdom Group management services 100%<br />
<strong>Bakkavor</strong> Iberica S.A. Spain Distribution 100%<br />
<strong>Bakkavor</strong> Central Finance Limited United Kingdom Customer Invoicing 100%<br />
<strong>Bakkavor</strong> London Limited United Kingdom Holding Company 100%<br />
<strong>Bakkavor</strong> Acquisitions (2008) Limited United Kingdom Holding Company 100%<br />
<strong>Bakkavor</strong> USA Inc USA Holding Company 100%<br />
<strong>Bakkavor</strong> USA Limited United Kingdom Holding Company 100%<br />
<strong>Bakkavor</strong> (Acquisitions) Limited United Kingdom Holding Company 100%<br />
<strong>Bakkavor</strong> Limited United Kingdom Holding Company 100%<br />
<strong>Bakkavor</strong> Foods France United Kingdom Holding Company 100%<br />
<strong>Bakkavor</strong> European Marketing BV Netherlands Holding Company 100%<br />
<strong>Bakkavor</strong> China Limited United Kingdom Holding Company 100%<br />
<strong>Bakkavor</strong> Asia Limited United Kingdom Holding Company 100%<br />
<strong>Bakkavor</strong> Invest Limited United Kingdom Holding Company 100%<br />
<strong>Bakkavor</strong> Pension Trustees Limited United Kingdom Holding Company 100%<br />
<strong>Bakkavor</strong> London ehf Iceland Non-trading 100%<br />
English Village Salads Limited United Kingdom Non-trading 100%<br />
Notsallow 256 Limited United Kingdom Non-trading 100%<br />
Exotic Farm Prepared Limited United Kingdom Non-trading 100%<br />
Cucina Sano Limited United Kingdom Non-trading 100%<br />
Butterdean Products Limited United Kingdom Non-trading 100%<br />
<strong>Bakkavor</strong> Overseas Holdings Limited United Kingdom Non-trading 100%<br />
Exotic Farm Produce Limited United Kingdom Non-trading 100%<br />
<strong>Bakkavor</strong> Maroc Morocco Non-trading 100%<br />
As at 29 December 2012, the Group still held indirect investments in the following companies. However, these are subject to a sale agreement and<br />
are therefore regarded as discontinued operations in the consolidated income statement and consolidated statement of comprehensive income and<br />
classified as assets held for sale in the consolidated statement of financial position.<br />
Place of registration<br />
Name and operation Principal activity Interest<br />
Cinquime Saison SAS Group (includes 2 further subsidiaries) France Preparation and marketing of fresh prepared foods 100%<br />
Crudi SAS France Preparation and marketing of fresh prepared foods 100%<br />
Sogesol SA Spain Preparation and marketing of fresh prepared foods 100%<br />
PAGE 105 VIEW THE FULL REPORT AT ANNUALREPORT12.BAKKAVOR.COM
BAKKAVOR ANNUAL REPORT AND ACCOUNTS 2012<br />
notes to the company financial statements<br />
continued<br />
9<br />
FINANCIAL INSTRUMENTS<br />
Foreign currency risk<br />
The Company is not exposed to any foreign currency risk as its borrowings are all in Pounds Sterling.<br />
Interest rate risk management<br />
The Company is exposed to interest rate risk on borrowings. The risk is managed by maintaining an appropriate mix between fixed and floating rate<br />
borrowings. The Group uses derivative financial instruments such as interest rate swaps to minimise the risk associated with variable interest rates.<br />
Interest rate sensitivity analysis<br />
Interest rate sensitivity analysis has been performed on Company borrowings of £351.2 million (2011: £324.3 million) to illustrate the impact on<br />
profits and equity if interest rates increased/decreased. This analysis assumes the liabilities outstanding at the period end were outstanding for the<br />
whole period. A 100 basis points increase or decrease has been used, comprising management’s assessment of reasonably possible changes in<br />
interest rates.<br />
29 December 31 December<br />
2012 2011<br />
£’000 Profit/(loss) Profit/(loss)<br />
Effects of 100 basis points increase in interest rate (3.5) (3.2)<br />
Effects of 100 basis points decrease in interest rate 3.5 3.2<br />
29 December 31 December<br />
£m 2012 2011<br />
Financial assets<br />
Loans and receivables at amortised cost:<br />
Amounts due from other group companies 55.0 12.2<br />
Financial liabilities<br />
Other Financial liabilities at amortised cost:<br />
Amounts due to other group companies 83.1 51.6<br />
Other payables – 0.1<br />
Borrowings 620.0 621.4<br />
703.1 673.1<br />
All Company borrowings are denominated in Sterling.<br />
10<br />
SHARE CAPITAL AND RESERVES<br />
29 December 2012 31 December 2011<br />
Number £m Number £m<br />
Issued and fully paid:<br />
Ordinary shares of £1 each 55,258 0.1 53,258 0.1<br />
Shares issued in the period:<br />
Ordinary shares of £1 each 2,000 – 53,258 0.1<br />
During the period, the Company has issued £2,000 of share capital. The share issues were made in September and December 2012, each amounting<br />
to £1,000. The proceeds from the share issue have been used to repay bank borrowings during the period.<br />
Share premium<br />
As a result of the share issue, £4,605,427 and £8,201,142 of share premium was created in September and December 2012 respectively. The<br />
proceeds from the share issue have been used to repay bank borrowings during the period. In the prior period, £302.4 million of share premium was<br />
created of which £96.6 million was in relation to the acquisition of <strong>Bakkavor</strong> Finance (3) Limited and £205.8 million a related party loan, which was<br />
capitalised.<br />
PAGE 106 VIEW THE FULL REPORT AT ANNUALREPORT12.BAKKAVOR.COM
BAKKAVOR ANNUAL REPORT AND ACCOUNTS 2012<br />
notes to the company financial statements<br />
continued<br />
11<br />
RELATED PARTY TRANSACTIONS<br />
Transactions<br />
During the period, the Company entered into the following transactions with related parties.<br />
Amounts owed by<br />
Amounts owed to<br />
related parties<br />
related parties<br />
£m 2012 2011 2012 2011<br />
Group Companies 55.0 12.2 83.1 51.6<br />
£82.7 million (2011: £51.6 million) is a corporate loan owed to <strong>Bakkavor</strong> London Limited with a further £0.4 million (2011: nil) owed to another group<br />
company, <strong>Bakkavor</strong> European Marketing Limited. £55.0 million (2011: £12.2 million) is tax Group relief owed to <strong>Bakkavor</strong> Finance (2) plc by various<br />
other Group Companies.<br />
These amounts are unsecured and will be settled in cash. No guarantees have been given or received. No provisions have been made for doubtful<br />
debts in respect of the amounts owed by related parties.<br />
Amounts are denominated in Sterling. All related party payables and receivables are held at amortised cost.<br />
12<br />
13<br />
EVENTS AFTER THE STATEMENT OF FINANCIAL POSITION DATE<br />
There were no significant events after the statement of financial position date.<br />
CONTROLLING PARTY<br />
On 27 September 2012, <strong>Bakkavor</strong> Group Limited (formerly <strong>Bakkavor</strong> Holdings Limited) became the parent company of the <strong>Bakkavor</strong> Group following<br />
a shareholder meeting of <strong>Bakkavor</strong> Group ehf (EHF) where it was agreed to implement a decrease in the share capital of EHF and to effect the<br />
distribution of EHF’s shares in <strong>Bakkavor</strong> Group Limited to EHF’s shareholders.<br />
The company name of <strong>Bakkavor</strong> Holdings Limited was formally changed to <strong>Bakkavor</strong> Group Limited to reflect its status as parent of the <strong>Bakkavor</strong> Group.<br />
The Company’s ultimate parent company and ultimate controlling party is <strong>Bakkavor</strong> Group Limited, a Company registered in the United Kingdom.<br />
The largest Group in which the results of the Company are consolidated is that headed by <strong>Bakkavor</strong> Group Limited and has included the Company<br />
in its group financial statements. The smallest Group into which the accounts are consolidated is <strong>Bakkavor</strong> Finance (2) plc.<br />
Copies of both the <strong>Bakkavor</strong> Group Limited and <strong>Bakkavor</strong> Finance (2) plc financial statements are available from West Marsh Road, Spalding,<br />
Lincolnshire, PE11 2BB, United Kingdom.<br />
The immediate parent of the Company is <strong>Bakkavor</strong> Finance (1) Limited.<br />
PAGE 107 VIEW THE FULL REPORT AT ANNUALREPORT12.BAKKAVOR.COM
BAKKAVOR ANNUAL REPORT AND ACCOUNTS 2012<br />
appendix: reconciliation of continuing and<br />
discontinued activities to total group trading<br />
52 weeks ended 29 December 2012 52 weeks ended 31 December 2011<br />
Discontinued Continuing Discontinued Continuing<br />
£m Total group operations operations Total group operations operations<br />
Continuing operations<br />
Revenue 1,694.2 105.6 1,588.6 1,677.7 111.9 1,565.8<br />
Cost of sales (1,236.3) (75.7) (1,160.6) (1,239.8) (81.6) (1,158.2)<br />
Gross profit 457.9 29.9 428.0 437.9 30.3 407.6<br />
Distribution costs (87.4) (9.4) (78.0) (85.5) (10.3) (75.2)<br />
Other administrative costs (308.0) (19.4) (288.6) (298.3) (22.1) (276.2)<br />
Exceptional items (net) (3.6) 0.8 (4.4) 7.2 (0.2) 7.4<br />
<strong>Bakkavor</strong> Group ehf management charge (0.5) – (0.5) (1.2) – (1.2)<br />
Impairment of assets (1.0) – (1.0) (76.9) (13.2) (63.7)<br />
Total administrative costs (313.1) (18.6) (294.5) (369.2) (35.5) (333.7)<br />
Profit/(loss) on disposal of subsidiary 0.4 – 0.4 (1.0) – (1.0)<br />
Loss on disposal of associate – – – (1.6) – (1.6)<br />
Share of results of associates after tax 0.9 – 0.9 1.1 – 1.1<br />
Operating profit/(loss) 58.7 1.9 56.8 (18.3) (15.5) (2.8)<br />
Investment revenue 0.1 – 0.1 0.1 – 0.1<br />
Finance costs (61.5) (0.3) (61.2) (65.2) (0.2) (65.0)<br />
Other gains (net) 8.4 – 8.4 6.0 – 6.0<br />
Profit/(loss) before tax 5.7 1.6 4.1 (77.4) (15.7) (61.7)<br />
Tax (3.6) (0.8) (2.8) 2.4 (0.1) 2.5<br />
Profit/(loss) for the period from continuing operations 2.1 0.8 1.3 (75.0) (15.8) (59.2)<br />
Discontinued operations<br />
Profit/(loss) for the period from discontinued operations – (0.8) 0.8 – 15.8 (15.8)<br />
Profit/(loss) for the period 2.1 – 2.1 (75.0) – (75.0)<br />
PAGE 108 VIEW THE FULL REPORT AT ANNUALREPORT12.BAKKAVOR.COM
BAKKAVOR ANNUAL REPORT AND ACCOUNTS 2012<br />
corporate information<br />
Directors<br />
A Gudmundsson<br />
L Gudmundsson<br />
A Thoroddsen (resigned 25 September 2012)<br />
B Bjarnason<br />
H Lúðvígsson<br />
G Sigurdsson (appointed 25 September 2012)<br />
Secretary<br />
S Witham (appointed 1 February 2012)<br />
J Stansbury (resigned 1 February 2012)<br />
Registered Office<br />
West Marsh Road<br />
Spalding<br />
Lincolnshire<br />
PE11 2BB<br />
Bankers<br />
Barclays Bank PLC<br />
10 Hall Place<br />
Spalding<br />
Lincolnshire<br />
PE11 1SR<br />
Auditor<br />
Deloitte LLP<br />
F<strong>our</strong> Brindleyplace<br />
Birmingham<br />
B1 2HZ<br />
PAGE 109 VIEW THE FULL REPORT AT ANNUALREPORT12.BAKKAVOR.COM
Designed and produced by JohnstonWorks<br />
www.johnstonworks.com