Complete annual report 2010-11 - Land - NSW Government
Complete annual report 2010-11 - Land - NSW Government
Complete annual report 2010-11 - Land - NSW Government

Create successful ePaper yourself
Turn your PDF publications into a flip-book with our unique Google optimized e-Paper software.
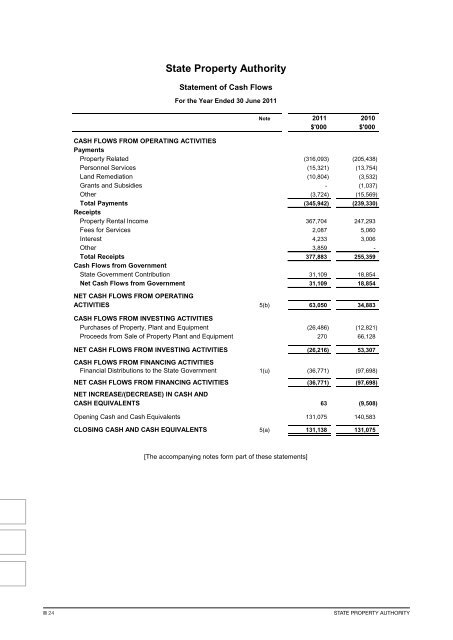
State Property Authority<br />
Statement of Cash Flows<br />
For the Year Ended 30 June 20<strong>11</strong><br />
Note 20<strong>11</strong> <strong>2010</strong><br />
$'000 $'000<br />
CASH FLOWS FROM OPERATING ACTIVITIES<br />
Payments<br />
Property Related (316,093) (205,438)<br />
Personnel Services (15,321) (13,754)<br />
<strong>Land</strong> Remediation (10,804) (3,532)<br />
Grants and Subsidies - (1,037)<br />
Other (3,724) (15,569)<br />
Total Payments (345,942) (239,330)<br />
Receipts<br />
Property Rental Income 367,704 247,293<br />
Fees for Services 2,087 5,060<br />
Interest 4,233 3,006<br />
Other 3,859 -<br />
Total Receipts 377,883 255,359<br />
Cash Flows from <strong>Government</strong><br />
State <strong>Government</strong> Contribution 31,109 18,854<br />
Net Cash Flows from <strong>Government</strong> 31,109 18,854<br />
NET CASH FLOWS FROM OPERATING<br />
ACTIVITIES 5(b) 63,050 34,883<br />
CASH FLOWS FROM INVESTING ACTIVITIES<br />
Purchases of Property, Plant and Equipment (26,486) (12,821)<br />
Proceeds from Sale of Property Plant and Equipment 270 66,128<br />
NET CASH FLOWS FROM INVESTING ACTIVITIES (26,216) 53,307<br />
CASH FLOWS FROM FINANCING ACTIVITIES<br />
Financial Distributions to the State <strong>Government</strong> 1(u) (36,771) (97,698)<br />
NET CASH FLOWS FROM FINANCING ACTIVITIES (36,771) (97,698)<br />
NET INCREASE/(DECREASE) IN CASH AND<br />
CASH EQUIVALENTS 63 (9,508)<br />
Opening Cash and Cash Equivalents 131,075 140,583<br />
CLOSING CASH AND CASH EQUIVALENTS 5(a) 131,138 131,075<br />
[The accompanying notes form part of these statements]<br />
24<br />
State Property Authority