omnia holdings annual report 2010 omnia holdings annu
omnia holdings annual report 2010 omnia holdings annu
omnia holdings annual report 2010 omnia holdings annu

You also want an ePaper? Increase the reach of your titles
YUMPU automatically turns print PDFs into web optimized ePapers that Google loves.
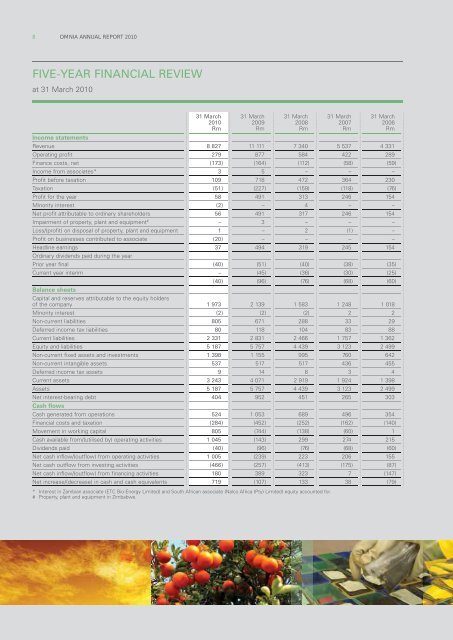
8 OMNIA ANNUAL REPORT <strong>2010</strong><br />
FIVE-YEAR FINANCIAL REVIEW<br />
at 31 March <strong>2010</strong><br />
31 March<br />
<strong>2010</strong><br />
Rm<br />
31 March<br />
2009<br />
Rm<br />
31 March<br />
2008<br />
Rm<br />
31 March<br />
2007<br />
Rm<br />
31 March<br />
2006<br />
Rm<br />
Income statements<br />
Revenue 8 827 11 111 7 340 5 537 4 331<br />
Operating profit 279 877 584 422 289<br />
Finance costs, net (173) (164) (112) (58) (59)<br />
Income from associates* 3 5 – – –<br />
Profit before taxation 109 718 472 364 230<br />
Taxation (51) (227) (159) (118) (76)<br />
Profit for the year 58 491 313 246 154<br />
Minority interest (2) – 4 – –<br />
Net profit attributable to ordinary shareholders 56 491 317 246 154<br />
Impairment of property, plant and equipment # – 3 – – –<br />
Loss/(profit) on disposal of property, plant and equipment 1 – 2 (1) –<br />
Profit on businesses contributed to associate (20) – – – –<br />
Headline earnings 37 494 319 245 154<br />
Ordinary dividends paid during the year<br />
Prior year final (40) (51) (40) (38) (35)<br />
Current year interim – (45) (36) (30) (25)<br />
Balance sheets<br />
Capital and reserves attributable to the equity holders<br />
(40) (96) (76) (68) (60)<br />
of the company 1 973 2 139 1 583 1 248 1 018<br />
Minority interest (2) (2) (2) 2 2<br />
Non-current liabilities 805 671 288 33 29<br />
Deferred income tax liabilities 80 118 104 83 88<br />
Current liabilities 2 331 2 831 2 466 1 757 1 362<br />
Equity and liabilities 5 187 5 757 4 439 3 123 2 499<br />
Non-current fixed assets and investments 1 398 1 155 995 760 642<br />
Non-current intangible assets 537 517 517 436 455<br />
Deferred income tax assets 9 14 8 3 4<br />
Current assets 3 243 4 071 2 919 1 924 1 398<br />
Assets 5 187 5 757 4 439 3 123 2 499<br />
Net interest-bearing debt<br />
Cash flows<br />
404 952 451 265 303<br />
Cash generated from operations 524 1 053 689 496 354<br />
Financial costs and taxation (284) (452) (252) (162) (140)<br />
Movement in working capital 805 (744) (138) (60) 1<br />
Cash available from/(utilised by) operating activities 1 045 (143) 299 274 215<br />
Dividends paid (40) (96) (76) (68) (60)<br />
Net cash inflow/(outflow) from operating activities 1 005 (239) 223 206 155<br />
Net cash outflow from investing activities (466) (257) (413) (175) (87)<br />
Net cash inflow/(outflow) from financing activities 180 389 323 7 (147)<br />
Net increase/(decrease) in cash and cash equivalents 719 (107) 133 38 (79)<br />
* Interest in Zambian associate (ETC Bio-Energy Limited) and South African associate (Nalco Africa (Pty) Limited) equity accounted for.<br />
# Property, plant and equipment in Zimbabwe.