omnia holdings annual report 2010 omnia holdings annu
omnia holdings annual report 2010 omnia holdings annu
omnia holdings annual report 2010 omnia holdings annu

You also want an ePaper? Increase the reach of your titles
YUMPU automatically turns print PDFs into web optimized ePapers that Google loves.
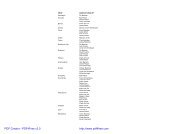
Statistical information<br />
31 March<br />
<strong>2010</strong><br />
31 March<br />
2009<br />
31 March<br />
2008<br />
OMNIA ANNUAL REPORT <strong>2010</strong> 9<br />
31 March<br />
2007<br />
31 March<br />
2006<br />
Earnings, dividends and ordinary shares<br />
Earnings per share (cents) 122,0 1 107,4 718,2 560,3 353,2<br />
Dividends per share for the year (cents)* – 250,0 200,0 160,0 145,0<br />
Interim dividends per share (cents) – 100,0 83,0 70,0 60,0<br />
Dividend cover – 4,4 3,6 3,5 2,4<br />
Net asset value per share (cents) 4 240 4 816 3 572 2 844 2 339<br />
Number of shares in issue at year end (000’s)<br />
Number of shares held by Share Incentive Scheme<br />
46 491 44 370 44 263 43 943 43 607<br />
and not included above (000’s) 759 807 914 1 234 1 570<br />
Number of employees<br />
Profitability, liquidity and leverage<br />
2 668 2 498 2 388 1 926 1 905<br />
Operating profit as a percentage of sales 3,2% 7,9% 8,0% 7,6% 6,7%<br />
Effective tax rate (including secondary tax on companies) 46,8% 31,6% 33,6% 32,5% 33,1%<br />
Return on average equity 2,7% 31,1% 24,3% 21,6% 15,9%<br />
Net debt to equity percentage 20,5% 44,5% 28,5% 21,2% 29,7%<br />
Current ratio 1,4 1,4 1,2 1,1 1,0<br />
EBIT finance cost cover 1,6 5,3 5,2 7,3 4,9<br />
EBITDA finance cost cover<br />
Share performance<br />
Market value per share (cents)<br />
2,7 6,3 6,0 8,7 6,3<br />
– at year end 6 289 5 200 7 100 6 600 4 410<br />
– highest 6 360 8 398 8 400 6 700 4 550<br />
– lowest 4 901 4 000 6 255 4 170 3 500<br />
Value of shares traded (R’000) 953 664 1 457 948 1 392 093 1 127 461 777 764<br />
Volume of shares traded (000’s)<br />
Share volumes traded as a percentage of total<br />
16 493 22 324 19 178 20 896 19 426<br />
issued shares 34,9% 49,4% 42,5% 46,3% 43,0%<br />
Definitions<br />
1. Earnings per share – profit attributable to ordinary shareholders divided by the weighted average number of ordinary shares in issue during the year,<br />
excluding shares held by Share Incentive Scheme.<br />
2. Dividend cover – earnings per share divided by the dividend per share for the year.<br />
3. Net asset value per share – ordinary shareholders’ equity and minority interest divided by the number of shares in issue at year end, excluding the shares held by<br />
Share Incentive Scheme.<br />
4. Number of shares in issue at year end – shares issued less shares held by Share Incentive Scheme.<br />
5. Return on average equity – profit attributable to ordinary shareholders expressed as a percentage of the average opening and closing ordinary shareholders’ equity.<br />
6. Net debt to equity percentage – debt expressed as a percentage of all ordinary shareholders’ equity plus minority interest.<br />
7. Net debt – interest-bearing liabilities net of cash resources.<br />
8. Current ratio – current assets divided by current liabilities.<br />
9. EBIT finance cost cover – operating profit before finance cost and tax divided by finance cost .<br />
10. EBITDA finance cost cover – operating profit before finance cost, tax, depreciation, amortisation and share-based payment expense divided by finance cost.<br />
* Includes a capitalisation award of 150 cents as a final dividend for the 2009 year. Shareholders could elect to receive a cash dividend of 145 cents instead of the<br />
capitalisation award.