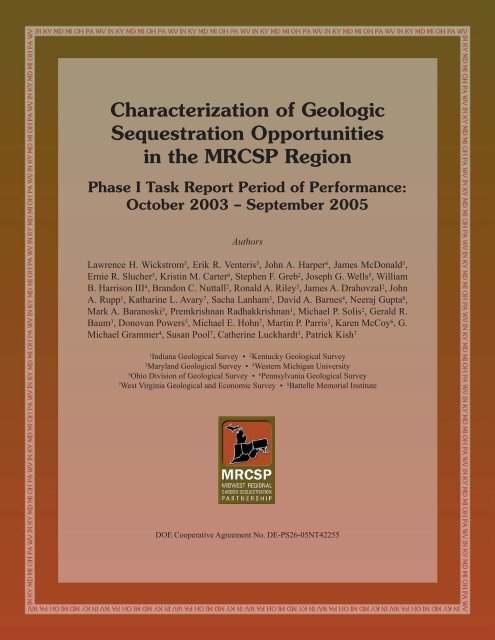
MRCSP Phase I Geologic Characterization Report - Midwest ...
MRCSP Phase I Geologic Characterization Report - Midwest ...
MRCSP Phase I Geologic Characterization Report - Midwest ...

You also want an ePaper? Increase the reach of your titles
YUMPU automatically turns print PDFs into web optimized ePapers that Google loves.
<strong>Characterization</strong> of <strong>Geologic</strong><br />
Sequestration Opportunities<br />
in the <strong>MRCSP</strong> Region<br />
<strong>Phase</strong> I Task <strong>Report</strong> Period of Performance:<br />
October 2003 – September 2005<br />
Authors<br />
Lawrence H. Wickstrom 5 , Erik R. Venteris 5 , John A. Harper 6 , James McDonald 5 ,<br />
Ernie R. Slucher 5 , Kristin M. Carter 6 , Stephen F. Greb 2 , Joseph G. Wells 5 , William<br />
B. Harrison III 4 , Brandon C. Nuttall 2 , Ronald A. Riley 5 , James A. Drahovzal 2 , John<br />
A. Rupp 1 , Katharine L. Avary 7 , Sacha Lanham 3 , David A. Barnes 4 , Neeraj Gupta 8 ,<br />
Mark A. Baranoski 5 , Premkrishnan Radhakkrishnan 1 , Michael P. Solis 2 , Gerald R.<br />
Baum 3 , Donovan Powers 5 , Michael E. Hohn 7 , Martin P. Parris 2 , Karen McCoy 6 , G.<br />
Michael Grammer 4 , Susan Pool 7 , Catherine Luckhardt 3 , Patrick Kish 7<br />
1<br />
Indiana <strong>Geologic</strong>al Survey • 2 Kentucky <strong>Geologic</strong>al Survey<br />
3<br />
Maryland <strong>Geologic</strong>al Survey • 4 Western Michigan University<br />
5<br />
Ohio Division of <strong>Geologic</strong>al Survey • 6 Pennsylvania <strong>Geologic</strong>al Survey<br />
7<br />
West Virginia <strong>Geologic</strong>al and Economic Survey • 8 Battelle Memorial Institute<br />
DOE Cooperative Agreement No. DE-PS26-05NT42255
This Task <strong>Report</strong> was prepared by the Ohio Division of <strong>Geologic</strong>al Survey under subcontract to Battelle<br />
Memorial Institute, 505 King Avenue, Columbus, OH 43201.<br />
This report was submitted by Battelle as a result of research performed under DOE Cooperative Agreement<br />
No. DE-PS26-05NT42255, the <strong>Midwest</strong> Regional Carbon Sequestration Partnership (<strong>MRCSP</strong>).<br />
NOTICE<br />
This report was prepared as an account of work sponsored by an agency of the United States Government.<br />
Neither the United States Government, nor any agency thereof, nor any of their employees, nor Battelle, nor<br />
any member of the <strong>MRCSP</strong> makes any warranty, express or implied, or assumes any liability or responsibility<br />
for the accuracy, completeness, or usefulness of any information, apparatus, product, or process disclosed, or<br />
represents that its use would not infringe privately owned rights. Reference herein to any specific commercial<br />
product, process, or service by trade name, trademark, manufacturer, or otherwise does not necessarily constitute<br />
or imply its endorsement, recommendations, or favoring by Battelle, members of the <strong>MRCSP</strong>, the United<br />
States Government or any agency thereof. The views and opinions of the authors expressed herein do not<br />
necessarily state or reflect those of the members of the <strong>MRCSP</strong>, the United States Government or any agency<br />
thereof.
ABOUT THE <strong>MRCSP</strong><br />
The <strong>Midwest</strong> Regional Carbon Sequestration Partnership (<strong>MRCSP</strong>) is a public/private consortium<br />
that is assessing the technical potential, economic viability, and public acceptability of carbon sequestration<br />
within its region. The <strong>MRCSP</strong> region consists of seven contiguous states: Indiana, Kentucky,<br />
Maryland, Michigan, Ohio, Pennsylvania, and West Virginia. A group of leading universities,<br />
state geological surveys, non-governmental organizations and private companies listed below and led<br />
by Battelle, makes up the <strong>MRCSP</strong>. It is one of seven such partnerships across the U.S. that make up<br />
the U.S. DOE Regional Carbon Sequestration Partnership Program. The U.S. DOE through NETL<br />
contributes the majority of funds for the <strong>MRCSP</strong>’s research accounting for 68.62% of the total funding<br />
or $2.41 million for the current phase of work all under Agreement No. DE-PS26-05NT42255.<br />
The next largest contributor is the Ohio Coal Development Office within The Ohio Air Quality Development<br />
Authority under Agreement No. CDO/DE-02-17. The <strong>MRCSP</strong> also receives funding from<br />
all of the other members listed below.<br />
INDUSTRY PARTNERS<br />
AES Warrior Run<br />
Alliance Resource Partners (Mettiki Coal)<br />
American Electric Power<br />
Arch Coal<br />
Baard Energy<br />
Babcock & Wilcox<br />
British Petroleum (BP)<br />
Center for Energy and Economic Development<br />
(CEED)<br />
Cinergy<br />
CONSOL Energy<br />
Constellation Energy<br />
DTE Energy<br />
First Energy<br />
Maryland Energy Administration<br />
Monsanto<br />
Ohio Coal Development Office of the Ohio Air<br />
Quality Development Authority<br />
Ohio Corn Growers Association<br />
Ohio Forestry Association<br />
Ohio Soybean Council<br />
Ohio Turfgrass Foundation<br />
Scotts Company<br />
RESEARCH PARTNERS<br />
Battelle Memorial Institute<br />
CONSOL Energy<br />
Indiana <strong>Geologic</strong>al Survey<br />
Kentucky <strong>Geologic</strong>al Survey<br />
Keystone Center<br />
Maryland <strong>Geologic</strong>al Survey<br />
Michigan State University<br />
National Regulatory Research Institute<br />
Ohio Division of <strong>Geologic</strong>al Survey<br />
Ohio Environmental Council<br />
Pacific Northwest National Laboratory<br />
Penn State University<br />
Pennsylvania <strong>Geologic</strong>al Survey<br />
Purdue University<br />
The Ohio State University<br />
University of Maryland<br />
West Virginia <strong>Geologic</strong>al and Economic Survey<br />
West Virginia University<br />
Western Michigan University<br />
i
CHARACTERIZATION OF GEOLOGIC SEQUESTRATION OPPORTUNITIES IN THE <strong>MRCSP</strong> REGION<br />
ABSTRACT<br />
The <strong>Midwest</strong> Regional Carbon-Sequestration Partnership (<strong>MRCSP</strong>) <strong>Phase</strong>-1 geologic team conducted a preliminary<br />
assessment of the region’s geologic CO 2 sequestration potential for the Paleozoic geologic sequence in<br />
Indiana, eastern Kentucky, Maryland, Michigan, Ohio, Pennsylvania, and West Virginia and for Cenozoic-age<br />
strata in the Maryland coastal plain. Nine potential reservoir, and five potential confining cap-rock, intervals<br />
(this includes organic shales) were identified, their structure, depth, and thickness mapped, and other physical<br />
and chemical data pertinent to CO 2 sequestration compiled. A comprehensive series of digital maps and tabular<br />
databases were constructed to facilitate regional sequestration planning and modeling. The <strong>Phase</strong>-1 assessment<br />
indicates the <strong>MRCSP</strong> region has the potential to sequester in excess of 450 gigatonnes of CO 2 in deep, subsurface<br />
geologic formations. This estimate of the CO 2-storage capacity is very large when compared to the present<br />
level of CO 2 emissions for the region. Furthermore, geologic mapping and calculations of the storage capacity<br />
conducted during <strong>Phase</strong>-I reveals that the geologic storage capacity for CO 2 is disproportionately distributed,<br />
both between and within the partnership states; some areas have high storage potential, while others have little<br />
or no known capacity. Hence, for CO 2 sequestration technology to be practical, it is essential that any future<br />
CO 2 point-source is located in an area where the subsurface geology is amenable to large-scale CO 2 injection,<br />
or, at the least, that the economics of transporting the CO2 from the point-source to the geologic CO2 reservoir<br />
is included in the site planning. Future research, to be conducted during <strong>Phase</strong>-2 of the partnership, will include<br />
additional geologic mapping and modeling of additional stratigraphic intervals determined to be viable sequestration<br />
targets as well as the refinement of those maps and models developed during <strong>Phase</strong>-1. Future <strong>MRCSP</strong><br />
CO 2 sequestration research will also contain components investigating the economic variables associated with<br />
transporting CO 2 from existing point-sources to any potential CO 2-storage site. These additional analyses will<br />
provide the region with the geologic and economic foundation necessary to advance with CO 2 sequestration<br />
technology.<br />
ii
CONTENTS<br />
About the <strong>MRCSP</strong> ............................................................................................................................... i<br />
Abstract............................................................................................................................................... ii<br />
Executive Summary........................................................................................................................... vi<br />
<strong>Geologic</strong> Team Members...............................................................................................................1<br />
Acknowledgments..........................................................................................................................1<br />
Task Statement...............................................................................................................................1<br />
Background Information................................................................................................................1<br />
Potential <strong>Geologic</strong> Reservoirs..................................................................................................3<br />
Introduction to the <strong>MRCSP</strong> Region’s Geography and Geology....................................................4<br />
Geography................................................................................................................................4<br />
General Geology, Major Structural Features and Target Areas ...............................................4<br />
<strong>Geologic</strong> Uncertainties.............................................................................................................9<br />
Stratigraphic Correlation..........................................................................................................9<br />
Selection of Mapped Units and Limitations ............................................................................9<br />
Challenges and Opportunities................................................................................................11<br />
<strong>Geologic</strong> Mapping Procedures, Data Sources And Methodology...............................................12<br />
Methodology for Structure and Isopach Mapping.................................................................12<br />
Methodologies for other Maps...............................................................................................21<br />
Data Storage and Distribution................................................................................................22<br />
Oil, Gas, and Gas Storage Fields.................................................................................................26<br />
CO 2-Sequestration Storage Capacity for the <strong>MRCSP</strong> Project.....................................................33<br />
CO 2-Storage Mechanisms in <strong>Geologic</strong> Formations...............................................................33<br />
CO 2 Properties........................................................................................................................33<br />
Estimating Storage Capacities ...............................................................................................36<br />
Discussion of Results.............................................................................................................42<br />
Conclusions and Regional Assessment for <strong>Geologic</strong> Sequestration............................................45<br />
References Cited..........................................................................................................................46<br />
Appendix A: <strong>Geologic</strong> Summaries of Mapped Units ........................................................................49<br />
1. Precambrian Unconformity surface.........................................................................................49<br />
2. Cambrian Basal Sandstones.....................................................................................................52<br />
3. Basal sandstones to top of Copper Ridge Interval...................................................................59<br />
4. Upper Cambrian Rose Run sandstone .....................................................................................65<br />
5. Knox to Lower Silurian Unconformity Interval ......................................................................72<br />
6. Middle Ordovician St. Peter Sandstone...................................................................................81<br />
7. Lower Silurian Medina Group/“Clinton” Sandstone...............................................................84<br />
8. Niagaran/Lockport through Onondaga Interval.......................................................................92<br />
9. Lower Silurian Niagara Group Reefs .....................................................................................99<br />
10. Lower Devonian Mandata Shale .........................................................................................103<br />
11. Lower Devonian Oriskany Sandstone .................................................................................103<br />
12. Lower Devonian Sylvania Sandstone..................................................................................113<br />
13. Lower/Middle Devonian Needmore Shale ..........................................................................116<br />
14. Devonian organic-rich shales ..............................................................................................119<br />
15. Pennsylvanian coal beds in the Appalachian Basin.............................................................126<br />
16. Pennsylvanian coal beds in the Michigan Basin..................................................................131<br />
17. Lower Cretaceous Waste Gate Formation ...........................................................................135<br />
References Cited........................................................................................................................142<br />
FIGURES<br />
Figure 1.—Large point-sources of CO 2 within the <strong>MRCSP</strong> region.....................................................2<br />
Figure 2.—Shaded topographic-relief map of the <strong>MRCSP</strong> study area................................................5<br />
Figure 3.—Shaded topographic-relief map showing generalized bedrock-geology units...................6<br />
Figure 4.—Generalized cross section across the Michigan and Appalachian basins ..........................7<br />
Figure 5.—Stratigraphic correlation and CO 2-sequestration characterization chart............................8<br />
Figure 6.—Map of major basement faults and other features of the <strong>MRCSP</strong> region........................10<br />
Figure 7.—Map showing the distribution of all wells .......................................................................13<br />
Figure 8.—Map showing the rock units that comprise the Cambrian basal sandstones....................14<br />
Figure 9.—Map showing the distribution of control points used for Lockport mapping..................16<br />
Figure 10.—Map showing the distribution of control points used for Basal sandstone mapping.....17<br />
iii
CHARACTERIZATION OF GEOLOGIC SEQUESTRATION OPPORTUNITIES IN THE <strong>MRCSP</strong> REGION<br />
Figure 11.—Map illustrating hand-contouring vs. computer-contouring..........................................19<br />
Figure 12.—An example of using a previously published map to aid interpretation........................20<br />
Figure 13.—Locations of Class I and Class II injection wells ..........................................................23<br />
Figure 14.—Screening map summarizing the saline formations.......................................................24<br />
Figure 15.—Three-dimensional view of the screening map..............................................................25<br />
Figure 16.—Oil and gas fields in the <strong>MRCSP</strong> region........................................................................28<br />
Figure 17.—Schematic diagram of a CO 2-enhanced oil recovery operation.....................................29<br />
Figure 18.—Top-10 oil fields and top-10 gas fields in the <strong>MRCSP</strong> region .......................................30<br />
Figure 19.—Gas storage capacity and ranking by state.....................................................................31<br />
Figure 20.—Location of gas storage fields in the <strong>MRCSP</strong> region.....................................................32<br />
Figure 21.—CO 2 phase diagram ........................................................................................................33<br />
Figure 22.—Diagram for CO 2 of different temperature curves .........................................................34<br />
Figure 24.—Solubility of CO 2 in fresh water ....................................................................................35<br />
Figure 23.—Diagram showing CO 2 density with depth for a typical pressure gradient ...................35<br />
Figure 25.—Diagram showing the decrease in CO 2 solubility with increasing salinity....................35<br />
Figure 26.—Rose Run CO 2-sequestration capacity map...................................................................37<br />
Figure 27.—Gamma-ray density cross-plot derived from digital logs..............................................41<br />
Figure A1-1.—Index map showing relationships of Precambrian tectonic provinces ......................49<br />
Figure A1-2.—Structure map drawn on the top of the Precambrian unconformity ..........................51<br />
Figure A2-1.—Generalized schematic cross section .........................................................................53<br />
Figure A2-2.—Map showing the thickness of the Cambrian basal sandstones interval....................54<br />
Figure A2-3.—Structure map drawn on the top of the Cambrian basal sandstones interval.............56<br />
Figure A3-1.—Map showing the thickness of the basal sands to top of Copper Ridge interval.......63<br />
Figure A3-2.—Structure map drawn on the top of the Copper Ridge Dolomite...............................64<br />
Figure A4-1.—Subcrop and extent map of the Rose Run sandstone.................................................66<br />
Figure A4-2.—Figure showing difference in interpretation of the Rose Run sandstone...................68<br />
Figure A4-3.—Map showing the thickness of the Rose Run sandstone............................................69<br />
Figure A4-4.—Structure contour map drawn on the top of the Rose Run sandstone........................70<br />
Figure A5-1.—Generalized model of Middle and Upper Ordovician carbonate depositional<br />
environments................................................................................................................................74<br />
Figure A5-2.—Regional reconstruction of major depositional and tectonic elements......................75<br />
Figure A5-3.—Representation of Upper Ordovician clastic lithofacies............................................76<br />
Figure A5-4.—Structure contour map drawn on the top of the Knox surface...................................77<br />
Figure A5-5.—Structure contour map drawn on the Lower Silurian (Cherokee) unconformity.......78<br />
Figure A5-6.—Map showing the thickness of the Knox to Lower Silurian unconformity ...............79<br />
Figure A6-1.—Map showing the thickness of the St. Peter Sandstone .............................................82<br />
Figure A6-2.—Structure contour map drawn on the top of the St Peter Sandstone ..........................83<br />
Figure A7-1.—Stratigraphic correlation chart of the Medina Group ................................................85<br />
Figure A7-2.—Oil and gas fields producing from the Medina Group...............................................86<br />
Figure A7-3.—Structure contour map on the top of the Medina Group/“Clinton” sandstone ..........88<br />
Figure A7-4.—Map showing the thickness of the Medina Group/“Clinton” sandstone ...................89<br />
Figure A7-5.—Gamma ray and porosity geophysical log curves......................................................90<br />
Figure A8-1.—Map showing the location of salt solution wells and salt mines ...............................94<br />
Figure A8-2.—Detailed stratigraphic column and geophysical log curves .......................................96<br />
Figure A8-3.—Structure contour map drawn on top of the Onondaga Limestone............................97<br />
Figure A8-4.—Map showing the thickness of the Niagaran to Onondaga Limestone interval.........98<br />
Figure A9-1.—Generalized structure contour map drawn on the top of the Niagaran Group.........101<br />
Figure A11-1.—Stratigraphic correlation chart of the Oriskany Sandstone....................................104<br />
Figure A11-2.—Structure contour map drawn on the top of the Oriskany Sandstrone...................105<br />
Figure A11-3.—Map showing the thickness of the Oriskany Sandstone ........................................106<br />
Figure A11-4.—Interpreted environments of deposition in the Oriskany Sandstone......................107<br />
Figure A11-5.—Geophysical log suite of the Oriskany Sandstone .................................................109<br />
Figure A11-6.—Northwest-southeast cross section of Giffin dome................................................110<br />
Figure A11-7.—Block diagram showing interpreted three-dimensional structure..........................110<br />
Figure A11-8.—Map showing the variations in lithology ...............................................................111<br />
Figure A12-1.—Map showing the thickness of the Sylvania Sandstone.........................................114<br />
Figure A12-2.—Structure contour map drawn on the top of the Sylvania Sandstone.....................115<br />
Figure A13-1.—Map showing the thickness of the Needmore shale ..............................................117<br />
Figure A13-2.—Structure contour map drawn on the top of the Needmore shale ..........................118<br />
Figure A14-1.—General stratigraphic nomenclature for the Middle and Upper Devonian black<br />
shales..........................................................................................................................................119<br />
iv
CONTENTS<br />
Figure A14-2.—Structure contour map drawn on the top of the Devonian shales..........................122<br />
Figure A14-3.—Map showing the thickness of the Devonian shales..............................................123<br />
Figure A14-4.—Type log from the Big Sandy gas field in eastern Kentucky .................................124<br />
Figure A14-5.—Map showing gas fields in the Devonian shale interval ........................................125<br />
Figure A15-1.—Map showing extent of coal-bearing formations in <strong>MRCSP</strong> region .....................127<br />
Figure A15-2.— Schematic cross sections across portions of the Appalachian basin.....................129<br />
Figure A15-3.—Map showing the net thickness of Pennsylvanian coals........................................130<br />
Figure A16-1.—Structure contour map drawn on the top of the Saginaw Formation.....................133<br />
Figure A16-2.—Map showing the thickness of the Saginaw Coal..................................................134<br />
Figure A17-1.—Stratigraphy of the Potomac Group beneath the eastern Delmarva Peninsula......135<br />
Figure A17-2.—Outcrop belt of the Potomac Group and the Magothy Formation.........................136<br />
Figure A17-3.—Diagram showing the Fall Zone ............................................................................137<br />
Figure A17-4.—Structure contour map drawn on the top of the Waste Gate Sandstone ................139<br />
Figure A17-5.—Map showing the thickness of the Waste Gate Sandstone.....................................140<br />
TABLES<br />
Table 1.—Summary of geologic layers mapped and map type .........................................................11<br />
Table 2.—Summary of data and error statistics.................................................................................18<br />
Table 3.—Comparison between uncertainty in faulted and non-faulted areas ..................................21<br />
Table 4.—Summary of oil and gas production ..................................................................................27<br />
Table 5.—Top ten gas and oil fields in the <strong>MRCSP</strong> region ...............................................................29<br />
Table 6.—Assumptions for missing data in oil-and-gas field CO 2-sequestration calculations .........38<br />
Table 7.—Summary of estimated effective CO 2-storage capacity by reservoir type ........................39<br />
Table 8.—Estimated effective CO 2-storage capacity by state ...........................................................39<br />
Table 9.—Oil and gas fields. Estimated effective CO 2-storage capacity by state..............................39<br />
Table 10.—Waste Gate Formation estimated effective CO 2-storage capacity...................................43<br />
Table 11.—Net coal greater than 500 feet deep. Estimated effective CO 2-storage capacity.............43<br />
Table 12.—Devonian Shales estimated effective CO 2-storage capacity ...........................................43<br />
Table 13.—Needmore Shale estimated effective CO 2-storage capacity............................................43<br />
Table 14.—Sylvania Sandstone estimated effective CO 2-storage capacity .......................................43<br />
Table 15.—Oriskany Sandstone estimated effective CO 2-storage capacity ......................................43<br />
Table 16.—Medina Sandstone estimated effective CO 2-storage capacity.........................................43<br />
Table 17.—St. Peter Sandstone estimated effective CO 2-storage capacity .......................................43<br />
Table 18.—Rose Run sandstone estimated effective CO 2-storage capacity ......................................43<br />
Table 19.—Potsdam Sandstone estimated effective CO 2-storage capacity .......................................44<br />
Table 20.—Unnamed Conasauga sandstones estimated effective CO 2-storage capacity ..................44<br />
Table 21.—Rome trough sandstones estimated effective CO 2-storage capacity ...............................44<br />
Table 22.—Mt. Simon Formation estimated effective CO 2-storage capacity....................................44<br />
Table A2-1.—Class 1 well data from Ohio........................................................................................58<br />
Table A7-1.—Summary of data for “Clinton”-Medina gas storage fields in the Appalachian<br />
basin.............................................................................................................................................91<br />
Table A9-1.—Summary of data for Niagaran gas storage fields in the Michigan basin .................102<br />
Table A11-1.—Summary of data for Oriskany Sandstone gas storage fields..................................112<br />
Table A14-1.—Nomenclature of primary shale units ......................................................................120<br />
Table A17-1.—Summary of depth, thickness, porosity, permeability and salinity of the<br />
Waste Gate Formation ...............................................................................................................141<br />
v
CHARACTERIZATION OF GEOLOGIC SEQUESTRATION OPPORTUNITIES IN THE <strong>MRCSP</strong> REGION<br />
EXECUTIVE SUMMARY<br />
The <strong>Midwest</strong> Regional Carbon-Sequestration Partnership <strong>Phase</strong>-1 geologic team consists of members from<br />
the states of Indiana, Kentucky, Maryland, Michigan, Ohio, Pennsylvania, and West Virginia. This team examined<br />
the regional geology in those portions of each state that lie in the Appalachian and Michigan basins, the<br />
Cincinnati and Findlay arches region, and the Atlantic coastal plain. This research resulted in the creation of<br />
a regional correlation chart showing those units in the Paleozoic with the physical qualities deemed critical to<br />
their use in the geologic sequestration of carbon dioxide. This initial synoptic analysis resulted in the identification<br />
of nine potential geologic reservoirs and five potential confining units (this includes organic shale intervals,<br />
a rock type that can also be considered a potential reservoir). In total, the <strong>MRCSP</strong> geologic assessment<br />
team used over 85,000 data points that resulted in 30 original structure (depth) and thickness maps, 9 regional<br />
thematic maps, and 14 derivative capacity maps. One of the more significant thematic map layers created was<br />
a new oil-and-gas-fields map for the MRSCP region—the first ever compiled for the seven-state area. All data<br />
and maps, collected and generated for this project, are stored in a modern geographic information system (GIS),<br />
and are available for interactive use on the <strong>MRCSP</strong> website.<br />
Using these data, estimates of the CO 2-storage capacity for each state in the <strong>MRCSP</strong> partnership were calculated<br />
for each geologic unit and reservoir type considered viable for use in CO 2 sequestration (for example,<br />
deep saline formations, oil and gas reservoirs, unmineable coals, and organic shales). This <strong>Phase</strong>-1 assessment<br />
determined that the <strong>MRCSP</strong> region contains the following approximations:<br />
• 450 to 500 gigatonnes of storage potential in deep saline formations; of these, the Mt. Simon, St. Peter, and<br />
Rose Run sandstones have the highest potential in the region.<br />
• Between 2-3 gigatonnes of CO 2 potential storage may be possible in existing and depleted oil and gas fields.<br />
Using CO 2 for enhanced oil recovery could result in the additional production of hundreds of millions of<br />
barrels of oil that otherwise would be left in the ground.<br />
• Unmineable coals in the northern Appalachian basin are estimated to have the potential to sequester between<br />
0.2 to 0.3 gigatonnes of CO 2. Using CO 2 to enhance the gas recovery from these coal beds (coalbed methane)<br />
could contribute trillions of cubic feet of additional natural gas resources in the nation.<br />
• A potential may exist to sequester over 45 gigatonnes of CO 2 within the organic shales of the region, and at<br />
the same time, generate (or enhance existing) natural gas production.<br />
This assessment clearly illustrates that the <strong>MRCSP</strong> region, based on current levels of CO 2 production, has<br />
the capacity to store hundreds of years worth of anthropogenic CO 2 emissions. Moreover, it also indicates the<br />
region has many opportunities—at least in the near term—for value-added production of oil and natural gas<br />
generated concurrent with many types of CO 2 sequestration; thus, not having the geology for adequate CO 2<br />
total storage capacity in the <strong>MRCSP</strong> region is not an issue. However, this CO 2-storage capacity is unevenly<br />
distributed, both across the region and within the individual partnership states. Indeed, some areas have an<br />
abundance of storage capacity while others have little or no known potential for CO 2 sequestration. What<br />
the team asserts through this analysis is that locating future CO 2 point-sources where the subsurface geology<br />
is amenable to large-scale CO 2 injection is critical if this technology is to be used. Further, a comprehensive<br />
analysis of the economics of transporting CO 2 from existing point-sources to CO 2-storage sites is essential for<br />
the fruition of CO 2 sequestration technology.<br />
vi
1<br />
CHARACTERIZATION OF GEOLOGIC SEQUESTRATION<br />
OPPORTUNITIES IN THE <strong>MRCSP</strong> REGION<br />
GEOLOGIC TEAM MEMBERS<br />
The geologic team for the <strong>MRCSP</strong> project consists of a multifaceted<br />
collaboration of geologic, geographic information system,<br />
and computer scientists from the geological surveys of Indiana,<br />
Kentucky, Ohio, Maryland, Pennsylvania and West Virginia, and<br />
the Michigan Basin Core Research Laboratory of Western Michigan<br />
University. These agencies are the major repositories for most publicly<br />
available geologic data in the seven state <strong>MRCSP</strong> region.<br />
Larry Wickstrom, of the Ohio <strong>Geologic</strong>al Survey, served as<br />
the geologic team leader. Other team members included John<br />
Rupp and Premkrishnan Radhakrishnan (Indiana); Dr. James<br />
Drahovzal, Dr. Stephen Greb, Brandon Nuttall, Marty Parris,<br />
and Mike Solis (Kentucky); Dr. Gerald Baum, Christine Conn,<br />
Catherine Garcia, and Sacha Lanham (Maryland); Dr. William<br />
Harrison III and Dr. David Barnes (Michigan); Larry Wickstrom,<br />
James McDonald, Donovan Powers, Ernie Slucher, Dr. Erik Venteris,<br />
and Joseph Wells (Ohio); Dr. John Harper, Kristin Carter,<br />
and Karen McCoy (Pennsylvania); Katharine Lee Avary, Dr.<br />
Michael Hohn, Patrick Kish, and Susan Pool (West Virginia); Dr.<br />
Neeraj Gupta (Battelle Institute). Members of this team brought<br />
to the project extensive experience, from both the public and private<br />
sectors, in analyzing and evaluating the diverse geology of<br />
the <strong>MRCSP</strong> region.<br />
ACKNOWLEDGMENTS<br />
Recognizing the contributions of all individuals and organizations,<br />
without inadvertent omissions, that contributed to a project<br />
of this magnitude is always difficult. However, the contributions<br />
of several individuals deserve special recognition, and are herein<br />
thanked for their contributions. Charles Byrer of the U.S. DOE/<br />
NETL served as the DOE project manager for the <strong>MRCSP</strong>. Ron<br />
Cudnik served as the Battelle project manager during the formative<br />
stages of <strong>Phase</strong> I and David Ball is the current project leader for the<br />
partnership. Strategic guidance was also provided by Jim Dooley of<br />
Battelle’s Joint Global Change Research Institute and outreach support<br />
was led by Judith Bradbury, also of Battelle.<br />
We thank Lisa Van Doren and Edward V. Kuehnle in the Cartography<br />
and Editing Group of the Ohio Division of <strong>Geologic</strong>al<br />
Survey for their patience and great skills in helping compile this<br />
report and their assistance to team members giving presentations<br />
related to this study.<br />
TASK STATEMENT<br />
Under Subtask 2.1 of the <strong>MRCSP</strong> <strong>Phase</strong> I project, the geologic<br />
team examined the regional geology of the project area, created<br />
a regional correlation chart showing the various geologic units<br />
in the study area, and delineated the most promising prospective<br />
geologic reservoirs and sinks for CO 2 sequestration via data<br />
collation, interpretation, and mapping. These data and maps<br />
were then used to calculate a first approximation of the region’s<br />
geologic CO 2 sequestration capacities of four main reservoir<br />
classes: deep saline formations, oil and gas fields, unmineable<br />
coal beds, and organic-rich shales. All information was captured<br />
in a Geographic Information System (GIS) using ESRI’s suite of<br />
ARC-GIS products.<br />
BACKGROUND INFORMATION<br />
The <strong>MRCSP</strong> region generates almost 21 percent of our country’s<br />
electricity, 78 percent of which is from coal, and can be appropriately<br />
considered America’s “engine” room. The region also contains a<br />
wide array of facilities classified as CO 2 point-sources that produce<br />
26 percent of the nation’s CO 2 emissions from power plants and 12<br />
percent of the nation’s total CO 2 emissions (Ball, 2005). Task 1 of<br />
the <strong>MRCSP</strong> study identified over 600 stationary facilities that are<br />
considered CO 2 point-sources, of which at about 300 are classified<br />
as large sources (> 100,000 tons of CO 2/year), that emit over 800<br />
million tons of CO 2 per year. These facilities include plants that<br />
produce ammonia, cement, ethanol, ethylene, ethylene oxide, hydrogen,<br />
and power, as well as petroleum refineries, gas processing<br />
facilities, and iron and steel mills. Because of this large number of,<br />
and the high volumes of emissions from, these point-sources the<br />
future prospects of environmental liability from these CO 2 emissions<br />
necessitate research in the potential of using geologic units<br />
for carbon dioxide sequestration in all seven states (Figure 1). The<br />
main objective of Subtask 2.1 for the <strong>MRCSP</strong> <strong>Phase</strong> I project was<br />
to evaluate the potential capacity for geologic sequestration of CO 2<br />
in the <strong>MRCSP</strong> region.<br />
Until recently, the major options under consideration for mitigation<br />
of greenhouse gas emissions included switching to noncarbon-based<br />
fuels, increasing energy efficiency thereby reducing<br />
greenhouse gas emissions, and terrestrial or biotic sequestration<br />
of CO 2. However, during the last several years, the idea of storing<br />
CO 2 in geologic reservoirs has gained increased prominence as a<br />
result of research funded by the U.S. DOE, similar agencies in other<br />
countries of the world, and a growing interest of CO 2-producing<br />
industries.<br />
The primary attraction of the geologic sequestration option is<br />
due to the potential for direct and long-term storage of captured<br />
CO 2 emissions in close proximity to the CO 2 source. However, to<br />
achieve this objective, the potential capacity of any geologic reservoir<br />
needs to be verified by a detailed regional assessment as well as<br />
by a site-specific investigation to insure that decision-makers fully<br />
understand the characteristics of the geologic sequestration system.<br />
Thus, a major task of the <strong>Phase</strong> I work of the DOE-funded regional<br />
partnerships was a first-round regional assessment of this capacity.<br />
In principal, geologic storage of CO 2 emissions involves purification<br />
of the gas (capture) from its sources (e.g., power plants and refineries),<br />
compression of the CO 2 in order to transform it to a supercritical<br />
phase, followed by its injection in deep geologic formations<br />
1
2 CHARACTERIZATION OF GEOLOGIC SEQUESTRATION OPPORTUNITIES IN THE <strong>MRCSP</strong> REGION<br />
EXPLANATION<br />
Tons of CO 2<br />
Power Sector<br />
#*<br />
#*<br />
#*<br />
#*<br />
#*<br />
105,183 - 1,000,000<br />
1,000,001 - 5,000,000<br />
5,000,001 - 10,000,000<br />
10,000,001 - 15,000,000<br />
15,000,001 - 22,000,000<br />
Ehanol Sector<br />
#* 100,000 - 1,000,000<br />
Ethylene Sector<br />
#* 100,000 - 1,000,000<br />
Hydrogen Sector<br />
#* 150,000<br />
Refineries Sector<br />
#* 100,000 - 1,000,000<br />
#* 1,000,001 - 5,000,000<br />
Gas Processing Sector<br />
#* 0 - 1,000,000<br />
#* 1,000,001 - 5,000,000<br />
Cement Sector<br />
#* 344,693 - 1,000,000<br />
#* 1,000,001 - 5,000,000<br />
Iron & Steel Sector<br />
#* 103,055 - 1,000,000<br />
#* 1,000,001 - 5,000,000<br />
5,000,001 - 10,000,000<br />
#*<br />
50 25 0 50 100 Miles<br />
5025 0 50 100 150 Kilometers<br />
³<br />
Figure 1.—Large (>100,000 tons per year) point-sources of CO 2 within the <strong>MRCSP</strong> region (data from <strong>MRCSP</strong> task-1 report).
BACKGROUND INFORMATION<br />
3<br />
(a minimum depth of approximately 2,500 feet below the surface<br />
is required to maintain the CO 2 in the supercritical phase). Natural<br />
geologic reservoirs have held oil, natural gas, water, and even CO 2,<br />
for millions of years without leaking (or at least with minimal leakage).<br />
Therefore, these same systems are thought to offer both nearterm<br />
opportunities and longer-term possibilities for future management<br />
of anthropogenic CO 2 (Reichle and others, 1999; Beecy and<br />
others, 2002). Societal industries currently use these natural reservoirs<br />
for storage of industrial wastes (Class I injection wells) and the<br />
disposal of oil field brines (Class II injection wells). The injection<br />
of CO 2 into oil fields in order to stimulate additional oil production<br />
[Class II enhanced oil recovery (EOR) injection wells] is a growing<br />
methodology in the petroleum industry. Thus, a substantial quantity<br />
of experience currently exists on CO 2 injection operations. Furthermore,<br />
several large-scale CO 2 geologic sequestration projects have<br />
been in operation for several years; these include the North Sea<br />
Sleipner project (injecting into a saline formation) (Gale and others,<br />
2001) and the North American Weyburn project (sequestering CO 2<br />
while performing enhanced oil recovery) (Whittaker, 2005; Brown<br />
and others, 2001). These projects have been closely monitored and<br />
studied, yielding much information to this emerging technology.<br />
Additionally, the injection of anthropogenic CO 2 may be in<br />
conjunction with the production of methane from unmineable coal<br />
beds or oil and/or natural gas from active or depleted petroleum<br />
reservoirs. In both cases the produced fuels may defray some of the<br />
cost of CO 2 capture and injection. While these enhanced recovery<br />
options are considered to be near-term opportunities, due to potentially<br />
favorable economic conditions, the overall storage capacity in<br />
coal beds or oil-and-gas reservoirs is relatively small compared to<br />
the potential of deep saline formations.<br />
POTENTIAL GEOLOGIC RESERVOIRS<br />
The U.S. Department of Energy has identified several categories<br />
of geologic reservoirs for potential CO 2 sequestration (U.S. Department<br />
of Energy, 1999, 2004, 2005). Of these categories, four<br />
are considered important for the <strong>MRCSP</strong> region: (1) deep saline<br />
formations, (2) oil and gas fields, (3) unmineable coal beds and (4)<br />
organic-rich (carbonaceous) shales.<br />
Deep Saline Formations<br />
Saline formations are natural salt-water bearing intervals of porous<br />
and permeable rocks that occur beneath the level of potable<br />
groundwater. Currently, a number of the saline formations in the<br />
<strong>MRCSP</strong> region are used for waste-fluid disposal (especially in Indiana,<br />
Michigan, and Ohio); thus, a long history of technological<br />
and regulatory factors exist that could be applied to CO 2 injection/<br />
disposal. Saline formations are widespread, close to many large<br />
CO 2 sources, and are thought to have large pore volumes available<br />
for injection (Reichle and others 1999, U.S. DOE, 2004, 2005). In<br />
order to maintain the injected CO 2 in a supercritical phase (i.e. liquid)<br />
the geologic unit must be approximately 2,500-feet or greater<br />
in depth. Maintaining the CO 2 in a liquid phase is desirable because,<br />
as a liquid, it occupies less volume than when in the gaseous phase.<br />
One tonne of CO 2 at surface temperature and pressure (in gaseous<br />
phase) occupies approximately 18,000-cubic feet. The same amount<br />
of CO 2, when injected to approximately 2,600 feet in depth, will occupy<br />
only 50-cubic feet. Deep sequestration depths also help insure<br />
there is an adequate interval of rocks (confining layers) above the<br />
potential injection zones to act as a geologic seal. For the purposes<br />
of the <strong>MRCSP</strong> <strong>Phase</strong> I project, no consideration was given to the<br />
potential use of shallow saline formations for CO 2 sequestration.<br />
In this type of reservoir, CO 2 is injected, under pressure, down a<br />
specially constructed well where it displaces (hydrodynamic trapping)<br />
and mixes (solubility trapping) with saline water and fills the<br />
pore spaces between the mineral grains of the rocks in the reservoir<br />
and is trapped within minerals (mineral trapping) in the rock matrix.<br />
Depth, permeability, injectivity, reservoir pressure, reservoir integrity,<br />
and water chemistry are some of the variables that control the<br />
sequestration potential in deep saline formations (Reichle and others,<br />
1999; Bach and Adams, 2003). In addition to favorable properties<br />
of the injection zone in the reservoir, an overlying seal unit (confining<br />
layers) is necessary. The injected CO 2 has a lower specific<br />
gravity, and thus, is more buoyant than the natural formation fluids<br />
and will rise to the top of the porous zones. Hence, all cap-rock units<br />
must be relatively impermeable and sufficiently thick to arrest any<br />
appreciable vertical movement of the CO 2 within the sequestration<br />
interval, thereby trapping it in the deep subsurface. The <strong>MRCSP</strong><br />
geologic team collected data and mapped several intervals that<br />
would act as satisfactory cap rock as part of the <strong>Phase</strong> I study.<br />
Storage of CO 2 can be in either subsurface traps or in unconfined<br />
strata. In subsurface traps, the more buoyant CO 2 will occupy the<br />
highest portion of any structural (e.g. anticline) or stratigraphic<br />
(e.g. pinch-out) feature. This same mechanism of trapping is found<br />
in many of the natural gas and oil reservoirs (i.e., traps) that occur<br />
in the <strong>MRCSP</strong> study area. Within such traps, only the pore volume<br />
available in the rock and the size of the trap limits the volume of<br />
CO 2 that can be injected. In unconfined storage units, the CO 2 is<br />
injected in regional aquifers located in rocks without specific structural<br />
closures or stratigraphic traps. Once injected, the CO 2 will migrate<br />
to the highest portion of the saline formation where it accumulates<br />
against the cap rock, which prevents further vertical movement<br />
(Bentham and Kirby, 2005). At that point the injected CO 2 then will<br />
migrate laterally, following the normal hydrodynamic flow regime<br />
of the region (usually towards shallower areas). However, it must be<br />
emphasized that flow velocities in deep geologic systems occur at<br />
rates measured in feet per hundreds or thousands of years.<br />
Commercial sequestration in saline formations has been successful<br />
in the Sleipner field of Norway, and the U.S. Department<br />
of Energy is involved in a small-scale demonstration project in the<br />
Frio Formation of Texas (Hovorka and others, 2001). Further testing<br />
and pilot studies will occur in the United States during <strong>Phase</strong><br />
II of the Regional Carbon Sequestration Partnerships (U.S. DOE,<br />
2004, 2005).<br />
Oil and Gas Fields<br />
Oil and gas fields represent known geologic traps (structural or<br />
stratigraphic) containing hydrocarbons within a confined reservoir<br />
with a known cap or seal. In depleted or abandoned petroleum<br />
fields, CO 2 would be injected into the reservoir to fill the pore volume<br />
left by the extraction of the oil or natural gas resource (Westrich<br />
and others, 2002). The injected CO 2 would be trapped by the natural<br />
limits of the reservoir (whether structural or stratigraphic) for secure<br />
storage. Volume, permeability, injectivity, pressure, reservoir<br />
integrity, water chemistry, the nature of the cap rock or reservoir<br />
seal, and the history of production are some of the variables that<br />
control the sequestration potential in depleted oil and gas fields<br />
(Reichle and others, 1999). This option may be attractive in many<br />
parts of the <strong>MRCSP</strong> region because vast areas of the region have<br />
a long history of oil and gas recovery (exploration for oil began in<br />
the 1800s). In addition, the <strong>MRCSP</strong> region includes four of the top<br />
seven, natural-gas storage states in the nation (Natural Gas Monthly,
4 CHARACTERIZATION OF GEOLOGIC SEQUESTRATION OPPORTUNITIES IN THE <strong>MRCSP</strong> REGION<br />
2002). Such large volumes of gas storage capacity strongly suggest<br />
that CO 2 gas can be successfully managed in subsurface reservoirs<br />
within the region.<br />
In active oil fields, it has been demonstrated that CO 2 can be<br />
used for enhanced oil recovery (EOR). In this process, some of the<br />
oil that remains in reservoirs after primary production is recovered<br />
by injecting CO 2 that either (1) repressurizes the reservoir and displaces<br />
and drives the remaining oil to a recovery well (immiscible<br />
flooding) or (2) directly mixes and chemically interacts with the<br />
remaining oil as it pushes it to the producing well (miscible flooding).<br />
Approximately 70 oil fields worldwide currently inject CO 2<br />
for EOR (U.S. DOE, 2004) demonstrating the effectiveness of this<br />
value-added sequestration option. Moreover, enhanced oil recover,<br />
while sequestering CO 2, could provide an economic incentive to<br />
storage in several parts of the <strong>MRCSP</strong> region where CO 2 sources<br />
are near oil fields.<br />
Unmineable Coal Beds<br />
The <strong>MRCSP</strong> region includes the Appalachian basin, which contains<br />
the second- (West Virginia), third- (Kentucky), fourth- (Pennsylvania)<br />
and fourteenth- (Ohio) leading coal-producing states in<br />
the nation (EIA, 2005). Unmineable coal beds offer an alternative<br />
option for geologic sequestration in the region because, unlike the<br />
previously described reservoir types, CO 2 injected into a coal bed<br />
would not only occupy pore space, but would bond, or adsorb, onto<br />
the carbon in the coal itself. The adsorption ratio for CO 2 in coals<br />
is approximately twice that of methane; thus, in theory, the injected<br />
CO 2 would displace methane, allowing for the potential of enhanced<br />
gas recovery (Reznik and others, 1982; Gale and Freund, 2001;<br />
Schroeder and others, 2002). Because of the adsorption mechanism,<br />
concerns of miscibility that occur in oil and gas reservoirs are not an<br />
issue. Thus, the injection of CO 2 and resulting enhanced recovery of<br />
coalbed methane could occur at shallower depths than for depleted<br />
oil reservoirs. Hydrogeologic flow, water chemistry, coal thickness<br />
and quality, and subsurface temperature-pressure conditions are<br />
some of the variables that control the potential use of coal beds for<br />
CO 2 sequestration and enhanced coalbed-methane recovery (Pashin<br />
and others, 2003). Although there is currently only limited coalbed<br />
methane production in the <strong>MRCSP</strong> region, rising gas prices have<br />
led to growing interest in this energy resource in the last decade, and<br />
secondary recovery of methane may provide an economic incentive<br />
for sequestration of CO 2 from sources in the coal fields.<br />
Carbonaceous Shales<br />
The <strong>MRCSP</strong> region also contains widespread, thick deposits of<br />
carbonaceous shales. These shales are interesting in that they are<br />
often multifunctional—acting as seals for underlying reservoirs, as<br />
source rocks for oil and gas reservoirs, and as unconventional gas<br />
reservoirs themselves. Analogous to sequestration in coal beds, CO 2<br />
injection into unconventional carbonaceous shale reservoirs could<br />
be used to enhance existing gas production. As an added bonus, it<br />
is believed the carbonaceous shales would adsorb the CO 2 into the<br />
shale matrix, permitting long-term CO 2-storage, even at relatively<br />
shallow depths (Nuttall and others, 2005a).<br />
INTRODUCTION TO THE <strong>MRCSP</strong> REGION’S GEOGRAPHY AND GEOLOGY<br />
GEOGRAPHY<br />
The seven-state <strong>MRCSP</strong> partnership is an enormous and economically<br />
diverse area of the United States that excess of 255,000 square<br />
miles in size (>662,000 square kilometers). The area considered for<br />
geologic sequestration (excluding the upper peninsula of Michigan<br />
and the Illinois basin portion of Indiana and Kentucky) contains<br />
over 201,000 square miles (501,000 square kilometers). The diverse<br />
topography, hydrology, and bedrock geology of the region present<br />
a variety of geologic sequestration options. Additionally, numerous<br />
environmental considerations will be needed in different parts of the<br />
seven-state region. The MRSCP region encompasses three major<br />
physiographic regions: 1) Atlantic Plain, including the Continental<br />
Shelf and Coastal Plain (Maryland); 2) the Appalachian Highlands,<br />
including the Piedmont Province (Maryland), Blue Ridge Province<br />
(Maryland, West Virginia), Valley and Ridge Province (Maryland,<br />
Pennsylvania, West Virginia), and Appalachian Plateaus Province<br />
(Kentucky, Ohio, Pennsylvania, West Virginia); and the 3) Interior<br />
Plains, including the Interior Low Plateaus (Kentucky, Ohio) and<br />
Central Lowland (Indiana, Michigan, Ohio) (Figure 2).<br />
Bedrock is at or near the surface in much of the Appalachian<br />
Highlands and is covered by Quaternary-age sediments in the Atlantic<br />
Plain and in parts of the Interior Plains north of the Ohio River.<br />
Variable surface topography, climate, and sediment and bedrock<br />
types covering the area result in varied land uses, surface water, and<br />
ground water conditions across the seven states.<br />
GENERAL GEOLOGY, MAJOR STRUCTURAL<br />
FEATURES AND TARGET AREAS<br />
Because the four reservoir classes being considered under this<br />
task all occur in sedimentary rocks, only those areas within the seven<br />
states with thickness of sedimentary rocks considered adequate<br />
for CO 2 sequestration were evaluated for their geologic sequestration<br />
potential. This differs from the terrestrial sequestration portion<br />
of the <strong>MRCSP</strong> project, which examined the entire land-surface area<br />
of the seven-state region. Also, although sedimentary rocks of appropriate<br />
thickness occur in a large part of the <strong>MRCSP</strong> region, the<br />
types and depths of potential CO 2 reservoir strata vary. Figure 3 is a<br />
generalized map of the geologic units at or near the surface that also<br />
shows the major geologic structures of the region. Figure 4 is a cross<br />
section across the map illustrating the sedimentary rocks thicken<br />
into geologic basins and thin above structural arches.<br />
Much of the Appalachian highlands, from the Piedmont on the<br />
east to the Allegheny front on the west, were not included in this<br />
investigation because they are dominated by folded and faulted<br />
metamorphic and igneous rocks. Additionally, it was not possible,<br />
within the scale of this project, to map most of the local sedimentary<br />
deposits within this folded section of the Appalachian Mountains<br />
because of a lack of data on the depth and thickness of individual<br />
units. Likewise, the Upper Peninsula of Michigan was not included<br />
in the geologic assessment of CO 2 sequestration potential because<br />
it consists mostly of metamorphic and igneous rocks. Although<br />
a small area of sedimentary rocks, considered to be a part of the<br />
Michigan basin, does exist in the Upper Peninsula, these rocks do<br />
not obtain depths great enough for consideration as a geologic sequestration<br />
target and were not included in this study.<br />
The eastern limit of <strong>MRCSP</strong> geologic investigations is the Maryland<br />
shoreline. Although many offshore sedimentary rocks may<br />
have a potential for sequestration, they were not investigated in<br />
this project. The western boundary for geologic mapping within the<br />
<strong>MRCSP</strong> region is a multi-county boundary that represents the ap-
INTRODUCTION TO THE <strong>MRCSP</strong> REGION’S GEOGRAPHY AND GEOLOGY<br />
5<br />
1<br />
EXPLANATION<br />
Physiographic_regions<br />
Elevation in feet above<br />
Mean Sea Level<br />
>1400<br />
0<br />
12<br />
8<br />
6<br />
4&5<br />
3<br />
2<br />
11<br />
3<br />
50 25 0 50 100 150 Miles<br />
50 25 0 50 100 150 200 Kilometers<br />
³<br />
Figure 2.—Shaded topographic relief map of the <strong>MRCSP</strong> study area showing the boundaries of the general physiographic provinces. 1 = Superior Upland;<br />
12 = Central Lowland; 3 = Coastal Plain; 11 = Interior Low Plateaus; 8 = Appalachian Plateaus; 6 = Valley and Ridge; 4 & 5 = Piedmont and Blue Ridge; 2 =<br />
Continental Shelf. Physiographic regions from Barton and others (2003); topographic data from NASA (2002).
6 CHARACTERIZATION OF GEOLOGIC SEQUESTRATION OPPORTUNITIES IN THE <strong>MRCSP</strong> REGION<br />
EXPLANATION<br />
Quaternary Age Units<br />
Pennsylvanian Age Units<br />
Ordovician Age Units<br />
Other Units<br />
Tertiary Age Units<br />
Mississippian Age Units<br />
Cambrian Age Units<br />
U P P E R<br />
P E N I N S U L A<br />
Cretaceous Age Units<br />
Devonian Age Units<br />
Precambrian Age Units<br />
Jurassic Age Units<br />
A<br />
Triassic Age Units<br />
Permian Age Units<br />
Silurian Age Units<br />
MICHIGAN<br />
BASIN<br />
I L L I N O I S<br />
KA NKAK EE ARCH<br />
B A S I N<br />
CINCINNATI ARCH<br />
FINDLAY<br />
ARCH<br />
A'<br />
A P P A L A<br />
C H I<br />
A N B A S I N<br />
F O L D A N D T H R U S T<br />
B E L T<br />
COASTAL PLAIN<br />
LIMIT<br />
FOR<br />
GEOLOGIC<br />
MAPPING<br />
50 25 0 50 100 Miles<br />
50 25 0 50 100 150 Kilometers<br />
³<br />
Figure 3.—Shaded topographic-relief map showing generalized bedrock-geology units (by system) found at or near the surface and bedrock contacts. Major<br />
geologic features (folds, arches and basins) of the <strong>MRCSP</strong> study area are also labeled (from Schruben and others, 1997). A-A' line is location of cross section<br />
shown in Figure 4.
INTRODUCTION TO THE <strong>MRCSP</strong> REGION’S GEOGRAPHY AND GEOLOGY<br />
7<br />
<br />
<br />
<br />
<br />
<br />
<br />
<br />
<br />
<br />
<br />
<br />
<br />
<br />
<br />
<br />
<br />
Figure 4.—Generalized cross section across the Michigan and Appalachian basins. Profile line is shown on Figure<br />
3. Elevations for geologic layers in this cross section obtained from maps produced for this report.<br />
proximate boundary between the Kankakee arch and Illinois basin<br />
in Indiana and the western flank of the Cincinnati arch in Kentucky<br />
(Figure 3). The Illinois basin, the focus of another DOE-Carbon Sequestration<br />
Partnership, was not included in this <strong>MRCSP</strong> study.<br />
Michigan Basin<br />
The Michigan basin is a nearly circular cratonic basin, occurring<br />
mostly within the state of Michigan, but locally extending into<br />
northern Indiana and northwestern Ohio. The basin is bordered on<br />
the north and east by the Canadian shield, on the west by the Wisconsin<br />
highland, on the southeast by the Findlay arch, and on the<br />
southwest by the Kankakee arch (Figure 3). Interestingly, the basin<br />
is situated above a gravity high, a feature that may represent complex<br />
basement faulting or a failed rift zone at depth (Hinze and others,<br />
1975). At the center of the Michigan basin, Precambrian basement<br />
rocks are overlain by nearly 16,000 feet of sedimentary strata that<br />
was deposited from Cambrian through Carboniferous time (Figure<br />
5). Although there have been slight shifts in the depositional center<br />
of the basin with time, the basin has remained essentially circular<br />
throughout most of the Paleozoic.<br />
Appalachian Basin<br />
The northern Appalachian basin is an elongate, asymmetric<br />
foreland basin with a preserved northeast-southwest trending central<br />
axis that extends through Pennsylvania, western Maryland,<br />
and West Virginia (Figure 3). The eastern margin of the basin is<br />
concealed beneath thrust sheets in the Blue Ridge Province of the<br />
Appalachian Mountains. The western margin of the basin occurs in<br />
east-central Kentucky and central Ohio. The Cincinnati and Findlay<br />
arches separate the Appalachian basin from the Illinois and Michigan<br />
basins, respectively (Figure 3).<br />
The Appalachian basin initially developed during the Cambrian<br />
Period and above the Rome trough, a basement aulocogen formed<br />
during Iapetan rifting (McGuire and Howell, 1963; Ammerman and<br />
Keller, 1979; Shumaker, 1996). The Rome trough extends eastward<br />
from Kentucky into West Virginia, thence northeastward, possibly<br />
continuing beneath Ordovician and younger-age sediments of the<br />
northern Appalachian basin. Following Iapetan rifting, the basin<br />
was enlarged by periodically reactivation of geologic structures<br />
that developed in response to collisional tectonics along the eastern<br />
margin of North America during the Taconic (Upper Ordovician),<br />
Acadian (Middle to Upper Devonian), and Alleghany (Upper Carboniferous)<br />
orogenies of the Paleozoic Era (Tankard, 1986; Quinlan<br />
and Beaumont, 1984; Thomas, 1995; Shumaker, 1996).<br />
The Precambrian basement is overlain by more than 45,000 feet<br />
of sedimentary rocks in the central Pennsylvania portion of the<br />
northern part of the basin. Sedimentary rocks in the Appalachian<br />
basin range Neoproterzoic to Carboniferous-Permian in age.<br />
Structural Arches<br />
Although the thickest sedimentary cover (and therefore greatest<br />
potential for sequestration) are in the basins, portions of several of<br />
the broad, structural arches in the <strong>MRCSP</strong> region also have potential<br />
for sequestration of CO 2. The Findlay arch may have started as a<br />
positive feature in the late Ordovician during the last phases of the<br />
Taconic orogeny (Wickstrom and others, 1992). In northwestern<br />
Ohio, the arch forms a broad, shallow platform where there has<br />
been significant oil and gas production from the Ordovician Trenton<br />
Limestone.<br />
The Kankakee arch, a post early Ordovician feature, separates<br />
the Michigan basin from the Illinois basin in northern Indiana. The<br />
Indiana-Ohio platform is a broad relatively flat-lying area formed<br />
where the Kankakee and Cincinnati arches merge. Several wastefluid<br />
disposal wells have been drilled to the Mount Simon Sandstone<br />
(a deep saline formation) along this trend in northeastern Indiana.<br />
The Cincinnati arch is a late Ordovician positive feature that separates<br />
the Illinois from the Appalachian basins in Kentucky, Indiana<br />
and Ohio. The western boundary of the <strong>MRCSP</strong> region, in Kentucky<br />
and Indiana, represents the approximate boundary between the Cincinnati<br />
arch and Illinois basin. Unlike the previously discussed<br />
arches, where Precambrian igneous and metamorphic rocks close to<br />
the surface, the Cincinnati arch is underlain by the East Continent<br />
rift basin, an elongate north-south trending basin filled with a thick<br />
sequence of Proterozoic arenaceous rock (Shrake and others, 1991;<br />
Drahovzal and others, 1992).
8 CHARACTERIZATION OF GEOLOGIC SEQUESTRATION OPPORTUNITIES IN THE <strong>MRCSP</strong> REGION<br />
Figure 5.—Stratigraphic correlation and CO 2 sequestration characterization chart of geologic units in the <strong>MRCSP</strong> region.
INTRODUCTION TO THE <strong>MRCSP</strong> REGION’S GEOGRAPHY AND GEOLOGY<br />
9<br />
GEOLOGIC UNCERTAINTIES<br />
Our knowledge about the sequestration potential in deep geologic<br />
units is limited by the availability of data on the various subsurface<br />
attributes of the region. For example, in making broad regional assessments,<br />
such as this <strong>Phase</strong> I task, our assessment is constrained,<br />
and thus limited, by the availability of oil-and-gas-well data, accessibility<br />
to seismic data, and our previous experience and working<br />
knowledge in and of the region.<br />
In general, the amount of data available for mapping and analysis<br />
of any particular unit is directly proportional to its depth below the<br />
surface. Thus, the deeper the unit, the less certain is our understanding<br />
of the various parameters related to, and needed for, assessing<br />
geologic CO 2 sequestration targets in the subsurface of the <strong>MRCSP</strong><br />
region. Unfortunately, since our primary data set is based mainly<br />
on oil and gas wells, the control points used to map the various<br />
units discussed herein is limited by where and how deep companies<br />
in this industry drill. The deeper the well, the more costly it is to<br />
drill; hence, overall, there are fewer deep wells. This is especially<br />
true once the well depth exceeds about 6,000 to 7,000 feet. Consequently,<br />
our knowledge on the deepest portions of the region is<br />
limited—to date, no wells are known to have been drilled to the<br />
deepest extreme of the Appalachian basin, a depth thought to exceed<br />
45,000 feet. These depths are not practical, in any event, for current<br />
sequestration consideration.<br />
Another deep feature of the region that may represent a significant<br />
potential sequestration target is the region containing the Rome<br />
trough, a inadequately known structural feature in the subsurface of<br />
the Appalachian basin (Figure 6). The Rome trough is a large, deep<br />
feature that occurs in Kentucky, West Virginia, and Pennsylvania<br />
and is approximately parallel to the Ohio River (it is thought the<br />
current location of sections of the Ohio River are controlled by<br />
structural irregularities related to this feature). Seismic data and a<br />
limited number of deep wells drilled in this area indicate the Lower<br />
Paleozoic geologic section rapidly expands within this feature. For<br />
example, it is known that several thousand feet of sedimentary rock<br />
occur in the Rome trough proper, that are not known to exist outside<br />
the boundaries of the feature. These same data indicate sandstones,<br />
some of which may have good storage reservoir potential, occupy<br />
many portions of this expanded section. However, what is not<br />
known is how extensive these potential reservoirs are. Nonetheless,<br />
some of these potential sandstone sequestration targets are within<br />
the economic limit of feasibility making them a possible target for<br />
consideration as a large injection target (perhaps in the 9,000 to<br />
12,000-foot range).<br />
It is beyond the scope or economic abilities of this project to test<br />
these deep regions. However, their presences should be mentioned<br />
because, should the Rome trough contains the sandstone intervals<br />
that some believe to be there, this deep feature could easily double<br />
the sequestration potential within the <strong>MRCSP</strong> region.<br />
STRATIGRAPHIC CORRELATION<br />
Assessing the regional potential for CO 2 sequestration requires<br />
an understanding of the many stratigraphic units (groups and formations)<br />
in the <strong>MRCSP</strong> region and their geologic and stratigraphic<br />
relationships between various areas of the partnership (Figure 5).<br />
Therefore, a regional correlation chart was one of the first, and most<br />
significant, undertakings accomplished by the geologic team.<br />
Each state has, over the past 150 years or so, developed its own<br />
stratigraphic nomenclature in order to explain the geologic history<br />
and stratigraphic succession of rocks within each state—some of<br />
these terms are unique to rocks that occur only in the subsurface.<br />
The changing geologic character of many of these rock units, or at<br />
least their position within a geologic basin, has created some differences<br />
in the nomenclatures used in each state (see Figure 5). Other<br />
variations between states are related to different methods used for<br />
establishing the placement of unit boundaries or how a unit is classified<br />
(ranked, i.e., group, formation, member) within a specific rock<br />
interval or in a different area of the region. Prior to the development<br />
of this correlation chart, no detailed chart showing the correlations<br />
between the individual <strong>MRCSP</strong> states existed. We continue to refine<br />
this chart as work progresses. More detailed correlation charts,<br />
where needed, are presented in the discussion of the individual<br />
units/intervals in Appendix A.<br />
SELECTION OF MAPPED UNITS AND LIMITATIONS<br />
Using the regional correlation chart and our knowledge of these<br />
units as a basis, an initial list of potential CO 2 sequestration reservoirs<br />
and seal (cap rock) intervals was chosen for further consideration.<br />
Known stratigraphic intervals of saline formations, petroleum-producing<br />
units, gas-generating (source rock) carbonaceous<br />
shales, and coal-bearing units were identified in each state. Many<br />
of these intervals can be readily correlated between states or basins;<br />
however, others are restricted to a single basin or regions with a<br />
basin, and determining their relationship to other more established<br />
units is problematic.<br />
<strong>Phase</strong> I of all DOE regional partnership projects called for a regional<br />
assessment of the CO 2 sequestration potential in each partnership<br />
area within a defined time frame. To expedite our evaluations,<br />
a list was developed that consists of wide-ranging stratigraphic<br />
intervals (often composed of multiple groups and formations) and<br />
was the basis for an initial assessment of potential reservoirs and<br />
cap rock units that could be regionally mapped using existing data<br />
sources. Maryland and Michigan were later added to the partnership<br />
and the process and list had to be repeated and slightly modified.<br />
Where possible, we adapted previously chosen mapping units to<br />
for use within the new states. However, the addition of the coastal<br />
plain and inclusion of the entire Michigan basin required adding additional<br />
units to the selection list.<br />
After the list of geologic intervals and/or individual units to be<br />
mapped was finalized and a database schema devised, individual<br />
states of the team started collecting the data available to them. This<br />
included, amoung other things, oil-and-gas-well data files (both<br />
electronic and paper), previously completed geologic mapping databases,<br />
published and unpublished studies within individual states,<br />
and miscellaneous data (i.e., core and sample records, geochemical<br />
analyses, miscellaneous geologic data files). As time permitted and<br />
as data sources were discovered, some individual units were added<br />
to the mapping list—an example of this addition is the inclusion of<br />
the Niagaran reefs and Sylvania Sandstone. Table 1 is a final list of<br />
all mapped units in the <strong>MRCSP</strong> project.<br />
Nine potential reservoir horizons and five potential cap-rock intervals<br />
(including organic shales that can also be considered potential<br />
reservoirs) were chosen for regional mapping and further analyses<br />
after our initial screening. Our selection of which reservoir and seal<br />
intervals to map is by no means all-inclusive for the region. On the<br />
contrary, throughout our <strong>Phase</strong> I analysis, several other prospective<br />
reservoirs were noted. Additionally, the selected intervals do not<br />
necessarily represent laterally continuous zones of homogenous reservoirs<br />
or seals. Many assumptions are necessary when mapping at<br />
such a regional scale. Considering the magnitude of this project, the<br />
calculated volumes of potential CO 2 that can sequestered may vary
10 CHARACTERIZATION OF GEOLOGIC SEQUESTRATION OPPORTUNITIES IN THE <strong>MRCSP</strong> REGION<br />
EXPLANATION<br />
Known Basement Faults<br />
Precambrian Tectonic Provinces<br />
NAME<br />
Top of Precambrian surface<br />
Elevation in feet (relative to sealevel)<br />
-2000<br />
East Continent Rift Basin<br />
Eastern Granite-Rhyolite Province<br />
-49000<br />
Grenville Province<br />
Midcontinent Rift System<br />
Penokean Province<br />
t<br />
r o n<br />
Kankakee Arch<br />
P R O J E C<br />
T L<br />
I M I<br />
T<br />
Cincinnati Arch<br />
Lexington Fault<br />
Bowling Green Fault<br />
F<br />
Ohio - Indiana<br />
Platform<br />
r e<br />
G<br />
i l l e<br />
n v<br />
e<br />
R o<br />
m<br />
Findlay<br />
Arch<br />
e<br />
Coshocton Zone<br />
T r o<br />
Pittsburgh-Washington Lineament<br />
A l l<br />
u g h<br />
e g<br />
h e n y<br />
S t r u c t u r a l F r o n t<br />
50 25 0 50 100 150 Miles<br />
50 25 0 50 100 150 200 Kilometers<br />
³<br />
Figure 6.—Map of major basement faults (known), Precambrian tectonic provinces, elevation on top of the Precambrian unconformity, and other structural<br />
features of the <strong>MRCSP</strong> features.
INTRODUCTION TO THE <strong>MRCSP</strong> REGION’S GEOGRAPHY AND GEOLOGY<br />
11<br />
Table 1.—Summary of geologic layers mapped and map type, responsible state for each layer,<br />
interpolation methods and software used to create the maps<br />
<strong>Geologic</strong> Layer(s) Mapped Type of Map(s) State Responsible Methodology Software<br />
Precambrian Structure Structure Ohio Kriging with extensive ArcGIS<br />
hand interpolation<br />
Cambrian basal sandstones Structure & thickness Ohio Kriging, hand Geostatistical Analyst<br />
interpolation in Ky (ArcGIS)<br />
Top of basal sands to Structure & thickness Indiana Local polynomial Geostatistical Analyst<br />
Copper Ridge interval interpolation (ArcGIS)<br />
Rose Run Sandstone Structure & thickness Ohio Kriging, with extensive Geostatistical Analyst<br />
hand interpolation in (ArcGIS)<br />
Ky and Pa portions<br />
Knox to Lower Silurian interval Structure (2) & Ohio Kriging Geostatistical Analyst<br />
thickness<br />
(ArcGIS)<br />
St. Peter Sandstone Structure & thickness Indiana Local polynomial Geostatistical Analyst<br />
interpolation<br />
(ArcGIS)<br />
Medina Sandstone Structure & thickness Pennsylvania Proprietary method, Petra (geoPLUS, 2005)<br />
“Highly Connected<br />
Features” setting in<br />
“Create Contour Grid”<br />
procedure, and<br />
manual editing<br />
Lockport to Onondaga interval Structure & thickness Indiana Local polynomial Geostatisical Analyst<br />
interpolation<br />
(ArcGIS)<br />
Niagaran Reefs Structure Michigan Kriging Surfer<br />
Oriskany Sandstone Structure & thickness Pennsylvania Proprietary method, Petra<br />
“Highly Connected<br />
Features” setting in<br />
“Create Contour Grid”<br />
procedure, and<br />
manual editing<br />
Sylvania Sandstone Structure & thickness Michigan Kriging Surfer<br />
Needmore Shale Structure & thickness Maryland Kriging Geostatistical Analyst<br />
Devonian Shales Structure & thickness Kentucky Kriging Geostatistical Analyst<br />
Appalachian Basin coal Aggregate thickness Ohio/ Kentucky Kriging and hand Geostatistical Analyst<br />
thickness<br />
editing<br />
Saginaw Coal Structure & thickness Michigan Kriging Surfer<br />
Waste Gate Structure & thickness Maryland Kriging Geostatistical Analyst<br />
depending on the detail, and scale, of an individual analysis. Rather,<br />
this <strong>Phase</strong> I analysis delineates stratigraphic intervals that have the<br />
potential to be used as reservoirs and seals for CO 2 sequestration<br />
across the region and provides a basis for approximating the carbon<br />
storage potential of the region in much the same way as the availability<br />
of future energy resources are assessed throughout the world.<br />
Over time, with the application of new technology and a refinement<br />
of those that now exist, coupled with an increase in available data,<br />
the reserve/sequestration potential numbers will inevitably change<br />
for many years to come following an area’s initial assessment.<br />
CHALLENGES AND OPPORTUNITIES<br />
This project was the first time Michigan, Ohio, Indiana, Kentucky,<br />
Pennsylvania, West Virginia, and Maryland have worked collectively<br />
on a project. In itself, this represents a significant milestone<br />
for each state that will have many benefits in future years. Most previous<br />
regional geologic consortia focused on research topics within<br />
an individual basin. However, the <strong>MRCSP</strong> project is the first consortium<br />
in this section of the U.S. to embark upon mapping multiple<br />
geologic units across multiple basins. Such an approach allowed the<br />
various geologists from the multiple states a unique opportunity to<br />
map and analyze many regionally complex geologic intervals, all<br />
the while maintaining a common goal of developing an understanding<br />
of the total geologic system across multiple geologic provinces<br />
(a challenge most geologists relish, yet rarely have!).<br />
Compiling data into a usable format from a seven-member state<br />
working group proved challenging because each state (and members<br />
within states) collects and stores data differently. Much of the<br />
data used for mapping deeper, subsurface-geology units came from<br />
oil and gas wells; hence, the variability in data from state to state<br />
reflects differences in regulatory requirements as enacted in each<br />
state. The age of the available records also varied across the region.<br />
Drilling began in some <strong>MRCSP</strong> member states over 150 years ago,<br />
yet others, like Michigan, did not experience petroleum production<br />
until 1925 (1951 in Maryland). Records are missing or inadequate<br />
on some older wells mostly because there were no regulations in<br />
place or agencies charged with gathering these data at these early<br />
dates. Thus, inconsistencies in the types and amounts of data varied<br />
from state to state. The form of the data was another challenge. All<br />
member states are in the process of converting their paper records to<br />
digital format—some just beginning, others are nearing completion.
12 CHARACTERIZATION OF GEOLOGIC SEQUESTRATION OPPORTUNITIES IN THE <strong>MRCSP</strong> REGION<br />
Consequently, some states were able to compile basic mapping data<br />
quickly, which allowed them extra time to researching additional<br />
data types and sources. Others had to spend much of the project<br />
gathering basic data from paper records and entering it into a computer<br />
compatible format.<br />
One of the benefits of this project was that conducting a regional<br />
compilation allowed for the sharing and mapping of data seamlessly<br />
across political boundaries. An added benefit was this process permitted,<br />
perhaps a first for the region, the analyses of trends (many<br />
being previously undetected) that occur through areas of variable<br />
data for the benefit of the entire region. These results will be critical<br />
for future carbon management in the region and will also be useful<br />
to a wide range of nonsequestration applications.<br />
The thickness and depth of nine potential sequestration target<br />
units and five cap-rock intervals were mapped by the <strong>MRCSP</strong><br />
working group. In total, the <strong>MRCSP</strong> geologic assessment resulted<br />
in 30 original depth and thickness maps, nine regional thematic<br />
maps, and 14 derivative capacity maps in a state-of-the-art GIS<br />
database. Moreover, the regional digital oil-and-gas-fields map<br />
and database was a very significant accomplishment for the seven<br />
state region. It is the first compilation at this scale in the region<br />
and represents the first digital compilation of petroleum fields data<br />
for Maryland, Michigan, Pennsylvania, and West Virginia. The<br />
completion of this basic field-level data, along with the detailed<br />
field polygons, within this regional GIS compilation will prove<br />
very useful not only for CO 2 sequestration research and planning,<br />
but also to the oil and gas industry, academia, and others in the<br />
public and private sectors.<br />
This project represents the first time these geologic units or intervals<br />
have been mapped across this entire region. Also a first for this<br />
project was the collection of the geothermal gradient and salinity<br />
information in a centralized digital database. A number of the maps<br />
produced represent the first time any type of map for that specific<br />
interval have been constructed—such as the basal Cambrian sands.<br />
Although several of the member states were part of MIDCARB<br />
(DOE’s initial CO 2 sequestration partnership), the <strong>MRCSP</strong> project<br />
represents the first time that the geologic CO 2 sequestration potential<br />
has been evaluated for Maryland, Michigan, Pennsylvania, and<br />
West Virginia. The cooperation of the member organizations in this<br />
geologic investigation provides an excellent opportunity for understanding<br />
and implementing future carbon management options<br />
based on the best-available geologic knowledge of the region.<br />
GEOLOGIC MAPPING PROCEDURES, DATA SOURCES AND METHODOLOGY<br />
The central products of the <strong>MRCSP</strong> <strong>Phase</strong> I geologic tasks were<br />
a series of regional-scale, digital spatial models and maps, with the<br />
overall goal to create a GIS to support regional planning for carbon<br />
sequestration. The GIS provides spatial data that can be used<br />
to evaluate the potential for geologic sequestration of CO 2 at any<br />
particular site within the <strong>MRCSP</strong> study area by digitally analyzing<br />
which underlying geologic units might be suitable for further analyses<br />
as a CO 2 reservoir and/or seal, their depths and overall thickness,<br />
and to provide an estimate of sequestration capacities. Selected sites<br />
that appear suitable must still be subjected to further, more detailed<br />
studies and site-specific testing and analyses. Digital maps were<br />
compiled for the depth and thickness of target and confining geologic<br />
layers, the extent of major oil and gas fields, the locations of<br />
industrial injection wells, as well as for other geochemical and petrophysical<br />
data needed to calculate CO 2 sequestration capacity.<br />
Most of the mapping effort focused on generating structure and<br />
isopach maps for nine regional geologic sequestration targets and<br />
five confining layers. The mapping also represents one of the first<br />
attempts to create regional-scale geologic maps using quantitative<br />
methods with rigorous error assessments. <strong>Geologic</strong> structure and<br />
isopach maps were created by interpolating formation tops from oiland-gas-well<br />
records that were compiled by the individual partnership<br />
states. The <strong>MRCSP</strong> geologic database contains a total of 85,650<br />
individual wells (Figure 7) and approximately 162,000 formation<br />
tops. Control points (wells) available for mapping individual layers<br />
ranged from less than 500 points for very deep layers (Lower<br />
Cambrian rocks), to in excess of 23,000 points for shallower layers<br />
such as the Lockport-Onondaga interval. Point data were converted<br />
to isoline maps using a couple of different, commercially-available<br />
software packages that utilize a range of interpolation methods/<br />
algorithms. Unfortunately, these computer interpolations occasionally<br />
resulted in the generation of surface trends that contradicted<br />
known geologic surfaces. In these cases, isolines were manually edited.<br />
Grids (rasters) were created for every layer to facilitate spatial<br />
analyses, modeling, and cartographic display. The accuracy of the<br />
maps was evaluated rigorously. Root Mean Square Errors (RMSE)<br />
ranged from 20 to 500 feet for the structure grids and from 20 to 600<br />
feet for isopach grids. Such error ranges reinforce the previous statements<br />
that the maps of this project are of sufficient quality for regional<br />
planning, but cannot be used in place of detailed site studies.<br />
METHODOLOGY FOR STRUCTURE<br />
AND ISOPACH MAPPING<br />
Maps in this project were created to identify major regional sequestration<br />
targets and confining layers. Our definition of mapping<br />
units reflects these goals rather than traditional stratigraphic-use<br />
customs. Hence, in many cases the mapped layers do not follow formal<br />
lithologic units or sequence-stratigraphy definitions as currently<br />
used by many workers. For some map layers, several lithologic units<br />
that are considered diachronous were merged together. For example,<br />
the Cambrian basal sandstones layer includes the Mt. Simon Sandstone,<br />
the basal sandstones of the Rome Trough, the Potsdam Sandstone,<br />
and unnamed sandstones of the Conasauga Group (Figure 8).<br />
These units range from the Furongian (Upper) to the Lower Cambrian<br />
in their occurrence, yet have little genetic relationship to one<br />
another. However, the grouping of these units together is useful in<br />
and of itself since all sandstones directly overlying the Precambrian<br />
unconformity can now be found on one map, thus reducing the complexity<br />
of using multiple maps for a like stratigraphic unit.<br />
The mapping workflow for this project included six steps: (1) data<br />
gathering, (2) data filtering to remove erroneous wells, (3) interpolation<br />
and contouring of gridded data, (4) manual editing of digital<br />
contour maps, (5) peer review and adjustments, and (6) creation of<br />
grids from final contour maps. The various <strong>MRCSP</strong> geologic teams<br />
divided the mapping responsibilities amongst themselves based on<br />
individual areas of expertise. Each organization was responsible for<br />
the aforementioned steps 1 thru 5 for each selected interval and each<br />
team was allowed the freedom to use the mapping software of their<br />
choosing. After review, the final contour map files were sent to the<br />
Ohio Division of <strong>Geologic</strong>al Survey, where final gridding was applied<br />
for use in the CO 2 capacity calculations.<br />
Original Data<br />
The primary dataset consisted of well data provided by each
GEOLOGIC MAPPING PROCEDURES, DATA SOURCES AND METHODOLOGY<br />
13<br />
Figure 7.—Map showing the distribution of all wells (85,650 unique wells) used to make the geologic structure and isopach maps in the <strong>MRCSP</strong> phase I study<br />
area.
14 CHARACTERIZATION OF GEOLOGIC SEQUESTRATION OPPORTUNITIES IN THE <strong>MRCSP</strong> REGION<br />
EXPLANATION<br />
Lithologic Unit<br />
Mt Simon Sandstone<br />
Potsdam Sandstone<br />
Rome Trough sandstones<br />
Unnamed Conasauga sandstone<br />
Mt Simon Sandstone<br />
Potsdam Sandstone<br />
Unnamed Conasauga sandstone<br />
P R O J E C<br />
T L<br />
I M I<br />
T<br />
Rome Trough sandstones<br />
50 25 0 50 100 Miles<br />
50 25 0 50 100 150 Kilometers<br />
³<br />
Figure 8.—Map showing the rock units that comprise the Cambrian basal sandstones and their distribution in the <strong>MRCSP</strong> region.
GEOLOGIC MAPPING PROCEDURES, DATA SOURCES AND METHODOLOGY<br />
15<br />
<strong>MRCSP</strong> member state. The bulk of the data originated from oil-andgas-well<br />
completion records. Also, each organization supplemented<br />
the datasets, when possible, with data created from previous work<br />
containing detailed geophysical-log-based interpretations. The<br />
resultant data files for this project used, for each structure map<br />
creation, the geographic position of the well, its elevation, and the<br />
depth of the top of each mapped interval. Due to the range of data<br />
sources, the quality of depth data varied across the region. For example,<br />
some formation tops were determined by experienced drillers,<br />
others or by industry or government geologists, while others<br />
had an unknown origin. Because of this, filtering procedures were<br />
needed to remove errors and irregularities from the dataset.<br />
Data filtering was accomplished by a variety of methods. For<br />
example, for layers created by the Ohio Division of <strong>Geologic</strong>al<br />
Survey (see Table 1), a geostatistical approach was adopted using<br />
Geostastistical Analyst (ArcGIS). A preliminary variogram<br />
was modeled and an initial surface created. Cross validation was<br />
conducted and points with residuals, two standard deviations or<br />
more from the mean residual value, were flagged as potential outliers.<br />
Then, flagged points were inspected; those deemed valid, yet<br />
flagged because of the influence of bad neighboring points were left<br />
in the system; erroneous data were removed. The data sets were also<br />
corrected by searching for output that did not conform to projected<br />
geologic trends across a region. If the error could not be resolved<br />
using just the data and map, geophysical-log based cross sections<br />
were constructed to reconcile the areas of conflict. The filtering<br />
and inspection process was repeated until all erroneous wells were<br />
removed or resolved. The accuracy of the resultant interpolated surfaces<br />
is directly proportional to the amount and distribution of well<br />
control use to construct any particular map surface.<br />
As briefly mentioned above, the amount of data available for<br />
mapping and analysis of any particular unit is directly proportional<br />
to depth below the surface. Thus, the amount of data available the<br />
units varied with depth. Layers in the Devonian and Silurian can<br />
have over 10,000 control points (for example, the Onondaga, Figure<br />
9). The amount of control drops precipitously as the depth to the<br />
formations increases. For the deepest target layer, the Cambrian<br />
basal sandstones, there were only 510 wells deep enough to be used<br />
as control points (Figure 10). The amount and distribution of well<br />
control has a marked effect on the accuracy of the resultant interpolated<br />
surfaces (Table 2).<br />
Other datasets were also used to supplement the point data and to<br />
improve the geologic quality of the maps. In Kentucky, hand-drawn<br />
structure contour and isopach maps were provided for units below<br />
the Knox unconformity. This was mainly because of the complex<br />
normal faulting (Figure 11) associated with the Rome trough (Gao<br />
and others, 2000) and the limitations of computer mapping software<br />
used to portray these areas in a geologically acceptable manner. In<br />
addition, geologic maps from the literature were digitized and used<br />
to constrain interpretations in data-poor portions of the study area<br />
(Figure 12 illustrates one example).<br />
Interpolation Methods<br />
Computer-based and manual interpolation methods were needed<br />
to convert the point data into isoline maps and grids. Each state<br />
chose an interpolation algorithm that gave the best representation<br />
of the geologic layer to be mapped and fit within the individual<br />
software capabilities of each state mapping team (Table 1). For all<br />
methods, the end result was a set of digital isolines that required<br />
considerable manual editing in GIS software to remove edge effects,<br />
to repair errors caused by data scarcity, and to rectify matchup<br />
errors with pre-existing digital surface and near-surface geologic<br />
maps of specific mapped intervals.<br />
Manual Isoline Editing<br />
Considerable manual manipulation of contour lines was needed<br />
to create geologic maps that conformed to both the data and geologic<br />
knowledge. Line editing was generally accomplished digitally<br />
using ArcEdit (a module of ArcGIS). The bulk of the editing was<br />
done to fill in data gaps and to rectify contour line variations as<br />
the lines approached crop lines of those units eroded by surface<br />
processes (Figure 12). More extensive editing and interpretations<br />
were conducted in the faulted areas of Kentucky, especially on the<br />
deeper units (Precambrian thru Rose Run). This mapping, to account<br />
for the structurally complex Rome trough (Figure 6) followed<br />
a separate procedure. Initial isolines were created using Inverse<br />
Distance Weighting in Spatial Analyst (ArcGIS). Next, the contour<br />
lines were manually adjusted to account for known offsets along<br />
the faults. These lines were blended and joined to contours from the<br />
rest of the study area. Final contour intervals were based mainly on<br />
cartographic and ArcIMS display considerations rather than on data<br />
accuracy.<br />
<strong>Geologic</strong> Map Review<br />
Each map was subjected to peer review by various members of<br />
the geologic team. Maps were made available digitally for all members<br />
to review through a web-based comment system. In addition,<br />
two group meetings were held to review large format prints of each<br />
of the maps and to also evaluate each map for geologic correctness<br />
and cartographic quality; noted corrections were applied as needed.<br />
Gridding Method<br />
A consistent method of converting both computer-generated and<br />
hand-edited contour lines back into a grid format is essential for<br />
sequestration capacity modeling, GIS analysis, and cartography.<br />
Capacity calculations and many analyses within the GIS environment<br />
must have the data in grid format, and in some cases, use<br />
grid-to-grid operations. Gridding algorithms for this project must<br />
be able to handle both unfaulted and faulted regions. Two methods<br />
were compared as part of this project. Contours were converted to<br />
a TIN, which, in turn, was converted to a grid using 3-D Analyst<br />
(ESRI, 2005). In the TIN model, contours were modeled as mass<br />
points and faults as hard break-lines. Contours were also converted<br />
to grids using a software package named ANUDEM (version 5.1;<br />
Hutchinson and Gallant, 2000), which combines localized splining<br />
with an ability to introduce vertical discontinuities (cliffs) into the<br />
final grids. Hence, ANUDEM can be used for geological modeling<br />
where faulting can be assumed to be vertical. A comparative<br />
study (Venteris and others, 2005) found that the ANUDEM-based<br />
method was superior to the TIN-conversion method, as long as high<br />
grid-resolutions (
N<br />
16 CHARACTERIZATION OF GEOLOGIC SEQUESTRATION OPPORTUNITIES IN THE <strong>MRCSP</strong> REGION<br />
EXPLANATION<br />
Lockport to Onondaga interval<br />
control points<br />
S I L<br />
O U<br />
U R I<br />
T C R<br />
A N<br />
O P<br />
P R O J<br />
O R<br />
O U T<br />
D O<br />
E C T<br />
V I<br />
C R<br />
C I A<br />
L I<br />
O P<br />
M I T<br />
50 25 0 50 100 150 Miles<br />
50 25 0 50 100 150 200 Kilometers<br />
³<br />
Figure 9.—Map showing the distribution of control points (wells) used for the Lockport to Onondaga interval. This layer has 23,485 wells.
GEOLOGIC MAPPING PROCEDURES, DATA SOURCES AND METHODOLOGY<br />
17<br />
EXPLANATION<br />
Basal Sands interval<br />
control points<br />
P R O J<br />
E C T<br />
L I<br />
M I T<br />
50 25 0 50 100 150 Miles<br />
50 25 0 50 100 150 200 Kilometers<br />
³<br />
Figure 10.—Map showing the distribution of control points (wells) for the Cambrian basal sandstones. This layer has 510 wells.
18 CHARACTERIZATION OF GEOLOGIC SEQUESTRATION OPPORTUNITIES IN THE <strong>MRCSP</strong> REGION<br />
Table 2.—Summary of data and error statistics (5,000-foot grid resolution) for the major regional maps of this project<br />
Mapping Unit<br />
Number Square Cross Validation Grid Error Range of<br />
of Wells Miles/ Well Error (RMSE ft) (RMSE ft) Values (ft)<br />
Basal Cambrian Injection Targets Structure 510 323 595 361 17,210<br />
Basal Cambrian Injection Targets Isopach 373 441 123 100 2,022<br />
Copper Ridge Structure 641 321 385 390 15,691<br />
Copper Ridge Isopach 337 610 658 567 9,751<br />
Rose Run Structure 1,786 40 236 259 17,933<br />
Rose Run Isopach 1,756 41 32 27 611<br />
St Peter Structure 502 162 362 474 10,709<br />
St Peter Isopach 254 321 60 84 1,156<br />
Knox Structure 2,424 77 161 183 13,806<br />
Knox-Silurian Isopach 2,051 90 86 47 5,202<br />
Queenston Structure 11,327 15 74 55 10,431<br />
Medina Structure 6519 13 58 78 9,299<br />
Medina Isopach 6976 12 23 25 627<br />
Oriskany Structure 11724 5 216 154 7,907<br />
Oriskany Isopach 11024 6 21 10 386<br />
lated and are provided as a useful guide when using the maps of this<br />
project. Rigorous measures of map accuracies have been obtained<br />
for most of the major regional-scale maps in this study. Uncertainty<br />
was estimated using the two approaches described below.<br />
How good are the interpolations at unsampled locations<br />
This question was evaluated using geostatistical cross-validation<br />
based on ordinary kriging. Grids that obey well points exactly<br />
may provide a poor prediction at unsampled locations (which is the<br />
majority of the area being considered). Consequently, the surfaces<br />
were estimated by kriging at each point location, but without using<br />
the value at that point. Summary statistics (RMSE) were generated<br />
using the differences between the actual data value at a known point<br />
versus the interpolated (kriged) value at that same point (Table 2).<br />
The resultant RMSE value provide a general estimate of the systematic<br />
and random error of interpolation at unsampled locations. The<br />
value is an average error for the map; actual error at any specific location<br />
on the map can be smaller or larger than the RMSE value. Not<br />
all final maps were created using geostatistics (Table 1); however,<br />
cross validation was calculated for all layers as a method to compare<br />
the strength of geostatistical interpolation between mapped layers.<br />
The results of this analysis are provided in the column labeled<br />
“Cross-validation error” in Table 2.<br />
How accurately do the fi nal grids obey the well values<br />
This question was evaluated by calculating the difference between<br />
the value at the control point (well) and the value of the nearest<br />
calculated grid cell. The result was summarized using the RMSE<br />
method. Faithfulness of the grid (Table 2) was partly a function of<br />
grid cell size, as finer grids were more able to accurately model<br />
complex trends. Analysis found that a cell resolution of 5,000 feet<br />
provided a reasonable compromise between grid accuracy and computational<br />
efficiency (Venteris and others, 2005). However, increasing<br />
the cell resolution to 2,000 feet further reduced grid errors for<br />
many of the map layers; yet there was little to be gained from using<br />
resolutions greater than 2,000 feet. The results of this analysis are<br />
provided in the column labeled “Grid error” in table 2.<br />
Accuracy Discussion<br />
There were considerable differences between the accuracy of the<br />
various structure and isopach surfaces. RMSE values ranged from<br />
10 to 658 feet. Several factors contributed to the uncertainty of the<br />
maps.<br />
1. Accuracy is expected to increase with the number of wells<br />
per unit area. Ultimately, the value and geometry of the point<br />
data have the biggest influence on the final surface produced<br />
by computer interpolation, regardless of the method used. Increased<br />
numbers of data points lead to more robust statistical<br />
prediction.<br />
2. Increased range of data values can have negative and positive<br />
influences on spatial modeling. Large trends in areas of sparse<br />
data result in errors for non-exact interpolators, such as kriging,<br />
that relies heavily on neighboring values. Large trends can<br />
also increase the strength of the prediction model (variogram)<br />
by decreasing the signal to noise ratio.<br />
3. The shape of the surface and the amount of faulting affect<br />
accuracy. Surfaces that are smooth and predictable are easier<br />
to model than those with abrupt discontinuities (faults, breaks<br />
in slope). These discontinuities violate the basic assumptions<br />
of geostatistical interpolation. Also, spatial data often have a<br />
component of spatial variability below the scale of sampling.<br />
The greater this variability (the micro variance component of<br />
the nugget effect), the less the interpolated values will agree<br />
with the proximal data values.<br />
4. The well data set is also a source of error. Individual data points<br />
should be very accurate (within 10 1 feet). However, misidentified<br />
horizons are common and can result in errors greater than<br />
100 feet. Such cases are usually detected by the screening<br />
method and removed.<br />
5. Gridding (ANUDEM) in areas of intense faulting may introduce<br />
additional errors. In areas of a very steep slope (as found<br />
in the Rome trough) small errors in gridding can result in a<br />
large difference between well and grid values.<br />
For this data set, error sources one and two had the most influ-
GEOLOGIC MAPPING PROCEDURES, DATA SOURCES AND METHODOLOGY<br />
19<br />
EXPLANATION<br />
Known Basement Faults<br />
Top of Precambrian surface<br />
Elevation in feet (relative to sealevel)<br />
-2000<br />
-49000<br />
Contours<br />
Pittsburgh-Washington Lineament<br />
Lexington Fault<br />
R o<br />
m e<br />
T r o u g h<br />
50 25 0 50 100 150 Miles<br />
50 25 0 50 100 150 200 Kilometers<br />
³<br />
Figure 11.—Structure map on the top of the Precambrian unconformity illustrating the complexity within the Rome trough area. Hand-contouring was used<br />
within the heavily faulted portions of the Rome trough and computer-based contouring was employed in less faulted areas.
20 CHARACTERIZATION OF GEOLOGIC SEQUESTRATION OPPORTUNITIES IN THE <strong>MRCSP</strong> REGION<br />
EXPLANATION<br />
Allegheny Structural Front<br />
Known Basement Faults<br />
Structure<br />
Elevation feet (relative to sealevel)<br />
-1000<br />
-20000<br />
³<br />
50 25 0 50 100 150 Miles<br />
50 25 0 50 100 150 200 Kilometers<br />
Figure 12.—An example of using a previously published map to aid interpretation in areas with sparse well control. A copy of Figure 7 from Wagner (1975),<br />
showing the elevation of a gamma-ray pick within the Cambrian, was overlain and georeferenced to the <strong>MRCSP</strong> base map with faults for the same interval.<br />
This map was used to aid interpolation and interpretation in data-deficient areas.
GEOLOGIC MAPPING PROCEDURES, DATA SOURCES AND METHODOLOGY<br />
21<br />
ence on the accuracy of the final grids. The correlation coefficient<br />
between cross-validation error and data density was 0.51 and the<br />
coefficient between cross-validation error and the range was 0.39<br />
(for these data, increased range was associated with increased<br />
error). Data density and range were combined in a multi-variate<br />
linear regression model that explained 81 percent of the variance<br />
in cross-validation error and predicted the amount of error within<br />
100 feet (RMSE). The maps could be improved by more well control,<br />
especially in deep and faulted areas of the Rome trough and<br />
Appalachian basin.<br />
Comparisons between cross-validation error and gridding error<br />
provided additional discernment on uncertainty issues. In general, if<br />
the two error measurements showed good agreement, it confirmed<br />
the gridding method was creating surfaces with error levels compatible<br />
with those expected from direct gridding from kriging (block<br />
kriging). However, the gridding error was much smaller for the<br />
Cambrian basal sandstones structure map and showed the improved<br />
fit of the hand-contoured map in the Rome trough area. Yet, such improvement<br />
was not observed on other Lower Paleozoic maps. The<br />
gridding error was much larger than the cross-validation error for<br />
both the Oriskany and Medina structure maps, which were interpolated<br />
using Petra. One possible interpretation was that the gridding<br />
method (ANUDEM) found it difficult to fit the small closed-contour<br />
features present on these maps.<br />
Both the computer interpolation and final gridding routines were<br />
expected to have difficulty in the faulted regions of the study area.<br />
Faults violate the basic assumptions of kriging and are difficult<br />
to represent in a grid. RMSE grid errors were compared between<br />
the faulted areas and the rest of the basin. The faulted areas had<br />
much larger errors in the Cambrian basal sandstones structure and<br />
the Copper Ridge Dolomite isopach maps (Table 3). These layers<br />
contained many wells that occurred directly on faults (the Cambrian<br />
basal sandstones isopach was very thin in the faulted area and had a<br />
small RMSE value). Otherwise, the magnitude of error was similar<br />
for the two regions and the faulted areas did not consistently contain<br />
increased error over the rest of the region (Table 3). However,<br />
the user should be particularly cautious when using the maps in the<br />
faulted regions of the Lower Paleozoic.<br />
METHODOLOGIES FOR OTHER MAPS<br />
Oil and Gas Fields Map<br />
The mapping and compilation of state oil and gas fields maps<br />
into one regional GIS layer for this project has greatly advanced<br />
our ability to assess energy and sequestration resources at regional<br />
and state scales. The map represents the first digital petroleum field<br />
data for the states of Maryland, Michigan, Pennsylvania, and West<br />
Virginia. Moreover, Michigan and Maryland were able to significantly<br />
update their petroleum fields maps, and in Pennsylvania and<br />
West Virginia, their current oil and gas field digitization projects<br />
were completed as a result of the <strong>MRCSP</strong> project. Digital layers<br />
from these states were combined with updated digital maps from<br />
Indiana, Kentucky, and Ohio to make the first seamless regional<br />
map and database of oil and gas fields. The resulting map/GIS layers<br />
will have many uses for CO 2 sequestration, oil and gas exploration<br />
and development, regional planning, general public education,<br />
and uses by other sectors.<br />
Methodologies used in creating and storing oil-and-gas-field<br />
tabular data and field boundary maps differed widely from state to<br />
state. The biggest challenge to making an integrated, regional map<br />
was to conform the tabular field data from each state into a common<br />
Table 3.—Comparison between uncertainty<br />
in faulted and non-faulted areas<br />
Mapping Unit<br />
Faulted Area<br />
(RMSE ft)<br />
format. Ohio Division of <strong>Geologic</strong>al Survey personnel designed a<br />
data structure that allowed tabular attributes to be populated with<br />
data from each state (data tables can be found on the accompanying<br />
GIS CD). The oil and gas fields database contains the basic<br />
attributes necessary for the calculation of CO 2 sequestration potential<br />
(average depth, porosity, thickness). The main challenge in<br />
creating the system was assembling data from geologically similar<br />
units into common regional plays. Common plays were developed<br />
by combining geologic units of similar age and lithology using<br />
the stratigraphic correlation chart created by the <strong>MRCSP</strong> team<br />
as guidance (Figure 5). For instance, the “Clinton”/Medina play<br />
map locally contains fields that produce from the Silurian “Clinton”<br />
sandstone of Ohio (Cataract Group on Figure 5), the Medina<br />
Group sands of Pennsylvania and the Tuscarora Sandstone of West<br />
Virginia (see Figure A7-2).<br />
The methods used to draw the oil-and-gas-field boundaries<br />
(polygons) varied from state to state. The most common method<br />
was to sort the well data by play or individual producing formation,<br />
and draw the field boundaries by hand. Usually a buffer of less than<br />
one-quarter to no more than one-half mile was used to define the<br />
boundary near the outmost wells of a pool or field. Within larger<br />
fields, holes will be found within the interior of the field polygon;<br />
this is where dry holes are encountered, or where producing wells<br />
have been drilled farther apart than the established minimum buffer.<br />
Such hand-drawn maps existed as legacy data for most of the<br />
states and were used as a starting point in Pennsylvania, Indiana,<br />
West Virginia, Kentucky and Ohio—in these instances the field<br />
boundaries were simply digitized and attributed. These new digital<br />
maps can, and are, digitally updated as needed by automatic or<br />
semi-automatic buffering methods (using a GIS package) when<br />
new wells are drilled in Indiana, West Virginia, and Ohio. Field<br />
maps for Michigan were made solely using GIS buffering of the<br />
well locations for <strong>Phase</strong> I, but will be augmented by hand-digitizing<br />
in the future. Field boundaries were merged into a common<br />
GIS layer, but blending of oil-and-gas-field boundaries between the<br />
states was not done. The individual state maps were compiled from<br />
a variety of base maps that were at different scales (see metadata<br />
in the oil-and-gas-fields layer on the accompanying GIS CD); users<br />
should be cognizant of the accuracy differences from state to state<br />
because of this.<br />
Injection Wells<br />
Rest of Basin<br />
(RMSE ft)<br />
Basal Cambrian Injection 754 297<br />
Targets Structure<br />
Basal Cambrian Injection 33 402<br />
Targets Isopach<br />
Copper Ridge Structure 359 401<br />
Copper Ridge Isopach 1,141 332<br />
Rose Run Structure 211 263<br />
Rose Run Isopach 26 27<br />
Knox Structure 130 185<br />
The different injection-well types gathered for the <strong>MRCSP</strong><br />
region are categorized as follows: 1) Class I—hazardous and
22 CHARACTERIZATION OF GEOLOGIC SEQUESTRATION OPPORTUNITIES IN THE <strong>MRCSP</strong> REGION<br />
industrial-waste injection well, 2) Class II—brine injection well,<br />
and 3) Class III—solution mining well. Locating all of these wells<br />
had never been accomplished before by all of the <strong>MRCSP</strong> project<br />
members; this information is usually kept by state or federal regulatory<br />
agencies. However, information about these wells, especially<br />
the Class I and II wells (Figure 13) will be crucial in understanding<br />
the injection characteristics of many of the target formations under<br />
consideration. Therefore, under <strong>Phase</strong> II of the <strong>MRCSP</strong> Partnership,<br />
the geologic team will obtain as much information as possible from<br />
these injection operations.<br />
Salinity Grid<br />
A salinity grid can be generated from mapping, either by direct<br />
interpolation (Kriging etc.) or by exploiting the general relationship<br />
of salinity increasing with depth. Mapping salinity accurately<br />
in this region is difficult because the data needed are not routinely<br />
gathered and submitted to state agencies; therefore the coverage is<br />
sparse. For example, the Mount Simon Sandstone has only 18 measurements<br />
of salinity scattered across the <strong>MRCSP</strong> area. In addition,<br />
formation waters are continuously modified by filtration through<br />
clay membranes, ion exchange reactions, precipitation of minerals,<br />
and by the solutioning of the surrounding rocks (Blatt and others,<br />
1980), causing further uncertainty. For these reasons, a statistical<br />
salinity verses depth model was used to create the salinity grids<br />
used in capacity calculations for this investigation. The model was<br />
constructed from existing sample data using least-squares regression.<br />
Individual models were created for each formation and used<br />
with the overburden (depth) maps to make a continuous salinity<br />
grid for each formation.<br />
Geothermal Gradient and Temperature<br />
Models of the surface temperature and geothermal gradient were<br />
created to calculate the temperature at depth for use in the capacity<br />
calculations. For the surface temperature, the thirty-year average<br />
for over 275 cities was obtained for the conterminous United States<br />
(NOAA, 2000). The temperatures were interpolated into a grid using<br />
a minimum curvature algorithm.<br />
For the geothermal gradient, a number of datasets were investigated.<br />
These datasets included the American Association of<br />
Petroleum Geologists (AAPG) bottom-hole temperature dataset<br />
(AAPG, 1994), the Southern Methodist University (SMU) dataset<br />
(Blackwell and Richards, 2004a), and the 2004 AAPG heat flow<br />
dataset (Blackwell and Richards, 2004b). Each dataset was evaluated<br />
for data quality and spatial distribution. The AAPG heat flow<br />
dataset (Blackwell and Richards, 2004b) was not used because the<br />
data distribution was considered too sparse in the project area—only<br />
three heat flow measurements were for Ohio. The 1994 AAPG geothermal<br />
dataset was unsatisfactory because it was uncorrected for<br />
thermal equilibrium and, when analyzed using spatial statistics, the<br />
spatial variance was quite large. Of those evaluated, the SMU dataset<br />
(Blackwell and Richards, 2004a) was the best for this project because<br />
it combined a good combination of data coverage and quality.<br />
A regional correction was applied, which significantly reduced the<br />
spatial variance. In areas where the SMU dataset was missing data,<br />
such as Pennsylvania, data from the AAPG bottom hole temperature<br />
dataset (AAPG, 1994) was used to augment the SMU dataset. The<br />
augmented SMU dataset was used to create the geothermal gradient<br />
grid for the region using kriging in Geostatistical Analyst.<br />
Screening Maps<br />
The large number of maps, data grids, and calculations generated in<br />
this regional assessment make it difficult for the public, or any other<br />
user, to interpret the various attributes related to CO 2 sequestration<br />
in geologic units in the <strong>MRCSP</strong> study area.. Therefore, the geologic<br />
team has devising several methods to condense the various types of<br />
information contained herein into a smaller number of summary maps<br />
for quick reference, by both technical and non-technical audiences.<br />
Several techniques for creating summary maps were investigated.<br />
Approaches ranging from complex expert systems models, which<br />
codify qualitative geological knowledge numerical algorithms, to<br />
simple screening maps. Because the expert systems models rely<br />
on so much soft information (knowledge rather than data), it was<br />
decided, at this stage in the project, that simple Boolean screening<br />
maps were the best approach to presenting meaningful summaries.<br />
Quantifying geologic knowledge through expert systems approaches<br />
must be done with care and can be time consuming if realistic<br />
algorithms are to be developed. Research into more advanced techniques<br />
will continue in <strong>Phase</strong> II.<br />
A screening/planning map was produced using grids for all deep<br />
saline formations. Structure and isopach grids were reclassified into<br />
binary grids showing where the geology was appropriate and inappropriate<br />
for CO 2 injection, then reclassified to show areas where<br />
overburden thickness was greater than 3,000 feet (using the 2,500-<br />
foot rule of thumb for miscible injection, with 500 feet added to<br />
account for potential map error). Isopach grids were reclassified to<br />
show thicknesses greater than 50 feet. The reclassified grids were<br />
recombined into a single grid showing the number of appropriate<br />
targets and the name of the targets (Figure 14). This map can<br />
also be viewed as a 3-dimensional scene (Figure 15). The map is<br />
presented herein and will be discussed further with various stakeholder<br />
groups, including the partnership sponsors, to elicit input on<br />
its usefulness, clarity, and how it can be improved and added-to for<br />
development in <strong>Phase</strong> II.<br />
DATA STORAGE AND DISTRIBUTION<br />
<strong>Geologic</strong> data for this project is provided in both digital and as<br />
hard copy (paper) map formats. This was done to ensure that the<br />
needs of a wide range of stakeholders were met. The approach<br />
allows information to be distributed to individuals ranging from<br />
sophisticated GIS modelers to non-technical users who just need a<br />
map for a planning meeting.<br />
Data Storage<br />
All GIS data is being stored in a centralized ArcSDE database<br />
maintained by the Ohio Division of <strong>Geologic</strong>al Survey. For geologic<br />
target and confining layers, there are contour and grid data,<br />
geologic unit crop lines, and fault locations stored. Point data used<br />
in mapping are stored as a database containing all formation tops<br />
with a listing of basic well-header data (i.e., well operator, location,<br />
producing formation, well status, etc.). The database also contains<br />
all GIS layers created in this project, including layers from the terrestrial<br />
studies, CO 2 sources, surface digital-elevation model, oil<br />
and gas fields, and the various data and grids needed for capacity<br />
calculations. The database may be queried to obtain data for an<br />
individual geologic layer, by formation, depth, location, or any<br />
combination the user requires.
GEOLOGIC MAPPING PROCEDURES, DATA SOURCES AND METHODOLOGY<br />
23<br />
EXPLANATION<br />
Injection Wells<br />
Class I<br />
Class II<br />
P R O J<br />
E C T<br />
L I<br />
M I T<br />
50 25 0 50 100 Miles<br />
50 25 0 50 100 150 Kilometers<br />
³<br />
Figure 13.—Locations of Class I (hazardous and industrial waste) and Class II (oil field brine) injection wells.
24 CHARACTERIZATION OF GEOLOGIC SEQUESTRATION OPPORTUNITIES IN THE <strong>MRCSP</strong> REGION<br />
EXPLANATION<br />
No Targets with Ideal Thickness and Depth<br />
Basal Cambrian<br />
Copper Ridge<br />
Rose Run<br />
Medina<br />
Oriskany<br />
Wastegate<br />
Basal Cambrian, Copper Ridge<br />
Basal Cambrian, Rose Run<br />
Copper Ridge, St. Peter<br />
Copper Ridge, Rose Run<br />
Copper Ridge, Medina<br />
Rose Run, Medina<br />
Copper Ridge, Oriskany<br />
Medina, Oriskany<br />
Rose Run, Oriskany<br />
Basal Cambrian, Copper Ridge, Rose Run<br />
Basal Cambrian, Copper Ridge, St. Peter<br />
Basal Cambrian, Copper Ridge, Medina<br />
Copper Ridge, Rose Run, Medina<br />
Copper Ridge, Rose Run, Oriskany<br />
Copper Ridge, Medina, Oriskany<br />
Basal Cambrian, Copper Ridge, Rose Run, Medina<br />
Basal Cambrian, Copper Ridge, Rose Run, Oriskany<br />
Basal Cambrian, Copper Ridge, St. Peter, Sylvania<br />
Basal Cambrian, Copper Ridge, Medina, Oriskany<br />
Basal Cambrian, Copper Ridge, Rose Run, Medina, Oriskany<br />
L I M I T O F M<br />
A P P I N G<br />
P R O J E C<br />
T L<br />
I M I<br />
T<br />
50 25 0 50 100 Miles<br />
50 25 0 50 100 150 Kilometers<br />
³<br />
Figure 14.—Screening map summarizing the saline formations. The map shows which saline formation or combination of formations meet the criteria of 3,000<br />
feet or greater overburden thickness and a CO 2 sequestration target-layer thickness greater than 50 feet. Although 2,500 feet of depth is generally used as the<br />
cut-off to keep CO 2 in supercritical state, 3,000 feet is used on this screening map to be conservative and because of the potential large error inherent in mapping<br />
the relatively sparse data associated with some of these geologic units.
GEOLOGIC MAPPING PROCEDURES, DATA SOURCES AND METHODOLOGY<br />
25<br />
Sylvania Sandstone<br />
St. Peter Sandstone<br />
Oriskany Sandstone<br />
2,000 Feet<br />
Medina<br />
Waste Gate<br />
Rose Run<br />
Copper Ridge<br />
Basal Cambrian<br />
-20,000 Feet<br />
Figure 15.—Three-dimensional view (looking from the south) of the screening map presented in Figure 14.
26 CHARACTERIZATION OF GEOLOGIC SEQUESTRATION OPPORTUNITIES IN THE <strong>MRCSP</strong> REGION<br />
Data can be provided to the public as ESRI shape files (vector)<br />
and ESRI grids (Raster). A myriad of other GIS formats exist and<br />
can generally be accommodated. Requests of non-ESRI GIS data<br />
formats will be handled on a case-by-case basis.<br />
Metadata<br />
Metadata was an essential part of this GIS data compilation and<br />
was created for all layers using the Federal Geographic Data Committee<br />
(FGDC) format for guidance. Metadata is provided in html<br />
format and can be read in any standard web browser. The metadata<br />
provides information on the data sources, compilation procedures,<br />
accuracy, projection parameters, and who to contact to ask questions<br />
about or obtain copies of the data.<br />
Web-based Map Browser<br />
An ArcIMS (Internet Mapping System) web-based GIS application<br />
was created to allow the contents of the ArcSDE database to<br />
be browsed using a simple web browser such as Microsoft Internet<br />
Explorer or Netscape. The site allows users to make custom map<br />
views that are flexible as to content and scale. The ArcIMS site provides<br />
a convenient way to inspect the data created and used in this<br />
study and to print the custom maps. The website does not allow the<br />
direct downloading of GIS data; rather, it is envisioned as a tool for<br />
stakeholders to inspect our data holdings. A data request can then<br />
be generated by e-mail or telephone. The universal resource locator<br />
(URL) to visit the site is: http://www.mrcsp.org/.<br />
Other Formats<br />
Hard copy maps of geologic targets and other GIS data are available<br />
as page-sized copies as found elsewhere in this report. Maps are<br />
also available as large format (36" x 36") prints for more detailed<br />
inspection. Maps can be provided as paper copies or as Adobe portable<br />
document format (PDF) files for electronic distribution.<br />
OIL, GAS, AND GAS STORAGE FIELDS<br />
Oil and gas reservoirs can be utilized in two main ways for CO 2<br />
sequestration: 1) the CO 2 can be injected as part of a designed program<br />
to enhance additional oil and/or natural gas production from<br />
the reservoir or 2) the CO 2 can simply be injected into the known<br />
space formerly occupied by oil and/or natural gas in a depleted reservoir.<br />
In the first instance, the oil or gas produced via the program<br />
provides a value-added commodity to the sequestration project. In<br />
the second instance, the injection project is similar to that of injecting<br />
into a saline formation.<br />
The <strong>MRCSP</strong> region contains some of the largest historic oil-andgas-producing<br />
areas in the conterminous United States. The first<br />
commercial oil well was drilled in Pennsylvania in 1859 and the<br />
industry quickly grew and spread to eastern Ohio and northern West<br />
Virginia. These early oil fields were of great significance both to the<br />
birth and development of the oil and gas industry, and to the history<br />
and industrial development of the nation.<br />
The <strong>MRCSP</strong> region, being the site of the beginning of the oil and<br />
gas industry, contains large numbers of wells drilled (many problematic<br />
to locate 100+ years later) prior to regulatory mandates on<br />
the industry. Fortunately, these early, unlocated wells were mostly<br />
rather shallow in depth and should not pose a significant risk for<br />
deeper drilling and injection. However, care must be taken when<br />
evaluating an area for potential older wells mainly because their<br />
existance can provide one of the easiest means for leakage from an<br />
injection reservoir.<br />
With the advent of modern rotary drilling rigs, soon followed<br />
by the development of geophysical logging technology, hydraulic<br />
fracturing methods, and reflection seismic surveys, drilling, starting<br />
in the late 1940s, became progressively deeper in the region as new<br />
targets were explored. Many of the best fields developed during that<br />
era have now been partially or wholly plugged, or are near the end<br />
of their primary productive life.<br />
The <strong>MRCSP</strong> region has produced over 5 billion barrels of oil and<br />
more than 50 trillion cubic feet of natural gas (Table 4). Additionally,<br />
over 1 million wells have been drilled in search of these resources<br />
over the last 150 years (Table 4; Figure 16). The region has seen a<br />
number of “boom and bust” cycles as new plays were discovered,<br />
feverishly drilled, and followed by a period of maximum production<br />
before declining. Overall, the region is considered mature and production<br />
has been in a state of overall decline for decades. However,<br />
most of the production has been from relatively shallow reservoirs;<br />
the potential remains that large reserves may be discovered in deep<br />
untested portions of the region. Additionally, it should be noted that<br />
the majority of the oil and gas fields in the region have not undergone<br />
any type of enhanced recovery operations.<br />
Within the Michigan basin, oil and natural gas are produced<br />
from rocks that range from the Cambrian through Mississippian;<br />
most major production is currently from the Silurian pinnacle-reef<br />
trend around the margin of the basin. The Devonian Antrim Shale is<br />
another major gas producer in the shallow subsurface on the northwestern<br />
margin of the basin. The deepest production in the Michigan<br />
basin is from the Glenwood and Prarie Du Chein Formations in<br />
central Michigan at a depth of 11,500 feet (Michigan Oil and Gas<br />
Association, 1999).<br />
Oil and natural gas have been produced from large regions of the<br />
Appalachian basin from reservoirs ranging in age from the Cambrian<br />
through Carboniferous. The majority of the production has<br />
come from Ordovician through Mississippian carbonate rocks on<br />
the western margin of the basin, and from Silurian through Pennsylvanian<br />
carbonates and clastics in areas of the basin axis. To date,<br />
the deepest natural-gas production occurs from a depth of 14,358<br />
feet and is from the Conasauga Formation in Jackson County, West<br />
Virginia. Recent exploration has focused on deeper Cambrian and<br />
Ordovician carbonate rocks (such as the Beekmantown Dolomite<br />
and Trenton-Black River) and sandy carbonate systems (like the<br />
Rose Run Sandstone) at depths up to 12,000 feet.<br />
The earliest noted production of coalbed methane (CBM) in the<br />
northern Appalachian basin occurred in 1924 in Carroll County,<br />
Ohio. However, CBM production was not sought as an individual<br />
play within the basin until the late 1980s. Since then, hundreds of<br />
wells have been drilled in southwestern Pennsylvania and northern<br />
West Virginia. These wells produce CBM from abandoned coal<br />
mines (GOB or coal mine methane wells), mine ventilation wells<br />
(many drilled years in advance of mining to degas the coal), as well<br />
as from conventional vertical and horizontal wells. CBM is just in<br />
its infancy in the Appalachian region and applying CO 2-enhanced<br />
gas recovery methods, as explained in Chapter 15 of the Appendix,<br />
could significantly increase the amount of natural gas produced<br />
from the reservoirs while sequestering considerable volumes of<br />
anthropogenic carbon dioxide.<br />
Adams (1984) estimated approximately 61 TCF as the original<br />
gas-in-place in coalbeds of the northern Appalachian basin. Rice
OIL, GAS, AND GAS STORAGE FIELDS<br />
27<br />
Table 4.—Summary of oil and gas production, by state, within the <strong>MRCSP</strong> region<br />
State<br />
Year First<br />
Commercial<br />
Production<br />
Total Number Total Number Total Oil Yearly (2004)<br />
of Wells Productive Production Oil Production<br />
Total Gas<br />
Production<br />
(mcf)<br />
Yearly (2004)<br />
Gas<br />
Production<br />
(mcf)<br />
Indiana (northern)* 1886 15,000 400 107,000,000 3,000 * 750,000<br />
Kentucky 1860 250,000 63,190 772,532,160 2,548,105 5,388,675,103 94,258,790<br />
Maryland 1951 220 7 0 0 48,752,678 36,276<br />
Michigan 1925 53284 28720 1,243,000,000 6,393,353 6,643,000,000 193,141,644<br />
Ohio 1860 258,897 216,640 ~1,105,000,000 5,785,338 >8,009,749,438 90,301,118<br />
Pennsylvania 1859 ~350,000 Unknown >1,380,944,000 >1,708,435 >11,026,657,000 >171,042,843<br />
West Virginia 1859 ~150,000 ~135,000 584,024,000 1,474,000 18,650,000,000 201,770,000<br />
*Figures reported for northern Indiana only which is dominated by the historic Trenton oil and gas fi elds.<br />
Because of the age of this drilling, these numbers are estimates and a total gas production fi gure is unknown.<br />
(1995) concluded of this amount, only about 11.5 TCF is technically<br />
recoverable. Recently, Milici (2004) estimated a limited portion of<br />
northern West Virginia and southwestern Pennsylvania contained<br />
reserves of almost 5 TCF of technically recoverable CBM; however,<br />
his assessment did not provide an estimate for the entire northern<br />
Appalachian coalfields. Regardless, based on these numbers, many<br />
regions of the northern and central Appalachian basin contain significant<br />
potential for CBM by enhanced gas recovery methods that use,<br />
and more importantly would sequester, anthropogenic CO 2.<br />
In a typical oil reservoir, primary production techniques (allowing<br />
natural pressures to produce the oil or pumping the well) obtain<br />
only about 10 percent of the total amount of oil trapped. Many<br />
secondary-recovery technologies used to recover additional oil and<br />
gas from reservoirs include waterflooding, reinjection of produced<br />
natural gas, and steam and CO 2 flooding. Different formations respond<br />
differently to various enhanced oil recovery (EOR) methods;<br />
thus, the optimal EOR technology for each reservoir must be decided<br />
after careful study of the reservoir rock and fluid properties.<br />
A model is then developed and a pilot injection project is initiated<br />
to test the model.<br />
The reservoir of a successful EOR project can usually be expected<br />
to produce at least another 10 percent of the original oil-in-place.<br />
Therefore, by widely applying EOR practices in the region, it may<br />
be possible to produce hundreds of millions of barrels of additional<br />
oil that otherwise would stay in the ground unused. Such practices<br />
could also add hundreds of jobs to the region.<br />
Secondary recovery accounts for less than one-half of one percent<br />
of the oil production in Ohio compared to as much as 25 to 50<br />
percent in surrounding states in the Appalachian basin (Blomberg,<br />
1994). Pennsylvania was an early pioneer in secondary recovery<br />
techniques, especially waterfloods. Indeed, by the 1950s as much as<br />
80 percent of the crude oil produced in Pennsylvania was from waterflood<br />
operations (Harper and Laughrey, 1987). Currently, Ohio<br />
has about 64,000-producing oil and gas wells; approximately half of<br />
these are oil stripper wells (producing less than 10 barrels per day).<br />
It has been estimated that 10,000 of these oil wells would benefit<br />
from enhanced oil recovery techniques (Schrider, 1993). Premature<br />
oil-well abandonment results in the loss recovery of many millions<br />
of barrels of oil reserves as well as jobs, and a continued reliance on<br />
foreign oil imports. While water flooding and other methods have<br />
been applied in the region, many with great success, some reservoirs<br />
have not responded favorably to these efforts. Carbon dioxide flooding<br />
technology may work in some of these reservoirs to enhance<br />
recovery, or at least be better than some of the earlier attempted<br />
methods used in the infancy of enhanced recovery technology. Cooperative<br />
efforts between governmental and industrial partnerships<br />
to test and apply CO 2-enhanced recovery technology in the region<br />
may help to impede the declining trend in domestic oil production<br />
and enable the nation to become less dependent on foreign imports.<br />
Carbon dioxide is one of the best mediums used for EOR because<br />
of its unique properties—low temperature and pressure to stay in supercritical<br />
phase, low viscosity, and it is soluble with oil and native<br />
formation fluids. In a typical application, CO 2 is initially injected<br />
into a geologic unit to form a bank that goes into solution with the<br />
naturally occurring oil and brine. Water is then injected behind the<br />
CO 2 bank to help increase formation pressure and push the CO 2/oil<br />
bank away from the injection wells and towards the producing wells<br />
(Figure 17). Alternating cycles of CO 2 and water are repeatedly injected<br />
into the well throughout the life of the EOR project. The CO 2,<br />
in solution with the oil, lessens the viscosity of the oil and aids its<br />
movement through the reservoir porosity system.<br />
Carbon dioxide produced from natural reservoirs has been used<br />
for decades in the southwestern U.S. (Colorado, New Mexico, and<br />
Texas) to enhance local oil field production. Hundreds of miles of<br />
pipelines have been built to transport the CO 2 from these reservoirs<br />
to the producing oil fields. Furthermore, since the early 1980s, over<br />
400 million tons of CO 2 have been purchased from this network and<br />
used to produce approximately 650 million barrels of incremental<br />
oil (Martin, 2002). Yet, there has never been a large, economical<br />
source of CO 2 available in the Appalachian and Michigan basins for<br />
EOR use; thus, this method of enhanced recovery is atypical in the<br />
<strong>MRCSP</strong> region. If large-scale capture of anthropogenic CO 2 comes<br />
to fruition in the <strong>MRCSP</strong> region, it is anticipated a regional network<br />
of pipelines will develop to distribute the CO 2 to candidate oil fields<br />
as well as to appropriate saline storage reservoirs.<br />
Figure 18 illustrates the 10 largest oil and gas fields greater than<br />
2,500-feet deep within the <strong>MRCSP</strong> region. These fields would most<br />
likely be among those first considered for enhanced production<br />
assisted by CO 2 or use as CO 2-storage reservoirs. Table 5 lists the<br />
storage properties and conservative estimates for the amount of CO 2<br />
that may be sequestered within these fields. Although oil and gas<br />
reservoirs in the <strong>MRCSP</strong> region contain less volume capacity compared<br />
to the region’s saline formations, their trapping abilities and<br />
value-added prospects should make them some of the first geologic<br />
units to be utilized for CO 2 sequestration.<br />
In <strong>Phase</strong> II, the <strong>MRCSP</strong> team plans to expand its study of oil and<br />
gas systems in the region by defining those reservoirs best suited for<br />
CO 2 EOR operations, and perhaps implementing at least one EOR
28 CHARACTERIZATION OF GEOLOGIC SEQUESTRATION OPPORTUNITIES IN THE <strong>MRCSP</strong> REGION<br />
EXPLANATION<br />
Gas Fields<br />
Oil Fields<br />
P R O J<br />
E C T<br />
L I<br />
M I T<br />
50 25 0 50 100 150 Miles<br />
50 25 0 50 100 150 200 Kilometers<br />
³<br />
Figure 16.—Oil and gas fields of the <strong>MRCSP</strong> region.
OIL, GAS, AND GAS STORAGE FIELDS<br />
29<br />
Figure 17.—Schematic diagram of a CO 2-enhanced oil recovery operation. A CO 2 pank is introduced to the producing reservoir from<br />
injection wells. The CO 2 pank forms a zone wherein CO 2 is in solution in the oil. Alternating pank of CO 2 and water maintain reservoir<br />
pressure and push the oil bank towards the production well. Any CO 2 that is produced with the oil is separated and typically recycled<br />
into the injection stream (figure from Martin, 2002).<br />
Table 5.—Top ten gas and oil fields (greater than 2,5000 average depth) in the <strong>MRCSP</strong> region based on calculated CO 2-storage capacities<br />
Field Name<br />
State Producing Formation(s)<br />
Avg. Number<br />
Acres Porosity<br />
Thickness CO2 Potential<br />
Depth Wells (ft) (Tonnes)<br />
Natural Gas<br />
St. Marys WV Devonian Shale 3484 321 33,336 0.07 334 364,273,174<br />
South Burns Chapel WV Oriskany & Helderberg 7634 130 64,046 0.08 110 341,464,601<br />
Elk-Poca (Sissonville) WV Oriskany 5032 1121 244,733 0.14 18 329,504,518<br />
Volant PA Medina 6050 353 31,451 0.18 85 310,040,473<br />
North Ellsworth Consolidated OH Clinton 5100 662 108,919 0.078 50 244,852,087<br />
Baltic OH Rose Run 6390 113 84,083 0.098 40 232,384,208<br />
Weston-Jane Lew WV Devonian Sands 3757 845 59,925 0.08 71 227,015,516<br />
Roaring Run PA Devonian Shale 2600 355 21,400 0.11 116 175,907,173<br />
Belington WV Devonian Sands 4169 552 53,877 0.08 74 172,273,607<br />
Conneaut PA Clinton 2800 44 7,151 0.08 1958 157,521,943<br />
Oil<br />
East Canton Consolidated OH Clinton 5300 1290 135,100 0.076 43 501,100,680<br />
Morrow Consolidated OH Copper Ridge 3600 332 138,647 0.08 14 26,452,262<br />
Gore Consolidated OH Clinton 3130 1421 37,057 0.098 15 31,108,749<br />
Sheakleyville PA Medina 4950 62 6,123 0.18 133 95,167,666<br />
Salem-Wallace WV Gordon 2800 2399 39,598 0.12 8 22,652,621<br />
Bear Lake 22 - 23N - 15W MI Niagaran Reef 4542 10 5,317 0.04 154 31,971,830<br />
Blue Lake 18 - 28N - 05W MI Niagaran Reef 6600 7 2,770 0.083 185 47,231,076<br />
Chester 18 - 30N - 02W MI Niagaran Reef 5930 14 7,234 0.08 110 50,019,838<br />
Claybanks 02 - 13N - 18W MI Niagaran Reef 3458 3 2,089 0.052 309 28,773,624<br />
Onondaga 21 A - 01N - 02W MI Niagaran Reef 3700 9 7,256 0.065 128 58,826,167
30 CHARACTERIZATION OF GEOLOGIC SEQUESTRATION OPPORTUNITIES IN THE <strong>MRCSP</strong> REGION<br />
EXPLANATION<br />
Top 10 Gas Fields<br />
Top 10 Oil Fields<br />
P R O J<br />
E C T<br />
L I<br />
M I T<br />
50 25 0 50 100 150 Miles<br />
50 25 0 50 100 150 200 Kilometers<br />
³<br />
Figure 18.—Top-10 oil fields and top-10 gas fields in the <strong>MRCSP</strong> region based on calculated CO 2 sequestration capacity. See Table 4 for field attributes.
OIL, GAS, AND GAS STORAGE FIELDS<br />
31<br />
injection pilot project. Should economical sources of CO 2 become<br />
available to the region, it is imperative that we are prepared to use<br />
this methodology to recover these additional natural resources.<br />
GAS STORAGE<br />
Consumer demand for natural gas is seasonal; higher demand<br />
during extreme cold periods for home heating purposes and lower<br />
demand during the warmer summer months. In general, natural gas<br />
supplies are fairly constant because natural gas distributors utilize<br />
underground gas-storage fields to maintain a reserve of gas for peak<br />
demand periods.<br />
The <strong>MRCSP</strong> region has more natural gas storage potential than<br />
any other region of the country. In fact, four of the top seven states<br />
in gas storage capacity are in the region (Figure 19)—Michigan<br />
is the national leader. These statistics unequivocally indicate the<br />
region contains exceptional geological formations for the underground<br />
storage of both natural gas and CO 2, for that matter.<br />
Most of the region’s storage fields (Figure 20) were once producing<br />
gas fields. Later, many of these fields were converted to storage<br />
reservoirs by drilling wells designed specifically for injection operations<br />
and also by building pipeline and compressor station infrastructures<br />
to support the conversion. Gas storage fields are designed<br />
to allow the entire amount of working gas to be cycled in and out of<br />
the field once each year. Typically, the storage fields are filled from<br />
pipelines in the summer months for withdrawal when demand peaks<br />
in the winter months.<br />
The gas storage fields provide an excellent analogue for study<br />
when examining CO 2 storage. By analyzing these fields, we can<br />
better model the amount of CO 2 that can be stored in similar strata<br />
or reservoirs, and learn more about the injectivity rates that different<br />
reservoirs can be expected to handle. Such investigations will<br />
allow us to better forecast how many wells, and over what size of<br />
an area, will be needed for a specific CO 2 project. Furthermore, gas<br />
storage fields may be a viable means for future use as CO 2 storage<br />
fields—either permanent storage from a large CO 2 source, or as a<br />
CO 2 buffer operation for a larger CO 2 EOR operation. Occasionally<br />
a gas storage field will be offered for sale. Any future CO 2 producer<br />
or EOR operator might find purchasing such a field cost efficient for<br />
storage of CO 2, especially if the preexisting infrastructure could be<br />
used. The <strong>MRCSP</strong> <strong>Phase</strong> II project will examine storage fields in<br />
greater detail for these reasons.<br />
<br />
<br />
<br />
<br />
<br />
<br />
<br />
<br />
<br />
<br />
<br />
<br />
<br />
<br />
<br />
<br />
<br />
<br />
<br />
<br />
<br />
<br />
<br />
<br />
<br />
<br />
<br />
<br />
<br />
<br />
<br />
<br />
<br />
<br />
<br />
<br />
<br />
<br />
Figure 19.—Gas storage capacity and ranking by state with <strong>MRCSP</strong>-member states highlighted. Data source: Natural Gas<br />
Monthly, 2002.
32 CHARACTERIZATION OF GEOLOGIC SEQUESTRATION OPPORTUNITIES IN THE <strong>MRCSP</strong> REGION<br />
EXPLANATION<br />
Gas Storage Fields<br />
P R O J<br />
E C T<br />
L I<br />
M I T<br />
50 25 0 50 100 150 Miles<br />
50 25 0 50 100 150 200 Kilometers<br />
³<br />
Figure 20.—Location of gas storage fields in the <strong>MRCSP</strong> region.
CO 2-SEQUESTRATION STORAGE CAPACITY FOR THE <strong>MRCSP</strong> PROJECT<br />
33<br />
CO 2 -SEQUESTRATION STORAGE CAPACITY FOR THE <strong>MRCSP</strong> PROJECT<br />
CO 2-STORAGE MECHANISMS IN<br />
GEOLOGIC FORMATIONS<br />
Carbon dioxide sequestration in geologic strata relies upon a<br />
number of different storage mechanisms that are based on sitespecific<br />
geologic conditions. Based on the geologic sequestration<br />
research conducted over the last decade by a number of researchers,<br />
these mechanisms are now fairly well described in published<br />
papers and proceedings of conferences such as the Greenhouse<br />
Gas Control Technology (GHGT) series organized by the International<br />
Energy Agency Greenhouse Gas R&D Programme (see<br />
www.ieagreen.org.uk for conference proceedings information) or<br />
in the Special <strong>Report</strong> on Carbon Dioxide Capture and Storage prepared<br />
by the Intergovernmental Panel on Climate Change (IPCC)<br />
(e.g. Houghton and others, 1996; 2001). The commonly discussed<br />
storage mechanisms are volumetric storage, solubility storage,<br />
adsorption storage, and mineral storage. Volumetric storage refers<br />
to the amount of CO 2 that is retained in the pore space of a geologic<br />
unit, generally as a supercritical phase retained by structural<br />
or stratigraphic traps or by the overlying cap-rock layers. Solubility<br />
storage involves dissolution of a part or all of the CO 2 into the<br />
formation waters of the geologic unit. Adsorption storage involves<br />
the holding of CO 2 molecules onto the fracture faces and into the<br />
matrix of organic-rich rock units, such as coal or black shale. Mineral<br />
storage involves the chemical reaction of CO 2 with the minerals<br />
and brine in the geologic unit. Under appropriate conditions, some<br />
chemical reactions may form a solid precipitate, permanently binding<br />
the carbon to the geologic unit. Mineral storage is not investigated<br />
as part of this report because the complex nature of the reactions<br />
and the uncertainty in reaction rates makes it difficult to determine<br />
the storage volumes on a regional scale. In addition to the types of<br />
formations and storage mechanisms evaluated in this report, basalt<br />
layers and salt caverns are also potential repositories for CO 2-storage;<br />
however, due to the early state of research for these options,<br />
they were not evaluated at this time for <strong>MRCSP</strong> region.<br />
CO 2 PROPERTIES<br />
Before the description of the calculation methods used for CO 2-<br />
storage capacity determinations can begin, it is important to briefly<br />
review the physical properties of CO 2, since these physical properties<br />
affect how much CO 2 can be placed into storage. The phase behavior<br />
of CO 2 is well understood and can be found in general chemical<br />
references such as Lemmon and others (2003) or in literature on enhanced<br />
oil recovery (e.g., Jarrell and others, 2002). Carbon dioxide<br />
can exist as four different phases (Figure 21), as a solid, liquid, gas,<br />
or as a super-critical gas. The triple point for solid, liquid, and gas<br />
is at -69.826º F (-56.57º C) and 75.2020672 psia (0.5185 MPa). At<br />
temperatures greater than 87.8º F (31.1º C) and pressures greater than<br />
1,071 psia (7.38 MPa), CO 2 is in a super-critical state, behaving similar<br />
to a gas by filling all available space, while having the density of a<br />
liquid. Using typical parameters for the <strong>MRCSP</strong> area, such as a geothermal<br />
gradient of 0.01º F/ft (0.0182º C/m), a surface temperature of<br />
56º F (13.33º C), and a pressure gradient of 0.433 psia/ft (9,792.112<br />
Pa/m), a line representing the typical pressures and temperatures with<br />
depth can be superimposed on the phase diagram (Figure 21). This<br />
line shows that at shallow depths (less than ~2,500 ft), CO 2 would be<br />
stored in a gaseous phase, while at deeper depths (greater than ~2,500<br />
ft), most of the CO 2 will be in the super-critical gas phase, with some<br />
storage as a liquid. The recognition of the super-critical gas phase is<br />
important since, under most geologic storage scenarios being evaluated,<br />
CO 2-storage will occur as a super-critical gas.<br />
<br />
<br />
<br />
<br />
<br />
<br />
<br />
<br />
<br />
<br />
<br />
<br />
<br />
<br />
<br />
<br />
<br />
<br />
<br />
<br />
<br />
<br />
<br />
<br />
<br />
<br />
<br />
<br />
<br />
<br />
<br />
<br />
<br />
<br />
<br />
<br />
<br />
<br />
<br />
<br />
<br />
<br />
<br />
<br />
<br />
<br />
Figure 21.—CO 2 phase diagram. The triple point for CO 2 occurs at -69.826°F (-56.57°C)<br />
and 75.202 psia (0.518 MPa) (Lemmon and others, 2003). The super-critical gas phase<br />
occurs at 87.8°F (31.1°C) and 1,071 psia (7.38 MPa). The dashed line represents typical<br />
reservoir conditions in the <strong>MRCSP</strong> area.
34 CHARACTERIZATION OF GEOLOGIC SEQUESTRATION OPPORTUNITIES IN THE <strong>MRCSP</strong> REGION<br />
One of the most important properties for the sequestration of<br />
CO 2 is density. In Figure 22, temperature is plotted against pressure<br />
and density. At low pressures, similar to conditions in shallow<br />
reservoirs, CO 2 density is low, so the relative volume of a<br />
given amount of CO 2 will be large. Hence, at low pressure, low<br />
temperature, and low density, the amount of CO 2 that could be<br />
stored in a given space will be relatively low. At increasing depths,<br />
density rapidly increases as CO 2 changes phase to first a liquid and<br />
then a super-critical gas. In fact, the density of CO 2 at standard<br />
temperature and pressure is only 0.1124 lbs/ft 3 (1.8 kg/m 3 ) while<br />
the density at the critical point is 29.09 lbs/ft 3 (466 kg/m 3 )—an increase<br />
of about 260 times! At very high pressure and temperature<br />
conditions found in very deep geologic layers the density of CO 2<br />
may be as high as 62.43 lbs/ft 3 (1000 kg/m 3 ). Thus, the amount of<br />
CO 2 that can be stored in the liquid or super-critical gas phases, in<br />
a given space, will be several hundred times larger than storing it<br />
in the gaseous phase. Figure 23 illustrates how the density of CO 2<br />
increases with increasing depth (temperature and pressure increase<br />
with depth), using typical temperature and pressure parameters for<br />
the <strong>MRCSP</strong> area —geothermal gradient (0.01º F/ft (0.0182º C/m)),<br />
surface temperature (56º F (13.33º C)), and pressure gradient<br />
(0.433 psia/ft (9,792.112 Pa/m))—which corresponds to an assumption<br />
of a freshwater gradient. At shallow depths, CO 2 is in<br />
a gaseous phase, so its density is low. As the depth increases to<br />
approximately 2,500 ft (762 m) below surface, the density rapidly<br />
increases because the CO 2 changes phase to a liquid and then a super-critical<br />
gas. This high density at depth provides a much larger<br />
storage capacity than the gas-phase storage and is the primary<br />
reason that 2,500 ft (762 m) is considered to be the approximate<br />
minimum depth for CO 2-storage.<br />
The primary reason why the petroleum industry is interested<br />
in injecting CO 2 is because its physical properties make it a good<br />
media for enhancing the recovery of oil. Where CO 2 injection has<br />
already been used for secondary recovery, for example in Texas, it<br />
has been used as either a liquid or super-critical gas, and its density<br />
and viscosity make it ideal for enhanced oil recovery (Jarrell and<br />
others, 2002). The density of CO 2 is similar to that of oil, but its<br />
viscosity is lower.<br />
For the storage of CO 2 in brine solution, it is important to examine<br />
the physical properties of CO 2 in solution. Figure 24 shows that<br />
the solubility of CO 2 in fresh water increases with decreasing temperature<br />
and increasing pressure (Jarrell and others, 2002). Conversely,<br />
CO 2 solubility decreases with increasing salinity as shown<br />
in Figure 25 (Jarrell and others, 2002). NaCl is used here as a proxy<br />
for overall brine compositions. For example, Figure 25 shows a<br />
more than a 50 percent reduction in solubility as salinity increases<br />
to 200,000 parts per million. Because high salinity brine is likely<br />
to be present in most deep geologic storage reservoirs, especially<br />
in the <strong>MRCSP</strong> region, solubility related storage will not provide a<br />
large fraction of the total storage capacity in the short-term. Slowly,<br />
over time, the CO 2 will dissolve into the brine-bearing formation<br />
fluids. However, the rate of this dissolution and concurrent mineralization-based<br />
storage will be controlled by the total salinity,<br />
reaction rates, and the slow hydrodynamic flow in these layers that<br />
will inhibit mixing.<br />
In order to correctly model the density of CO 2 in the <strong>MRCSP</strong><br />
area, it was necessary to understand the distribution of the fluid<br />
pressure gradient, surface temperature, and geothermal gradient.<br />
For the fluid pressure gradient, a value of 0.433 psia/ft (9,792.112<br />
Pa/m) was used for the entire region. This value was calculated from<br />
a fresh water pressure gradient, because adequate data is not regionally<br />
available to determine brine density with depth in the <strong>MRCSP</strong><br />
project area. Limited numbers of available data indicate a pressure<br />
gradient range of 0.38 to 0.48 psi/ft (8,595 Pa/m to 10,858 Pa/m)<br />
is representative of the region (Gupta and others 2004a; Gupta and<br />
Bair 1997; Russell, 1972). Using these relationships and the temperature<br />
and pressure grids described earlier in this report, the CO 2<br />
density at any particular depth is calculated.<br />
<br />
<br />
<br />
<br />
<br />
<br />
<br />
<br />
<br />
<br />
<br />
<br />
<br />
<br />
<br />
<br />
<br />
<br />
<br />
<br />
<br />
<br />
Figure 22.—Diagram for CO 2 of different temperature curves plotted against pressure and density. CO 2 density<br />
data from Lemmon and others (2003).
CO 2-SEQUESTRATION STORAGE CAPACITY FOR THE <strong>MRCSP</strong> PROJECT<br />
35<br />
<br />
<br />
<br />
<br />
<br />
<br />
<br />
<br />
<br />
Figure 23.—Diagram showing CO 2 density with<br />
depth for a typical pressure gradient, surface temperature,<br />
and geothermal gradient in the <strong>MRCSP</strong><br />
area. CO 2 density data from Lemmon and others<br />
(2003).<br />
<br />
<br />
<br />
Figure 24.—Solubility of CO 2 in fresh water. Data<br />
from Jarrell and others (2002).<br />
<br />
<br />
<br />
<br />
<br />
<br />
<br />
<br />
<br />
<br />
<br />
<br />
<br />
<br />
<br />
<br />
<br />
<br />
<br />
<br />
<br />
<br />
<br />
<br />
<br />
<br />
Figure 25.—Diagram showing the decrease in CO 2<br />
solubility with increasing salinity. Data from Jarrell<br />
and others (2002).
36 CHARACTERIZATION OF GEOLOGIC SEQUESTRATION OPPORTUNITIES IN THE <strong>MRCSP</strong> REGION<br />
ESTIMATING STORAGE CAPACITIES<br />
Calculation of the storage capacities in various geologic formations<br />
has been attempted by a number of research projects during<br />
the last ten years. However, despite these efforts, there is no<br />
single accepted methodology for determining capacities at local,<br />
regional, basin, or global scales. The estimates in existing studies<br />
vary over a large range. This uncertainty is a result of the lack of<br />
detailed geologic data on formation thickness, lithology, pressure,<br />
fluid density, salinity, etc., for most of the sedimentary basins, except<br />
in areas where extensive oil and gas exploration has occurred.<br />
Almost of all of the methods involve estimating the total pore<br />
volume for the subject formation and using an assumption for the<br />
storage efficiency and mechanism to evaluate the fraction of the<br />
total capacity that may be available for actual storage. An early estimate<br />
of the global storage capacity developed by Hendricks and<br />
Blok (1993) ranges from 400 to 10,000 gigatonnes of CO 2. Similarly,<br />
Bergman and Winter (1995) estimated U.S. saline-reservoir<br />
storage capacity ranges from 5 to 500 gigatonnes of CO 2. Several<br />
other approaches are cited in the following sections. In addition<br />
to the regional rock volume-based approaches, detailed reservoir<br />
simulations (e.g. Gupta and others 2004a) have also been used to<br />
more accurately determine site-specific storage and injection rates.<br />
Such detailed studies based on site characterization (e.g., Gupta<br />
and others, 2004b) will certainly be a requirement for actual project<br />
implementation. The following sections discuss the methods<br />
used in this study for estimating total pore volumes and possible<br />
storage capacity for volumetric, solubility, and adsorption-based<br />
storage in the <strong>MRCSP</strong> region.<br />
Volumetric Storage<br />
Storage of CO 2 in pore spaces as a free phase is herein referred to<br />
as volumetric storage. The CO 2 is injected into the geologic unit and<br />
occupies some portion of the pore space. For the saline formations<br />
in the <strong>MRCSP</strong> project, it is initially assumed that CO 2 will completely<br />
displace the brine pore waters. While not realistic, it does<br />
give the maximum amount of CO 2 that can be placed into storage. A<br />
wide range of factors, including reservoir chemistry, heterogeneity,<br />
cementation, and structure, will further constrain the actual amount<br />
of CO 2 that can be stored at any site. For depleted oil-and-gas fields,<br />
it is assumed that there is residual-water saturation occupying pore<br />
space, which decreases the amount of pore space available for CO 2<br />
to occupy. The volumetric capacity calculation is modified to reflect<br />
the residual-water saturation.<br />
Injection into the geologic unit’s pore space will initially displace<br />
the pore fluids. These pore fluids include brine waters, oil, and gas.<br />
The injection will initially be as a separate phase of CO 2 liquid or<br />
super-critical gas. Only over a long period of time will CO 2 dissolve<br />
into the formation fluids and possibly react with the matrix<br />
and formation fluids to precipitate carbonate minerals. In addition,<br />
the amount of CO 2 that dissolves into the pore fluids will be limited<br />
by the temperature and salinity of the fluid. Due to the long time<br />
intervals for the CO 2 to react with the geologic unit and its formation<br />
fluids, volumetric storage will be the primary storage mechanism<br />
considered for the CO 2-sequestration capacity calculations.<br />
The general equation for volumetric storage CO 2-sequestration<br />
capacity essentially provides an estimate of the total pore volume<br />
in the formation:<br />
Q CO2 = ½ CO2 *µ *Vb (1)<br />
where:<br />
Q CO2 = CO 2-sequestration capacity for total pore volume<br />
½ CO2 = Density of CO 2 under reservoir conditions<br />
µ = Porosity<br />
Vb = Bulk reservoir volume<br />
For the <strong>MRCSP</strong> project, the equation is slightly modified, due to<br />
the use of English units of measurement, to:<br />
Q CO2 = ½ CO2 *µ *A *H / 2200 (2)<br />
where:<br />
Q CO2 = CO 2 sequestration capacity (metric tonnes)<br />
½ CO2 = Density of CO 2 under reservoir conditions (lbs/ft 3 )<br />
µ = Porosity (%)<br />
A = Area (ft 2 )<br />
H = Thickness of the geologic sequestration unit (ft)<br />
2200 = Conversion from lbs to metric tonnes<br />
Other variations of this volumetric approach have been used by<br />
Van der Straten (1996) to estimate saline-reservoir capacity in Europe<br />
and by Gupta and others (1999; 2001) to estimate storage capacities<br />
for the Mt. Simon Sandstone and the Rose Run sandstone in<br />
the U.S. Both of these use factors such as storage efficiency (6 percent)<br />
and net-to-gross-ratios to adjust the calculated pore volumes.<br />
The calculations for the saline formations were conducted using<br />
GIS software, using the raster-based Spatial Analyst extension of<br />
the ArcGIS software system. The general procedure for performing<br />
the calculations is to first create a structure contour grid and an isopach<br />
grid for the saline formation sequestration unit (Venteris and<br />
others, 2005). The structure elevation grid is then subtracted from a<br />
surface DEM grid to obtain a depth grid. This depth grid is used to<br />
obtain the pressure and temperature of the saline formation at depth.<br />
The reservoir pressure is obtained by multiplying the fresh water<br />
pressure gradient of 0.433 psia/ft (9,792.112 Pa/m) with the depth<br />
grid, which results in the formation fluid pressure at depth. To obtain<br />
the reservoir temperature, the geothermal gradient grid is multiplied<br />
with the depth and the surface temperature grid is added to this result.<br />
Using a custom-created macro (modified from Radhakrishnan<br />
and others, 2004) to determine the CO 2 density from a database<br />
table, these new reservoir pressure and temperature grids are then<br />
used, along with the isopach grid and the average porosity for the sequestration<br />
unit, to calculate the CO 2-sequestration capacity. For the<br />
saline formations, the resultant CO 2 capacity grid can be displayed<br />
(for example, see Figure 26) to illustrate where any particular unit<br />
has higher and lower capacity potential.<br />
Volumetric sequestration capacity in depleted oil-and-gas fields<br />
has an equation similar to the saline formation capacity calculation,<br />
except that the volumetric capacity calculation is modified to<br />
reflect the residual-water saturation. The residual-water saturation is<br />
expected to reduce the amount of pore space initially available for<br />
CO 2 to occupy.
CO 2-SEQUESTRATION STORAGE CAPACITY FOR THE <strong>MRCSP</strong> PROJECT<br />
37<br />
EXPLANATION<br />
Faults<br />
Cropline<br />
Structural Front Line<br />
CO 2 Sequestration Potential<br />
Metric Tonnes Per Grid Cell<br />
99,500,000<br />
1,250,000<br />
S I<br />
E R O<br />
O N<br />
A L<br />
R o s e<br />
R<br />
R u<br />
E M<br />
n S<br />
N A N T S<br />
p<br />
u b c r o<br />
D A T A<br />
S T R U C T U<br />
R A L<br />
F<br />
R O<br />
N T<br />
L I N E<br />
PROJECT LIMIT<br />
I N<br />
S U F<br />
F I C<br />
I E N T<br />
50 25 0 50 100 Miles<br />
³<br />
50 25 0 50 100 150 Kilometers<br />
Figure 26.—Rose Run sandstone CO 2-sequestration capacity results from grid-to-grid and table look-up operations. Grid cells are 10,000-feet 2 (3.587 sq. mi.).
38 CHARACTERIZATION OF GEOLOGIC SEQUESTRATION OPPORTUNITIES IN THE <strong>MRCSP</strong> REGION<br />
Q CO2 = ½ CO2 *µ *A *H (1 - S W) / 2200 (3)<br />
where:<br />
Q CO2 = CO 2 sequestration capacity (metric tonnes)<br />
½ CO2 = CO 2 density (lbs/acre-ft)<br />
µ = Porosity (%)<br />
A = Area (acres)<br />
H = Net thickness (ft)<br />
S W = Water saturation (%)<br />
2200 = Conversion from lbs to metric tonnes<br />
The calculation methodology used for oil-and-gas fields is different<br />
than the method used for saline formations. The calculations are<br />
conducted using database techniques, as opposed to the calculations<br />
being conducted in a GIS using raster-modeling techniques. The<br />
reservoir temperature, pressure, thickness, porosity, and irreducible-water<br />
saturation for the oil and gas field are calculated from<br />
available data for the wells that are associated with the oil-and-gas<br />
pool or field. The assumptions for missing temperature and pressure<br />
data, which are incorporated in equations (4) and (5), is a surface<br />
temperature of 61 o F (16.11º C), geothermal gradient of 0.007º F/ft<br />
(0.01276º C/m), and hydrostatic pressure gradient of 0.433 psi/ft<br />
(9,792.112 Pa/m). The assumptions for missing thickness, porosity,<br />
and irreducible-water saturation data are located in Table 6.<br />
T (F) = 61 + 0.007 (F/ft) x depth (ft) (4)<br />
P (psia) = 0.433 (psi/ft) x depth (ft) (5)<br />
The area for the pool or field is taken from the polygon area from<br />
the oil-and-gas fields GIS, with the unit of measurement converted<br />
from ft 2 to acres. Once all the information on the oil and gas field has<br />
been populated in a database table, the calculations are performed.<br />
The reservoir pressure and temperature are used, as part of an SQL<br />
look-up, to find the density of CO 2 in the reservoir. Density along<br />
with the other reservoir parameters of thickness, porosity, irreducible-water<br />
saturation, and area of the oil and gas pool or field, are<br />
then used to calculate the CO 2-sequestration capacity of the oil and<br />
gas field.<br />
The equations used in this section provide an estimate of the total<br />
pore volume available for storage. The actual volume of storage<br />
will depend on factors such as storage efficiency, porosity, and netto-gross-ratio.<br />
Each of these factors will reduce the amount of CO 2<br />
that can be sequestered at any specific site, so the total pore volume<br />
needs to be further adjusted for these factors. Tables 7 through 22<br />
show the total CO 2-sequestration capacity at the 10 percent level.<br />
Table 6.—Assumptions for missing data in oil-and-gas<br />
fi eld CO 2-sequestration calculations<br />
Formation<br />
Net Thickness Porosity Sw<br />
(ft) (%) (%)<br />
Clinton sandstone 18 8 5<br />
Trenton Limestone 12 10 5<br />
Beakmantown dolomite 10 15 5<br />
Rose Run sandstone 35 8 5<br />
Copper Ridge sandstones 13 9 5<br />
Copper Ridge dolomite 13 8 5<br />
Krysik Sandstone 14 14 5<br />
Knox “B” zone 14 6 5<br />
This is an estimate of the amount of CO 2 that will ultimately occupy<br />
the pore space. Modeling studies by van der Meer (1995) and<br />
Holt and others (1995) have predicted storage efficiencies ranging<br />
from 1to 6 percent (van der Meer, 1995) to 30 percent (Holt and<br />
others, 1995). Thus, the 10-percent total sequestration-capacity<br />
represents an estimate that the <strong>MRCSP</strong> project anticipates is<br />
more realistic for the actual amount of CO 2 that could actually be<br />
sequestered in the region’s reservoirs. Given the spatial variability<br />
in parameters and the lack of detailed data on the deep formations,<br />
for the purpose of the current study, it is assumed that 10 percent of<br />
the pore volume in these will be available for actual storage within<br />
any individual reservoir.<br />
Solution Storage<br />
Carbon dioxide can dissolve into formation fluids, but it is expected<br />
that large amounts of solubility storage will only occur over<br />
long time periods due to high salinity, extremely slow mixing rates<br />
in the deep formations, limited interaction face between the CO 2<br />
plume and surrounding brine, and slow solution rates. For example,<br />
Gupta and others (2004a) used compositional reservoir simulations<br />
for CO 2 injection in the Mt. Simon Sandstone to show that over a period<br />
of 500 years, only 8 percent of the total CO 2 injected has moved<br />
into dissolved phase. As stated above, most salinity measurements<br />
of potential storage reservoirs within the <strong>MRCSP</strong> are very high<br />
(CO 2 solubility is inversely proportional to salinity). Because of the<br />
low solution rates, high salinities, and generally increasing salinities<br />
with depth in the <strong>MRCSP</strong> area, solubility calculations were not<br />
performed systematically for the <strong>Phase</strong> I project. Nonetheless, one<br />
representative solution calculation was performed for comparison<br />
purposes, and that is described in the Discussion of Results section.<br />
For completeness, however, the calculation methodology for solution<br />
storage is covered here.<br />
One method of calculating the capacity of CO 2 that can dissolve<br />
into formation fluids is derived from Carr and others (2003).<br />
Q CO2 = 1.1023* ((7758* (µ *A *H) *S CO2 *B CO2)/(1000 * 17.25)<br />
(6)<br />
where:<br />
Q CO2 = CO 2-sequestration capacity (metric tonnes)<br />
7758 = Conversion from acre * ft to bbl.<br />
µ = porosity (%)<br />
A = area (acres)<br />
H = thickness (ft)<br />
S CO2 = CO 2 solubility in fresh water (SCF/bbl water)<br />
B CO2 = CO 2 solubility in brine (%)<br />
1000 = Conversion from ft 3 to MCF<br />
17.25 = Conversion from MCF to short tons<br />
1.1023 = Conversion from short tons to metric tonnes<br />
The values for CO 2 solubility in fresh water and CO 2 solubility in<br />
brine are derived from Jarrell and others (2002). To determine the<br />
CO 2 solubility in fresh water and CO 2 solubility in brine, the reservoir<br />
temperature, pressure, and salinity (NaCl in ppm) are needed.<br />
Reservoir temperature and pressure are used to determine CO 2 solubility<br />
in fresh water using a database look-up table. The salinity data<br />
is used in a database look-up table to determine the CO 2 solubility in<br />
brine. The CO 2 solubility in brine is multiplied by the CO 2 solubility<br />
in fresh water to determine the CO 2 solubility in the formation fluids<br />
(Jarrell and others, 2002).
CO 2-SEQUESTRATION STORAGE CAPACITY FOR THE <strong>MRCSP</strong> PROJECT<br />
39<br />
Table 7.—Summary of estimated effective CO 2-storage capacity by geologic interval or reservoir type (in gigatonnes)<br />
Sequestration Target Porosity (%) Density (g/cc)<br />
Gas Content<br />
(scf/ton)<br />
Area (mi 2 )<br />
Total<br />
Oil and Gas Fields 2.51<br />
Waste Gate Formation 10 1,342 4.38<br />
Coal beds (net thickness) 1.32 100 25,578 0.25<br />
Antrim and Ohio shales 2.62 42.9 109,043 45.3<br />
Needmore Shale 2.62 42.9 850 0.05<br />
Sylvania Sandstone 10 25,324 15.11<br />
Oriskany Sandstone 10 57,313 19.43<br />
Medina/Tuscarora SS 8 72,328 70.53<br />
St. Peter Sandstone 10 41,796 88.13<br />
Rose Run sandstone 8 57,493 49.27<br />
Potsdam Sandstone 2 9,298 1.71<br />
Conasauga Formation 2 24,973 4.25<br />
Rome trough sandstones 1 18,452 1.23<br />
Mt. Simon Formation 8 85,916 217.18<br />
Total 519.35<br />
Table 8.—Estimated effective CO 2-storage capacity<br />
by reservoir type and state (in gigatonnes)<br />
State Saline Coal Shales Oil & Gas Total<br />
Eastern Indiana 80.7 0 0 0.01 80.7<br />
Eastern Kentucky 10.9 0.02 1.7 0.65 13.2<br />
Maryland 9.5 0 0.009 0 9.5<br />
Michigan 216.1 0 4.2 0.05 220.3<br />
Ohio 37.3 0.04 8.5 0.4 46.3<br />
Pennsylvania 75.6 0.08 12.0 0.8 88.5<br />
West Virginia 41.1 0.11 19.0 0.6 60.8<br />
Total 471.2 0.25 45.4 2.5 519.3<br />
Table 9.—Oil and gas fi elds. Estimated CO 2-<br />
storage capacity by state (in gigatonnes)<br />
State<br />
2500<br />
Feet Feet<br />
Eastern Indiana 0.006 0.008<br />
Eastern Kentucky 0.009 0.644<br />
Michigan 0.046 0.003<br />
Ohio 0.366 0.053<br />
Pennsylvania 0.455 0.310<br />
West Virginia 0.533 0.082<br />
Total 1.415 1.100<br />
The calculations for the saline formations were conducted using<br />
GIS software, in a very similar methodology as with the volumetric<br />
calculations. The general procedure for performing the calculations<br />
is to first create a structure contour grid and an isopach grid for the<br />
saline formation sequestration unit (Venteris and others, 2005). The<br />
structure elevation grid is then subtracted from a surface DEM grid<br />
to obtain a depth grid. This depth grid is used to obtain the pressure<br />
and temperature of the saline formation at depth as discussed earlier.<br />
A custom created macro (modified from Radhakrishnan and others,<br />
2004) is used to determine the CO 2 solubility in fresh water from a<br />
database table using the temperature and pressure, and the salinity is<br />
used to determine the CO 2 solubility in brine from a database table.<br />
These solubility values are then used, along with the isopach grid<br />
and the average porosity for the sequestration unit, to calculate the<br />
CO 2-sequestration capacity.<br />
The salinity grid construction was discussed previously in the<br />
methods sections. For the representative calculation performed as<br />
part of the <strong>MRCSP</strong> project, a least-squares relationship was calculated<br />
for the salinity value taken from the geologic unit being modeled,<br />
which in this case, was the Mount Simon Sandstone. The resulting<br />
equation was then used to calculate the CO 2 solubility in brine.<br />
Other solubility-based approaches for capacity estimates include<br />
those by Bachu and Adams (2003) for the Alberta basin; Brennan
40 CHARACTERIZATION OF GEOLOGIC SEQUESTRATION OPPORTUNITIES IN THE <strong>MRCSP</strong> REGION<br />
and Burruss (2003) developed a solubility- and saturation-based<br />
approach, which, as an example, was used to estimate the storage<br />
capacity in the U.S. and Canada by Dooley and others (2004).<br />
Adsorption Storage<br />
CO 2 sequestration in organic-rich rock units, such as coal beds and<br />
black shales, could, potentially, provide both long-term CO 2-storage<br />
and a method to increase production of a highly usable fossil fuel,<br />
natural gas, in a manner analogous to CO 2-enhanced oil recovery.<br />
Carbon dioxide, when introduced to a coal bed or black shale, preferentially<br />
displaces methane, which is adsorbed on the coal surface<br />
within the cleat system and is adsorbed in pore spaces of organic<br />
matter and clay mineral surfaces that occur in the matrix of the coal or<br />
shale. Previous studies on CO 2 sequestration and methane recovery<br />
indicate that, for coals of the type found in the Appalachian and Michigan<br />
basins, at least two molecules of CO 2 can be injected for every<br />
one molecule of CH 4 released from the coal bed (Gale and Freund,<br />
2001). On average, more than twice as much CO 2 can be stored on<br />
a volumetric basis than the amount of CH 4 extracted (Gluskoter and<br />
others, 2002; Mastalerz and others, 2004). CO 2 and CH 4 adsorption<br />
isotherm data indicate also the ratio may be much higher. The use of<br />
coal beds and black shales could provide a larger area in which CO 2<br />
can be sequestered or offer multiple options for sequestration at some<br />
locations. The production of methane from these organic-rich rock<br />
units will also help to offset costs of sequestering CO 2.<br />
Sequestration in coal beds is the basis of a proposed efficient<br />
null-greenhouse-gas emission power-plant fueled either by mined<br />
coal or coalbed methane from deep unmineable coal (Wong and<br />
Gunter, 1999). The produced CO 2 from the power plant would be<br />
injected into coal beds to produce more methane. In addition, the<br />
CO 2 would be geologically sequestered in the coal beds (Wong and<br />
Gunter, 1999).<br />
Burlington Resources has demonstrated the success of enhanced<br />
gas recovery (EGR) to recover methane by injecting CO 2 into the<br />
relatively high permeability coal beds in the San Juan basin for several<br />
years (Schoeling, 1999). Coalbed methane production has been<br />
stimulated while injected CO 2 has not broken through to production<br />
wells. The injected CO 2 appears to be adsorbed into the coal matrix<br />
displacing methane, and remains in the ground. An additional<br />
project is underway to further test the EGR process in the relatively<br />
low permeability coal beds in Alberta, Canada. These projects and<br />
others show also that there are limitations to sustained injection,<br />
such as swelling. For the purposes of this project, these limitations<br />
are not considered.<br />
The <strong>MRCSP</strong> project uses GIS technology for computing CO 2-<br />
sequestration potential in organic-rich rock units. In this report, a<br />
proposed methodology for estimating CO 2 sequestration volumes<br />
in coal beds and black shales is presented. Due to the nature of the<br />
gas-trapping mechanism in these type of reservoirs, we are using the<br />
standard methodology for gas in place calculation in non-conventional<br />
reservoirs developed by the Gas Research Institute (Mavor<br />
and Nelson, 1997); a different approach than used for volumetric<br />
calculations in conventional reservoirs. The CO 2-sequestration<br />
potential calculations are basically a series of simple mathematical<br />
operations on defined GIS-raster grids. The calculations for determining<br />
coal bed and black shale CO 2-sequestration potential are<br />
well suited to using GIS techniques.<br />
In order to calculate the CO 2-storage potential of a coal bed, a<br />
number of steps are required. The calculation is basically a series of<br />
simple mathematical operations on defined grids. Raster grids were<br />
created for the themes listed below:<br />
H coal = Coal thickness or isopach map (ft)<br />
G coal = Gas content of the coal, (SCF/short Ton)<br />
The calculation of CO 2-sequestration potential in coal beds is<br />
based upon the observation that CO 2 preferentially displaces and<br />
replaces CH 4 adsorbed on the coal-bed cleats. To calculate the CO 2-<br />
sequestration potential, the coalbed methane (CBM) resources must<br />
first be calculated. This calculation involves using the coal bed gascontent<br />
values for a given volume of coal at a given density:<br />
R cbm = ρ coal * V * G coal / 1000 (7)<br />
where:<br />
R cbm = Coalbed methane resources (MCF)<br />
ρ coal = Coal density (short tons/ft 3 )<br />
V = Volume of coal (ft 3 )<br />
G coal = Coal bed gas-desorption value (SCF/short Ton)<br />
1000 = Conversion from SCF to MCF<br />
The CBM resources can be expressed as:<br />
R cbm = (ρ coal * A* H coal* G coal) / 1000 (8)<br />
where:<br />
A = Area (ft 2 )<br />
Initial studies have shown that CO 2 displaces CH 4 at a ratio of 2:<br />
1. Further studies (Gluskoter and others, 2002; Mastalerz and others,<br />
2004) show that CO 2: CH 4 adsorption ratios will vary from 2:<br />
1 to 16:1, depending on the coal rank. The preliminary estimate for<br />
CO 2-sequestration potential in all coal beds will be at least double<br />
that of the CBM resources for the same area:<br />
Q CO2 = C CO2CH4 * R cbm (9)<br />
where:<br />
Q CO2 = CO 2-sequestration potential in all coal beds (MCF)<br />
C CO2CH4 = CO 2:CH 4 ratio, which for the <strong>MRCSP</strong> project is 2<br />
The final step in the calculation of the CO 2-sequestration potential<br />
involves the conversion of the volume of gaseous CO 2 to short tons.<br />
At surface conditions of 60º F (15.55º C) and 1 atm (101,325.01 Pa),<br />
the conversion factor is 17.25 MCF/short ton (8.625 ft 3 /lbs).<br />
The full version of the equation to calculate CO 2-sequestration<br />
potential:<br />
Q CO2 = 1.1023 * C CO2CH4 * (ρ coal * H coal * A * G coal) / (1000 * 17.25)<br />
(10)<br />
where:<br />
1.1023 = Conversion from short tons to metric tonnes<br />
The calculation for organic-rich shales is very similar to the calculation<br />
for coal beds. Carbonaceous gas-shales of Devonian age<br />
underlie the Appalachian and Michigan basins within the study<br />
area of the <strong>MRCSP</strong>. These continuous, low-permeability shales<br />
serve as both a sealing interval for deeper reservoirs and a potential<br />
sequestration target. In addition, CO 2 injection into fractured<br />
gas-shales represents a potential method to enhanced natural-gas<br />
production. The Kentucky <strong>Geologic</strong>al Survey, an <strong>MRCSP</strong> geologic<br />
team member, has been investigating the potential use of<br />
carbonaceous shales for CO 2 sequestration under a separate U.S.
CO 2-SEQUESTRATION STORAGE CAPACITY FOR THE <strong>MRCSP</strong> PROJECT<br />
41<br />
DOE contract (Analysis of the Devonian Black Shale in Kentucky<br />
for Potential Carbon Dioxide Sequestration and Enhanced Natural<br />
Gas Production, DOE/NETL contract DE-FC26-02NT41442)<br />
and much of the following discussion results from that work (Nuttall<br />
and others, 2005b).<br />
For estimating sequestration volumes in organic-rich shales, two<br />
storage strategies must be considered. Injected CO 2 will occupy the<br />
natural fracture system as either a free gas or a supercritical fluid<br />
depending on reservoir pressure and temperature conditions. Standard<br />
volumetric methods can be used to estimate this capacity, but<br />
should only be applied within the extent of known gas-producing<br />
areas of the shale.<br />
A much larger volume of CO 2 is likely to be permanently stored<br />
as gas adsorbed onto organic matter and clay minerals in the shale<br />
matrix (similar to coal). The method used to estimate this CO 2-storage<br />
capacity is to convert a volume of shale to a weight of shale<br />
using its density and then calculate the volume of CO 2 using gas<br />
content data.<br />
The shale volume is estimated from gridded isopach data imposing<br />
the limitations that the top of the shale must be a minimum<br />
drilling depth of 1,000 feet (304.8 m) and the shale is a minimum of<br />
100 feet (30.48 m) thick. The strict application of these conditions<br />
eliminated areas in Ohio and Pennsylvania where the shale is shallower<br />
than 1,000 feet (304.8 m), but exceededs several thousand<br />
feet in thickness. With this consideration, additional areas in those<br />
two states were added for evaluation. These limits were arbitrarily<br />
selected to ensure sufficient reservoir and seal capacity for CO 2<br />
sequestration.<br />
Shale density varies inversely with organic matter content<br />
(Schmoker, 1993). Figure 27 is a gamma-ray density cross-plot derived<br />
from digital logs from wells in the Big Sandy field in eastern<br />
Kentucky. The plot demonstrates the variation of shale density (top<br />
of Ohio Shale to the base of its Lower Huron Member). Clasticrich<br />
gray shales (gray dots) with minimal organic matter generally<br />
exhibit a bulk density greater than 2.55 grams per cubic centimeter<br />
(g/cc) and gamma-ray reading of less than 250 API units. Maximum<br />
shale density (minimal organic matter) is approximately 2.82 g/cc.<br />
Minimum shale density (maximum organic matter) is approximately<br />
2.35 g/cc. For initial regional assessments, a shale density of 2.62<br />
g/cc is used (Nuttall and others, 2005b).<br />
To determine gas content of the shale, CO 2 adsorption isotherm<br />
data were collected as part of the current Kentucky U.S. DOEfunded<br />
project. These data indicate the adsorption capacity of the<br />
shale averages 42.9 standard cubic feet of CO 2 per ton (scf/ton) of<br />
shale (1.134 m 3 /tonne) and ranges from 13.9 to 135.7 scf/ton (0.43<br />
to 4.24 m 3 /tonne) (Nuttall and others, 2005b). Observed adsorption<br />
data are log-normally distributed. For comparisons with the other<br />
reservoir types, a gas content value of 42.9 scf/ton was used to<br />
calculate CO 2-storage capacity herein. This value is a reasonable<br />
average for regional calculations based on available CO 2 isotherms<br />
(Nuttall and others, 2005b), but actual values would obviously vary<br />
with organic content.<br />
Although the methodology used to calculate storage capacity in<br />
organic shales of the region is reasonable for a first cut at a regional<br />
assessment, it can be improved. Original calculations assumed storage<br />
capacity to be proportional to density and suggested increasing<br />
27484 Samples for 18 out of 9031 Wells<br />
600<br />
500<br />
GR - Gamma Ray {F12.3}<br />
400<br />
300<br />
200<br />
3<br />
2<br />
1<br />
CLASTIC_FLAG - 1=sandstone 2=gray shale 3=black shale<br />
100<br />
0<br />
2.15 2.25 2.35 2.45 2.55 2.65 2.75 2.85 3<br />
RHOB - Bulk Density {F12.3}<br />
Figure 27.—Gamma-ray density cross-plot derived from digital logs from wells in the Big Sandy<br />
field in eastern Kentucky showing the variation of shale density with gamma-ray intensity.
42 CHARACTERIZATION OF GEOLOGIC SEQUESTRATION OPPORTUNITIES IN THE <strong>MRCSP</strong> REGION<br />
density yielded higher sequestration capacities. In actuality, the<br />
adsorbed gas capacity (and thus sequestration potential) is inversely<br />
proportional to density which, itself, is a function of total organic<br />
content (TOC). Schmoker (1993) described the relationship between<br />
density and TOC in his method to determine total organic matter<br />
content from density logs. The relation between measured TOC and<br />
adsorption capacity is being investigated in current shale research at<br />
the Kentucky <strong>Geologic</strong>al Survey (Nuttall and others, 2005b).<br />
There are a number of factors that will reduce the amount of CO 2<br />
that can be adsorbed into coal beds. These include the amount of<br />
moisture, the heating value (BTU) and vitrinite reflectance, maceral<br />
composition, surface area and pore throat size, and cleat and fracture<br />
permeability (Drobmiak and others, 2005). Presumably, these factors<br />
will also affect organic-rich shales. Each of these factors will<br />
affect the amount of CO 2 that can be sequestered at any specific site,<br />
so the total pore volume needs to be further adjusted for these factors.<br />
Tables 7, 8, 11-13 show the total CO 2-sequestration capacity at<br />
the 10 percent level. This is an estimate of the amount of CO 2 that<br />
will ultimately be adsorbed by coal beds and organic-rich shales.<br />
DISCUSSION OF RESULTS<br />
The primary results of the volumetric storage capacity calculations<br />
shows that the <strong>MRCSP</strong> project area has a large amount of<br />
potential capacity for CO 2 sequestration. However, actual capacity<br />
will be limited by a large number of factors that are discussed in the<br />
following pages, but is likely less (and more variable) than what is<br />
calculated herein. Nonetheless, the results calculated do provide a<br />
basis for a comparison between units, states, and other regions using<br />
similar methods to determine future storage capacity. The total<br />
amount of potential CO 2 sequestration capacity for the <strong>MRCSP</strong><br />
region is estimated at about 520 gigatonnes (Table 7). The majority<br />
of the CO 2-sequestration capacity in the <strong>MRCSP</strong> area, about 470<br />
gigatonnes, or approximately 90 percent of the total estimated CO 2-<br />
storage capacity, represents the potential of the deep saline formations.<br />
The black shales have the next largest storage potential, with<br />
a sequestration capacity of 45.4 gigatonnes, which is approximately<br />
9 percent of the total estimated CO 2-storage capacity. Oil-and-gas<br />
fields have a potential sequestration capacity of about 2.5 gigatonnes,<br />
which is approximately 0.5 percent of the total estimated<br />
CO 2-storage capacity. The smallest sequestration capacity occurs<br />
in coal, with a total of 0.25 gigatonnes, which is approximately 0.5<br />
percent of the total estimated CO 2-storage capacity (Table 7). The<br />
reader is referred to the <strong>MRCSP</strong> web-based interactive maps or the<br />
GIS on CD accompanying this report to view the capacity maps per<br />
geologic-interval mapped to see variations across the area.<br />
Comparisons by State<br />
Each state has their own set of geologic conditions and reservoirs<br />
that can sequester CO 2. Tables 7 through 22 show the breakdown of<br />
CO 2 sequestration potential by reservoir and by state. Also included<br />
in tables 7 and 10 through 22 is the area occupied by each reservoir<br />
in the <strong>MRCSP</strong> region. These area values can be used to make comparisons<br />
between different reservoirs and between different states in<br />
the MSRCSP region.<br />
The largest potential sequestration capacity occurs in the state of<br />
Michigan with a capacity of about 220 gigatonnes (Table 8), which<br />
corresponds to 42 percent of the total capacity in the <strong>MRCSP</strong> project<br />
area. Almost all of this capacity is in deep saline formations. The<br />
Sylvania Sandstone, St. Peter Sandstone, and Mount Simon Formation,<br />
provide the majority of the capacity.<br />
The state with the next largest sequestration capacity is Pennsylvania<br />
with a potential capacity of nearly 90 gigatonnes, which<br />
corresponds to 17 percent of the <strong>MRCSP</strong> regional sequestration<br />
capacity. Unlike the state of Michigan, the sequestration capacity<br />
in Pennsylvania is unequally distributed between five different deep<br />
saline formations, the Devonian black shales, the Needmore Shale,<br />
the oil-and-gas fields, and the coal beds. Pennsylvania also has the<br />
largest potential oil-and-gas field sequestration capacity.<br />
The eastern part of the state of Indiana has the third largest sequestration<br />
capacity in the <strong>MRCSP</strong> region with a potential sequestration<br />
capacity of about 80 gigatonnes. Almost all of Indiana’s sequestration<br />
capacity is in the Mt. Simon Sandstone. Minor amounts<br />
of sequestration capacity are found in the St. Peter Sandstone and<br />
the oil-and-gas fields in the state. Indiana’s coal fields are outside of<br />
the <strong>MRCSP</strong> boundary and were not considered in the calculations.<br />
West Virginia has the fourth largest potential sequestration capacity<br />
with a total of about 60 gigatonnes. The deep saline formations have<br />
a potential sequestration capacity of over 40 gigatonnes, while the<br />
organic-rich shales have a potential capacity of about 20 gigatonnes.<br />
Both the shale and coal bed sequestration capacities are the largest<br />
among the states in the <strong>MRCSP</strong> project. Also, the area in which coal<br />
sequestration was considered possible in West Virginia was limited<br />
to non-mining areas, so the total potential coal CO 2-sequestration<br />
capacity may be greater than estimated.<br />
Ohio has the fifth-largest potential sequestration capacity of over<br />
45 gigatonnes, of which, over 35 gigatonnes are in deep saline formations.<br />
The saline formations with the largest potential capacity<br />
are the Mt. Simon Sandstone (20 gigatonnes) in western Ohio, and<br />
the Rose Run (8 gigatonnes) and Medina (5.6 gigatonnes) sandstones<br />
in eastern Ohio. These three reservoirs contain 71 percent of<br />
the state’s total potential sequestration capacity, and 89 percent of<br />
the saline formation capacity. The Devonian shales have a potential<br />
capacity of 8.5 gigatonnes.<br />
Eastern Kentucky has the sixth largest potential capacity, with<br />
over 13 gigatonnes. The potential capacity is only calculated for<br />
that part of the state in the <strong>MRCSP</strong> region. The majority of the<br />
capacity is in the deep saline formations, with a total of nearly 11<br />
gigatonnes (82 percent). The three largest deep saline formations<br />
are the Rose Run sandstone, at 5 gigatonnes (41 percent of the total<br />
capacity), Mt. Simon Sandstone, at 4 gigatonnes (33 percent of the<br />
total capacity), and basal sandstones in the Rome trough sandstone,<br />
at 1 gigatonnes (8 percent of total capacity). The next largest type of<br />
reservoir is the Devonian shale, with a potential capacity of nearly 2<br />
gigatonnes (13 percent).<br />
The estimated total potential storage capacity in Maryland is<br />
nearly 10 gigatonnes. Almost all of this capacity occurs in deep<br />
saline formations (Waste Gate Formation, Oriskany Sandstone, and<br />
Medina/Tuscarora Sandstones). The Waste Gate Formation has the<br />
largest capacity, over 4 gigatonnes (46 percent of the total capacity).<br />
The next largest is the Medina Sandstone, at 3 gigatonnes (36 percent<br />
of the total capacity). There is also a minor amount of sequestration<br />
potential in the organic-rich Needmore Shale. Additional<br />
storage capacity may be present in the offshore reservoirs along the<br />
Maryland coast; however, these reservoirs were not evaluated due<br />
to the lack of data.<br />
Comparisons by Reservoir Type and Unit<br />
The storage capacity in each reservoir is largely a function of<br />
its spatial extent, thickness, and the porosity. Given its presence<br />
in much of the <strong>MRCSP</strong> region, the saline formation with the largest<br />
capacity in the region is the Mt. Simon Sandstone, followed
CO 2-SEQUESTRATION STORAGE CAPACITY FOR THE <strong>MRCSP</strong> PROJECT<br />
43<br />
Table 10.—Waste Gate Formation estimated effective<br />
CO 2-storage capacity (in gigatonnes)<br />
State Area (mi 2 ) Total<br />
Maryland 1,342 4.4<br />
Total 1,342 4.4<br />
Table 11.—Net coal greater than 500 feet deep. Estimated<br />
effective CO 2-storage capacity by state (in gigatonnes)<br />
Table 15.—Oriskany Sandstone estimated effective<br />
CO 2-storage capacity by state (in gigatonnes)<br />
State Area (mi 2 ) Total<br />
Kentucky 7 0.002<br />
Maryland 1,123 0.981<br />
Ohio 4,896 0.728<br />
Pennsylvania 29,022 7.669<br />
West Virginia 22,265 10.049<br />
Total 57,313 19.429<br />
State Area (mi 2 ) Total<br />
Eastern Kentucky 3,751 0.02<br />
Ohio 5,053 0.04<br />
Pennsylvania 4,724 0.08<br />
West Virginia 12,042 0.11<br />
Total 25,571 0.25<br />
Table 12.—Devonian Shales estimated effective<br />
CO 2-storage capacity by state (in gigatonnes)<br />
State Area (mi 2 ) Total<br />
Eastern Kentucky 14,066 1.68<br />
Michigan 38,428 4.18<br />
Ohio 24,693 8.50<br />
Pennsylvania 7,720 12.04<br />
West Virginia 18,323 18.91<br />
Total 109,043 45.3<br />
Table 13.—Needmore Shale estimated effective<br />
CO 2-storage capacity by state (in gigatonnes)<br />
State Area (mi 2 ) Total<br />
Table 16.—Medina Sandstone estimated effective<br />
CO 2-storage capacity by state (in gigatonnes)<br />
State Area (mi 2 ) Total<br />
Kentucky 420 0.089<br />
Maryland 1,288 3.382<br />
Ohio 15,647 5.579<br />
Pennsylvania 31,333 36.024<br />
West Virginia 23,642 25.459<br />
Total 72,328 70.534<br />
Table 17.—St. Peter Sandstone estimated effective<br />
CO 2-storage capacity by state (in gigatonnes)<br />
State Area (mi 2 ) Total<br />
Indiana 1,212 0.103<br />
Michigan 39,396 87.967<br />
Ohio 1,187 0.064<br />
Total 41,796 88.134<br />
Maryland 165 0.010<br />
Pennsylvania 54 0.003<br />
West Virginia 631 0.041<br />
Total 850 0.054<br />
Table 14.—Sylvania Sandstone estimated effective<br />
CO 2-storage capacity by state (in gigatonnes)<br />
State Area (mi 2 ) 10%<br />
Michigan 25,324 15.1<br />
Total 25,324 15.1<br />
Table 18.—Rose Run sandstone estimated effective<br />
CO 2-storage capacity by state (in gigatonnes)<br />
State Area (mi 2 ) Total<br />
Eastern Kentucky 13,146 5.443<br />
Michigan 334 0.762<br />
Ohio 16,353 8.100<br />
Pennsylvania 22,222 29.748<br />
West Virginia 5,438 5.215<br />
Total 57,493 49.268
44 CHARACTERIZATION OF GEOLOGIC SEQUESTRATION OPPORTUNITIES IN THE <strong>MRCSP</strong> REGION<br />
Table 19.—Potsdam Sandstone estimated effective<br />
CO 2-storage capacity by state (in gigatonnes)<br />
State Area (mi 2 ) Total<br />
Ohio 18 0.002<br />
Pennsylvania 9,280 1.704<br />
Total 9,298 1.706<br />
Table 21.—Rome trough sandstones estimated effective<br />
CO 2-storage capacity by state (in gigatonnes)<br />
State Area (mi 2 ) Total<br />
Eastern Kentucky 13,157 1.001<br />
Ohio 201 0.006<br />
West Virginia 5,094 0.221<br />
Total 18,452 1.228<br />
Table 20.—Unnamed Conasauga sandstones estimated effective<br />
CO 2-storage capacity by state (in gigatonnes)<br />
State Area (mi 2 ) Total<br />
Eastern Kentucky 25 0.001<br />
Michigan 409 0.164<br />
Ohio 21,185 3.469<br />
Pennsylvania 2,410 0.459<br />
West Virginia 943 0.0161<br />
Total 24,973 4.255<br />
Table 22.—Mt. Simon Formation estimated effective<br />
CO 2-storage capacity by state (in gigatonnes)<br />
State Area (mi 2 ) Total<br />
Eastern Kentucky 6,661 4.336<br />
Indiana 18,957 80.612<br />
Michigan 40,530 112.839<br />
Ohio 19,768 19.390<br />
Total 85,916 217.177<br />
by the St. Peter Sandstone and the “Clinton”/Medina/Tuscarora<br />
Sandstones. The deep saline formations with the smallest potential<br />
are the Potsdam Sandstone and basal sandstone in the Rome trough<br />
in eastern Kentucky. The low potentials stem from assigning these<br />
two aquifers very low porosities, since porosity generally decreases<br />
with depth, and both units are deeply buried. In addition, because<br />
of the lack of exploratory wells in many areas, such as in the deepest<br />
portion of the Appalachian basin in Pennsylvania, some areas<br />
contained no data and could not be mapped (see the structure and<br />
isopach maps of Appendix A). This also accounts for much of the<br />
small potential of the basal sandstones. The unnamed sandstones in<br />
the Conasuaga were also assigned a low porosity, since initial studies<br />
indicated the primary lithology of the Conasauga in eastern Ohio<br />
and western Pennsylvanian is a sandy or silty dolomite.<br />
It is perhaps useful to compare the estimated capacities in this<br />
study with some other assessments. An assessment of the Mt. Simon<br />
Sandstone (including areas outside <strong>MRCSP</strong>) by Gupta and others<br />
(2001) showed a capacity range of 160 to 800 gigatonnes based on<br />
a porosity range of 5 to 25 percent, net-to-gross-ratio of 50 to 95<br />
percent, and storage efficiency of 6 percent. In the same study, the<br />
capacity range for 8.5 percent porosity was 195 to 371 gigatonnes.<br />
This compares well with the estimated 10 percent capacity number<br />
of 217 gigatonnes for Mt. Simon in the <strong>MRCSP</strong> region in this<br />
study. Similarly, the Rose Run sandstone capacity range of 9 to 43<br />
gigatonnes of Gupta and others (2001) is comparable to the 49 gigatonnes<br />
estimated in the current study.<br />
Estimated CO 2 sequestration capacity in the Devonian Ohio<br />
Shale (Cleveland to Lower Huron Members) and equivalents in<br />
the Appalachian basin and the Antrim Shale in the Michigan basin<br />
ranges between 23.2 and 88.3 gigatonnes, varying between CO 2 adsorption<br />
rates of 22 and 84 standard cubic feet of gas per ton (U.S.)<br />
of shale. Capacity estimates for the black shales in eastern Kentucky<br />
represent only that part of the shale in the <strong>MRCSP</strong> region. The 90 th<br />
percentile figures calculated for Ohio, Pennsylvania, and West Virginia<br />
seems overly optimistic. The gray shales and intertonguing<br />
siltstones characteristic of the Devonian shale in these states may<br />
not have a sufficient organic matter content to adsorb such large volumes<br />
of CO 2. More realistically, the sequestration capacity is likely<br />
in the calculated range between the 10 th and 50 th percentiles. All of<br />
these estimates are, of course, contingent on the injectivity of CO 2<br />
into the shale, which is untested.<br />
For the oil-and-gas fields, the fields are separated into those that<br />
are less than 2,499 feet in depth and those that are greater than 2,500<br />
feet in depth (762 m). The 2500-foot depth cutoff roughly corresponds<br />
to the predicted transition from the gaseous phase to the super-critical<br />
phase of CO 2, which is approximately 260 times denser<br />
than the gaseous phase and, therefore, more desirable.<br />
Solubility Storage<br />
While solubility storage is described in this document, it is not applied<br />
in this study, since most of the initial sequestration will occur<br />
as volumetric storage. Instead, one representative calculation was<br />
conducted for the project. The solubility capacity was calculated for<br />
Mt. Simon Sandstone of Indiana, Michigan, and Ohio. The potential<br />
CO 2-storage capacity using the solubility calculation is in excess of<br />
83 gigatonnes, while the potential storage capacity using the volumetric<br />
calculations is over 217 gigatonnes, an increase by a factor<br />
of 2.6. However, an interesting phenomenon occurs in the solubility<br />
calculation. In the center of the Michigan basin, there is no solubility<br />
capacity. This is because the modeled salinity is too high to allow<br />
CO 2 to dissolve into the formation fluids. The high salinity, generally<br />
increasing salinities with depth, and the low solution rates indicate<br />
that solubility storage will not be a near-term factor in sequestering<br />
CO 2 in the <strong>MRCSP</strong> area. As a comparison, Dooley and others (2004)<br />
used the solubility approach to estimate that the total storage capacity<br />
in the Mt. Simon Sandstone, including all of the Illinois basin and<br />
the Appalachian basin is approximately 225 gigatonnes.
CONCLUSIONS AND REGIONAL ASSESSMENT FOR GEOLOGIC SEQUESTRATION<br />
45<br />
CONCLUSIONS AND REGIONAL ASSESSMENT FOR GEOLOGIC SEQUESTRATION<br />
Under Subtask 2.1 of the <strong>MRCSP</strong> <strong>Phase</strong> I project, the geologic<br />
team examined the region’s overall geology, created a regional<br />
correlation chart, and delineated the most promising prospective<br />
geologic CO 2 reservoirs and sinks via data collation, interpretation,<br />
and mapping. We then used the collected data and maps to calculate<br />
a first approximation of the region’s geologic CO 2 sequestration<br />
capacities of four main reservoir classes: deep saline formations, oil<br />
and gas fields, unmineable coalbeds, and organic shales. The deep<br />
saline formations, especially the Mt. Simon, St. Peter, and Rose Run<br />
sandstones, are, by far, the region’s largest assets for long-term geologic<br />
CO 2 sequestration. All of this information has been captured in<br />
a Geographic Information System using ESRI’s suite of ARC-GIS<br />
products.<br />
Through these efforts we have also defined a number of promising<br />
additional sequestration target formations including the Bass<br />
Islands Dolomite, Lockport Dolomite, and Copper Ridge Dolomite.<br />
These will be mapped and analyzed as separate units within the<br />
<strong>Phase</strong> II project to complete the region’s assessment. During <strong>Phase</strong><br />
II the geologic team will also develop more comprehensive data on<br />
the region’s EOR potential, Class I and II injection wells, and gas<br />
storage fields. All of these data are necessary to provide a sound<br />
knowledge basis for moving forward with widespread implementation<br />
of geologic CO 2 sequestration.<br />
This <strong>Phase</strong> I assessment has shown that the <strong>MRCSP</strong> region has<br />
approximately 450 to 500 gigatonnes of storage potential in deep saline<br />
formations for future deployment of geologic CO 2 sequestration<br />
technology. In fact, our region can easily accommodate many hundreds<br />
of year’s worth of CO 2 emissions at current or expanded levels<br />
within this one type of reservoir. This region also has the potential to<br />
store at least 2.5 giggatones of CO 2 in existing and depleted oil and<br />
gas fields. By using anthropogenic CO 2 in enhanced oil recovery<br />
operations in current and recently abandoned oil fields, the region<br />
could realize hundreds of million of barrels of additional oil production.<br />
The northern Appalachian basin unmineable coalbeds have the<br />
potential to contain approximately 0.25 gigatonnes of CO 2. Only recently<br />
have operators started to develop the vast amount of coalbed<br />
methane found beneath the northern Appalachian basin. Application<br />
of enhanced gas recovery using CO 2 early in this endeavor could<br />
add significantly to the amount of gas produced from the deep unmineable<br />
portions of this resource while sequestering millions of<br />
tons of CO 2 in its place. The use of organic shales as a CO 2-storage<br />
medium is still an untested research topic. Should this technology<br />
prove practical, the <strong>MRCSP</strong> region has one of the richest holdings<br />
of these deposits in the world.<br />
Although we are herein reporting capacities of reservoirs at 10<br />
percent of total assumed volumes, we do not believe these estimates<br />
to be sufficiently conservative. It should also be kept in mind that<br />
many other restrictions will be emplaced on the use of any subsurface<br />
storage space that have not been accounted for in studies of<br />
this type to date. Such restrictions, or access issues, might include:<br />
inability to inject below large metropolitan areas or large bodies<br />
of water; inability to inject below or within specific offsets (both<br />
vertically and horizontally) of producing oil and gas fields or active<br />
mines; and the inability to inject within specific offsets (both vertically<br />
and horizontally) of other injection operations—Class I, II, or<br />
III. In addition to these listed possible restrictions, the consideration<br />
that large-scale CO 2 injection operations should not be permitted too<br />
close to one another to avoid any possibility of interaction of their<br />
related pressure fronts should be stressed. Many of these restrictions<br />
will fall under the purview of regulatory agencies to enact. As with<br />
the entire carbon capture and storage technology arena, regulations<br />
for CO 2 injection and storage are still in an early formative stage.<br />
Once regulations are known, restrictions can be applied to these capacity<br />
maps to calculate potentials including such considerations.<br />
The above-cited storage potential is not distributed evenly over<br />
the region. Some areas have very significant storage potential while<br />
others have very little known storage potential. Mapping the distribution<br />
of this potential is just as significant to the region as calculating<br />
the potential for storage. The existing large stationary CO 2<br />
sources of the region are not all situated over sufficient known storage<br />
potential. Therefore, it is hoped that this study, and subsequent<br />
investigations, will be used by utility and industrial decision-makers<br />
to plan future plant locations with necessary subsurface conditions<br />
in mind. Further, the maps/results of this investigation can be used<br />
to start planning for future pipelines to match existing CO 2 sources<br />
with appropriate geologic sinks.
46 CHARACTERIZATION OF GEOLOGIC SEQUESTRATION OPPORTUNITIES IN THE <strong>MRCSP</strong> REGION<br />
REFERENCES CITED<br />
Adams, M.A., Eddy, G.E., Hewitt, J.L., Kirr, J.N., and Rightmire, C.T.,<br />
1984, <strong>Geologic</strong>al overview, coal resources, and potential methane recovery<br />
from coalbeds of the Northern Appalachian Coal Basin—Pennsylvania,<br />
Ohio, Maryland, West Virginia, and Kentucky, in Rightmire,<br />
C.T., Eddy, G.E., and Kirr, J.N., (Eds.) Coalbed methane resources of<br />
the United States: American Association of Petroleum Geologists, AAPG<br />
Studies in Geology #17, Tulsa, Oklahoma, p. 15-71.<br />
American Association of Petroleum Geologists, 1994, AAPG DataRom<br />
(CSDE, COSUNA, GSNA): AAPG, 1 CD-ROM.<br />
Ammerman, M.L., and Keller, G.R., 1979, Delineation of the Rome trough<br />
in eastern Kentucky by gravity and deep drilling data: AAPG Bulletin, v.<br />
63, p. 341-353.<br />
Bachu, S., and Adams, J.J., 2003, Sequestration of CO 2 in geological media<br />
in response to climate change: capacity of deep saline aquifers to<br />
sequester CO 2 in solution: Energy Conversion and Management, v. 44,<br />
p. 3151-3175.<br />
Ball, D.C., 2005, Managing Climate Change and Securing a Future for<br />
the <strong>Midwest</strong>’s Industrial Base: presentation to the Ohio Gas Association—2005<br />
Technical Seminar, March 31, 2005. Available at .<br />
Barton, K.E., Howell, D.G., and Vigil, J.F., 2003, The North American Tapestry<br />
of Time and Terrain: U.S. <strong>Geologic</strong>al Survey <strong>Geologic</strong> Investigations<br />
Series I-2781, 1 plate. .<br />
Beecy, D.A., Kuuskraa, V.A., and Schmidt, C., 2002, A perspective on the<br />
potential role of geologic options in a national carbon management strategy:<br />
Journal of Energy and Environmental Research, v. 2, no. 1. p. 47-53.<br />
(from U.S. Department of Energy, National Energy Technology Laboratory,<br />
First National Conference on Carbon Sequestration, 2001).<br />
Bentham, M., and Kirby, G., 2005, CO 2 Storage in Saline Aquifers: Oil &<br />
Gas Science and Technology—Rev. IFP, v. 60, No. 3, p. 559-567.<br />
Bergman, P.D., and Winter, E.M., 1995, Disposal of carbon dioxide in aquifers<br />
in the US: Energy Conversion and Management, v. 36, p. 523-526.<br />
Blackwell, D.D., and Richards, M.C., 2004a, Calibration of the AAPG Geothermal<br />
Survey of North America BHT Data Base: AAPG Bulletin, v. 88,<br />
no. 13 (Supplement), .<br />
Blackwell, D.D., and Richards, M.C., 2004b, Geothermal map of North<br />
America: AAPG Map, scale 1:6,500,000, 1 sheet.<br />
Blatt, H., Middleton, G., and Murray, R., 1980, Origin of sedimentary rocks,<br />
2 nd edition: Englewood Cliffs, New Jersey, Prentice-Hall, Inc., 782 p.<br />
Blomberg, J.R., 1994, Ohio Fields Have Waterflood Potential: The American<br />
Oil & Gas <strong>Report</strong>er, November 1994, p. 107-111.<br />
Brennan, S.T. and Burruss, R.C., 2003, Specific sequestration volumes: a<br />
useful tool for CO 2 storage capacity assessment: U.S. <strong>Geologic</strong>al Survey<br />
Open-File <strong>Report</strong> 03-452, 12 p.<br />
Brown, K., Jazrawi, W., Moberg, R., and Wilson, M., 2001, Role of enhanced<br />
oil recovery in carbon sequestration—The Weyburn monitoring<br />
project, a case study, in First National Conference on Carbon Sequestration,<br />
2001: U.S. Department of Energy, National Energy Technology<br />
Laboratory, 8 p.<br />
Carr, T. R., Wickstrom, L. H., Korose, C. P., Fisher, R. S., Solano-Acosta,<br />
W., and Eaton, N., 2003, Online tools to evaluate saline aquifers for CO 2<br />
sequestration: Kansas <strong>Geologic</strong>al Survey Open-File <strong>Report</strong> 2003-33<br />
.<br />
Dooley, J.J., Dahowski, R.T., Davidson, C.L., Bachu, S., Gupta, N., and<br />
Gale, J., 2004, A CO 2 storage supply curve for North America and its implications<br />
for the deployment of carbon dioxide capture and storage systems,<br />
in Rubin, E.S., Keith, D.W., and Gilboy, C.F., eds., Proceedings of<br />
GHGT7, Volume 1: Cheltenham, UK, IEA Greenhouse Gas Programme.<br />
Drahovzal, J.A., Harris, D.C., Wickstrom, L.H., Walker, Dan, Baranoski,<br />
M.T., Keith, B.D., and Furer, L.C., 1992, The East Continent Rift Basin:<br />
A new discovery: Kentucky <strong>Geologic</strong>al Survey, ser. 11, Special Publication<br />
18, 25 p.<br />
Drobniak, A., Korose, C., Mastalerz, M., Moore, T.R., and Rupp, J. 2005,<br />
Sequestration of CO 2 in various geological media: An assessment of potential<br />
volumes in Indiana using GIS tools, in 2005 Eastern Section AAPG<br />
Meeting, September 18-20, 2005, Morgantown, WV: AAPG Search<br />
and Discovery Article #90044 .<br />
ESRI, 2005, Redlands, California, ESRI .<br />
Fisher, J.H., Barratt, M.W., Droste, J.S., and Shaver, R.H., 1988, Michigan<br />
Basin, in Sloss, L.L., ed., Sedimentary Cover-North American Craton,<br />
U.S.: Decade of North American Geology, The Geology of North America,<br />
v. D-2, p. 361-382.<br />
Gale, J., Christensen, N. P., Cutler, A., and Torp, T.A., 2001, Demonstrating<br />
the Potential for <strong>Geologic</strong>al Storage of CO 2: The Sleipner and GESTCO<br />
Projects. Environmental Geosciences, v. 8, no.3, p. 160-165.<br />
Gale, J., and Freund, P., 2001, Coal-bed methane enhancement with CO 2<br />
sequestration worldwide potential: Environmental Geosciences, v. 8, no.<br />
3, p. 210-217.<br />
Gao, D., Shumaker, R.C., and Wilson, T.H., 2000, Along-axis segmentation<br />
and growth history of the Rome trough in the central Appalachian basin:<br />
AAPG Bulletin, v. 84, p. 75-98.<br />
geoPLUS, Inc., 2005, PETRA geological software .<br />
Gluskoter, H., Mastalerz, M., and Stanton, R., 2002, The potential for carbon<br />
dioxide sequestration in coal beds: New evidence from methane and<br />
carbon dioxide adsorption analyses of coals from lignite to anthracite, in<br />
North-Central Section (36th) and Southeastern Section (51st), GSA Joint<br />
Annual Meeting (April 3-5, 2002): <strong>Geologic</strong>al Society of America Abstracts<br />
with Programs, v. 34, no. 2. p. 37.<br />
Gupta, N. and Bair, E.S., 1997, Variable-density flow in the midcontinent<br />
basin and arches region of the United States: Water Resources Research,<br />
v. 33, p. 1785-1802.<br />
Gupta, N., Sass, B., Sminchak, J., and Naymik, T., 1999, Hydrodynamics of<br />
CO 2 disposal in a deep saline formation in the midwestern United States,<br />
in Proceedings of the Fourth International Conference on Greenhouse Gas<br />
Control Technologies (GHGT-4), Eliasson, B., Riemer, P.W.F., and Wokaun,<br />
A., (Eds.), 30 August to 2 September 1998: Interlaken, Switzerland,<br />
Pergamon, p. 157-162.<br />
Gupta, N., Wang, P., Sass, B., Bergman, P., and Byrer, C., 2001, Regional<br />
and site-specific hydrogeologic constraints on CO 2 sequestration in the<br />
midwestern United States saline formations, in Proceedings of GHGT5,<br />
August 14-16, 2000.: Cairns, Australia.<br />
Gupta, N., Sass, B.M., Chattopadhyay, S., Sminchak, J., Wang, P., and Espie,<br />
T., 2004a, <strong>Geologic</strong> storage of CO 2 from refining and chemical facilities<br />
in the midwestern U.S.: Energy, v. 29, no. 9-10, p. 1599-1609.<br />
Gupta, N., Jagucki, P., Sminchak, J., Meggyesy, D., Spane, F., Ramakrishnan,<br />
T.S., and Boyd, A, 2004b, Determining carbon sequestration reservoir<br />
potential at a site-specific location within the Ohio River Valley Region,<br />
in Rubin, E.S., Keith, D.W., and Gilboy, C.F., (Eds.) Proceedings of<br />
GHGT7, Volume 1: Cheltenham, UK, IEA Greenhouse Gas Programme.<br />
Harper, J.A., and Laughrey, C.D., 1987, Geology of the oil and gas fields<br />
of southwestern Pennsylvania: Pennsylvania <strong>Geologic</strong>al Survey, Mineral<br />
Resource <strong>Report</strong> 87, 166 p.<br />
Hendriks, C.A and Blok, K., 1993, Underground storage of carbon dioxide:<br />
Energy Conversion and Management, v. 34, p. 949-957.<br />
Hinze, W.J., Kellogg, R.L., and O’Hara, N.W., 1975, Geophysical studies of<br />
basement geology of southern peninsula of Michigan: American Association<br />
of Petroleum Geologists Bulletin, v. 59, p. 1562-1584.<br />
Holt, T., Jensen, J.I., and Lindeberg, E., 1995, Underground storage of CO 2<br />
in aquifers and oil reservoirs: Energy Conversion and Management, v.<br />
36, p. 535-538.<br />
Houghton, J. T., Filho, L.G.M., Callander, B.A., Harris, N., Kattenberg, A.,<br />
and Maskell, K., 1996, Climate Change 1995: The Science of Climate<br />
Change: Cambridge, England, Intergovernmental Panel on Climate<br />
Change, Cambridge University Press, 572 p.<br />
Houghton, J.T., Ding, Y., Griggs, D.J., Noguer, M., van der Linden, P.J.,<br />
Dai, X., and Maskell, K., 2001, Climate change 2001: A scientific basis:<br />
Cambridge, England, Intergovernmental Panel on Climate Change, Cambridge<br />
University Press, 881 p.<br />
Hovorka, S.D., Doughty, C., Knox, P.R., Green, C.T., Pruess, K., and Benson,<br />
S.M., 2001, Evaluation of brine-bearing sands of the Frio Formation,<br />
Upper Texas Gulf Coast for geological sequestration of CO 2, in First
REFERENCES CITED<br />
47<br />
National Conference on Carbon Sequestration, 2001: U.S. Department of<br />
Energy, National Energy Technology Laboratory, 13 p.<br />
Hutchinson, M.F. and Gallant, J.C. 2000, Digital elevation models and representation<br />
of terrain shape, in Wilson, J.P. and Gallant, J.C., (Eds.) Chapter<br />
2, Terrain Analysis: New York, Wiley, p. 29-50.<br />
Jarrell, P.M., Fox, C.E., Stein, M.H., and Webb, S.L., 2002, Practical aspects<br />
of CO 2 flooding: SPE Monograph 22, 220 p.<br />
Lemmon, E.W., McLinden, M.O., and Friend, D.G., 2003, Thermophysical<br />
Properties of Fluid Systems, in NIST Chemistry WebBook, NIST Standard<br />
Reference Database Number 69, eds. Linstrom, P.J. and Mallard,<br />
W.G., March 2003: Gaithersburg MD, National Institute of Standards and<br />
Technology, .<br />
Martin, R., 2002, Kinder-Morgan CO 2 Company: <strong>Geologic</strong>al sequestration<br />
and EOR, presentation given at Interstate Oil and Gas Compact<br />
Commission (IOGCC) Meeting on long-term storage of CO 2 in geologic<br />
formations, July 17-19, 2002, Alta, Utah: Interstate Oil and<br />
Gas Compact Commission .<br />
Mastalerz, M., Gluskoter, H., and Rupp, J., 2004, Carbon dioxide and<br />
methane sorption in high volatile bituminous coals from Indiana, USA:<br />
International Journal of Coal Geology, v. 60, p. 43-55.<br />
Mavor, M. and Nelson, C.R., 1997, Coalbed reservoir gas-in-place analysis:<br />
Gas Research Institute GRI-97/0263, 148 p.<br />
McGuire, W.H., and Howell, P., 1963, Oil and gas possibilities of the Cambrian<br />
and lower Ordovician in Kentucky: Lexington, Kentucky, Spindletop<br />
Research Center for the Kentucky Department of Commerce, 216 p.<br />
Michigan Oil and Gas Association, 1999, The facts about Michigan’s oil<br />
and gas industry: Michigan Oil and Gas Association, 14 p. .<br />
Milici, R.C., 2004, Assessment of Appalachian basin Oil and Gas Resources:<br />
Carboniferous Coal-bed Gas Total Petroleum System; U.S. <strong>Geologic</strong>al<br />
Survey Open-file <strong>Report</strong> 2004-1272, 59 p.<br />
National Aeronautics and Space Administration (NASA), 2002, Shuttle<br />
Radar Topography Mission: data distributed by U.S. <strong>Geologic</strong>al Survey-<br />
EROS Data Center.<br />
Natural Gas Monthly: Energy Information Administration, U.S. Department<br />
of Energy .<br />
NOAA, 2000, Normal daily mean temperature, degrees F, 1971-2000:<br />
NOAA .<br />
Nuttall, B. C., Drahovzal, J.A., Eble, C. F., and Bustin, R. M., 2005a, CO 2<br />
Sequestration in Gas Shales of Kentucky [abs]: Abstracts Volume AAPG<br />
2005 Annual Convention, June 19-22, 2005, p. A101-A102.<br />
Nuttall, B.C., Drahovzal, J.A., Eble, C.F., and Bustin, R.M., 2005b, Analysis<br />
of the Devonian black shale in Kentucky for potential carbon dioxide<br />
sequestration and enhanced natural gas production, Quarterly <strong>Report</strong>:<br />
Kentucky <strong>Geologic</strong>al Survey, report of research in progress, 83 p. .<br />
Pashin, J.C., Carroll, R.E., Groshong Jr., R.H., Raymond, D.E., McIntyre,<br />
M.R., Payton, W.J., 2003, <strong>Geologic</strong> screening criteria for sequestration of<br />
CO 2 in coal: quantifying potential of the Black Warrior coalbed methane<br />
fairway, Alabama: Annual Technical Progress <strong>Report</strong>, U.S. Department<br />
of Energy, National Energy Technology Laboratory, contract DE-FC-<br />
00NT40927, 190 p.<br />
Quinlan, G.M., and Beaumont, C., 1984, Appalachian thrusting, lithospheric<br />
flexure, and the Paleozoic stratigraphy of the Eastern Interior of North<br />
America: Canadian Journal of Earth Sciences, v. 21, p. 973-996.<br />
Radhakrishnan, P., Solano-Acosta, W., and Rupp, J.A., 2004, Sequestration<br />
of CO 2 in various geological media: An assessment of potential volumes<br />
in Indiana using GIS tools, in 2004 Eastern Section AAPG Meeting,<br />
October 3-5, 2004, Columbus, Ohio: AAPG Search and Discovery Article<br />
#90031 .<br />
Reichle, D., and 19 coauthors, 1999, Carbon Sequestration Research<br />
and Development: Washington, D.C., U.S. Department of Energy, Offices<br />
of Science and Fossil Energy, 1999, 289 p. .<br />
Reznik, A., Singh, P.K., and Foley, W.L., 1982, An analysis of the effect of<br />
carbon dioxide injection on the recovery of in-situ methane from bituminous<br />
coal: An experimental simulation: Society of Petroleum Engineers/<br />
U.S. Department of Energy 10822.<br />
Rice, D.D., 1995, <strong>Geologic</strong> framework and description of coal-bed gas<br />
plays, in Gautier, D.L., Dolton, G.L., Takahaski, K.I., and Varnes, K.L.,<br />
(Eds.) National Assessment of United States Oil and Gas Resrouces: Results,<br />
methodology, and supporting data: U.S. <strong>Geologic</strong>al Survey Digital<br />
Data Series DDS-30, 103 p., maps.<br />
Russell, W.L., 1972, Pressure-depth relations in Appalachian region. AAPG<br />
Bulletin, v. 56, p. 528-536.<br />
Schmoker, J.W., 1993, Use of formation-density logs to determine organiccarbon<br />
content in Devonian shales of the western Appalachian Basin and<br />
an additional example based on the Bakken Formation of the Williston<br />
Basin, in Roen, J.B. and Kepferle, R.C., (Eds.) Petroleum geology of the<br />
Devonian and Mississippian black shale of eastern North America: U. S.<br />
<strong>Geologic</strong>al Survey Bulletin 1909, p. J1-J14.<br />
Schoeling, L., 1999, Enhanced coalbed methane production with carbon<br />
dioxide injection: New Orleans, LA, Interstate Oil and Gas Compact<br />
Commission Annual Meeting Presentation Notes, December 14.<br />
Schrider, L.A., 1993, Marlboro reservoir management study, East Canton oil<br />
field, Ohio, presented at Independent Oil and Gas Producers meeting in<br />
Santa Fe, New Mexico, June 23, 1993.<br />
Schroeder, K., Ozdemir, E., and Morsi, B.I., 2002, Sequestration of carbon<br />
dioxide in coal seams: Journal of Energy and Environmental Research,<br />
v. 2, no. 1. p. 54-63. (from U.S. Department of Energy, National Energy<br />
Technology Laboratory, First National Conference on Carbon Sequestration,<br />
2001).<br />
Schruben, P.G., Arndt, R.E., and Bawiec, W.J., 1997, Geology of the Conterminous<br />
United States at 1:2,500,000 scale - A Digital Representation<br />
of the 1974 P.B. King and H.M. Beikman Map: U.S. <strong>Geologic</strong>al Survey<br />
Digital Data Series DDS-11, release 2. .<br />
Shrake, D.L., Carlton, R.W., Wickstrom, L.H., Potter, P.E., Richard, B.H.,<br />
Wolfe, P.J., and Sitler, G.W., 1991, Pre-Mount Simon Basin under the<br />
Cincinnati Arch: Geology, v. 19, p. 139-142.<br />
Shumaker, R.C., 1996, Structural history of the Appalachian Basin, in Roen,<br />
J.B., and Walker, B.J., (Eds.) Atlas of Major Appalachian Gas Plays: Gas<br />
Research Institute, West Virginia <strong>Geologic</strong>al and Economic Survey Publication<br />
v. 25, p. 8-22.<br />
Tankard, A.J., 1986, Depositional response to foreland deformation in the<br />
Carboniferous of eastern Kentucky: AAPG Bulletin, v. 70, p. 853-868.<br />
Thomas, W.A., 1995, Diachronous thrust loading and fault partitioning of<br />
the Black Warrior foreland basin within the Alabama recess of the Late<br />
Paleozoic Appalachian-Ouachita thrust belt, in Dorobek, S.L., and Ross,<br />
G.M. (Eds.) Stratigraphic Evolution of Foreland Basins: SEPM Special<br />
Publication, v. 52, p. 111-126.<br />
U.S. Department of Energy, 1999, Carbon sequestration research and development:<br />
Office of Fossil Energy, Office of Science, Washington, D.C.,<br />
December, 195 p.<br />
U.S. Department of Energy, 2002, CO 2 capture and storage in geologic<br />
formations: Office of Fossil Energy, NCCTI Energy Technologies<br />
Group, CO 2 Capture and Storage Working Group, Washington, D.C.,<br />
White paper prepared for the National Climate Change Technology<br />
Institute, 34 p. .<br />
U.S. Department of Energy, 2004, Carbon sequestration technology roadmap<br />
and program plan: National Energy Technology Laboratory, 24 p.<br />
.<br />
U.S. Department of Energy, 2005, Carbon sequestration, technology<br />
roadmap and program plan 2005: National Energy Technology Laboratory,<br />
26 p. .<br />
van der Meer, L.G.H., 1995, The CO 2 storage efficiency of aquifers: Energy<br />
Conversion and Management, v. 36, p. 513-518.<br />
van der Straten, J., 1996, CO 2 storage equation, in Holloway, S., (Eds.), The<br />
Underground Disposal of Carbon Dioxide, Final <strong>Report</strong> of the JOULE II<br />
Project: British <strong>Geologic</strong>al Survey, Contract No. JOU2 CT92 0031.<br />
Venteris, E.R., Solis, M.P., Carter, K.M., and McDonald, J., 2005, Uncertainty<br />
and grid-resolution analysis for regional-scale geologic maps, in
48 CHARACTERIZATION OF GEOLOGIC SEQUESTRATION OPPORTUNITIES IN THE <strong>MRCSP</strong> REGION<br />
IAMG Conference, Toronto, Canada, August 21-26: IAMG Conference<br />
Proceedings.<br />
Wagner, W.R., 1975, Growth faults in Cambrian and Lower Ordovician<br />
rocks of western Pennsylvania: AAPG Bulletin, v. 60, p. 414-427.<br />
Westrich, H., and 12 coauthors, 2002, Sequestration of CO 2 in a depleted oil<br />
reservoir: an overview: Journal of Energy and Environmental Research,<br />
v. 2, no. 1. p. 64-74. (from U.S. Department of Energy, National Energy<br />
Technology Laboratory, First National Conference on Carbon Sequestration,<br />
2001).<br />
Whittaker, S.G. 2005, <strong>Geologic</strong>al <strong>Characterization</strong> of the Weyburn Field for<br />
<strong>Geologic</strong>al Storage of CO 2: Summary of <strong>Phase</strong> I Results of the IEA GHG<br />
Weyburn CO 2 Monitoring and Storage Project; in Summary of Investigations<br />
2005, Volume 1, Saskatchewan <strong>Geologic</strong>al Survey, Saskatchewan<br />
Industry Resources, Misc. Rep. 2005-4.1, CD-ROM.<br />
Wickstrom, L.H., J.D. Gray, and R.D. Stieglitz, 1992, Stratigraphy, structure,<br />
and production history of the Trenton Limestone (Ordovician) and adjacent<br />
strata in northwestern Ohio; Ohio Division of <strong>Geologic</strong>al Survey,<br />
<strong>Report</strong> of Investigations No. 143, 78 p., 1 pl.<br />
Wong, S., and Gunter, B., 1999, Testing CO 2 enhanced coalbed methane recovery:<br />
IEA Greenhouse Issues Newsletter, no. 45, November 1999, 8 p.
49<br />
APPENDIX A<br />
<strong>Geologic</strong> Summaries of Mapped Units<br />
When contemplating the potential widespread use of deep injection<br />
into geologic reservoirs within such a large and varied area such<br />
as the <strong>MRCSP</strong> study area, decision-makers will be faced with many<br />
options. The characteristics of any single, potential carbon dioxide<br />
(CO 2) reservoir unit or seal interval can change considerably over<br />
its area of occurrence. The scope of this project did not allow the<br />
extensive undertaking required to interpret, collate, and map a large<br />
number of important geologic variables, such as porosity, lithology,<br />
and permeability, for each unit or interval across such a vast area.<br />
Nonetheless, in order to provide as much information about each<br />
mapped interval to users of this report, we have prepared a short<br />
compendium on each interval of this investigation. The following<br />
sections provide a variety of information about important aspects<br />
for each of the mapped intervals that are relevant to their use for<br />
carbon dioxide sequestration in geologic units. Additionally, a large<br />
reference list is included so users can research additional details on<br />
the geology of the intervals. The sections are arranged, geologically,<br />
from oldest to youngest.<br />
1. PRECAMBRIAN UNCONFORMITY SURFACE<br />
The Precambrian unconformity map represents the configuration<br />
of the surface separating Paleozoic Cambrian rocks (above) from<br />
Precambrian (Proterozoic) rocks (beneath). Despite differences in<br />
composition and age of the Precambrian below this unconformity,<br />
these rocks are generally referred to as “basement rocks,” and this is<br />
the definition used herein. The term basement is used because these<br />
rocks, and the structures contained within them, form the foundation<br />
upon which younger sedimentary rocks were deposited.<br />
The composition of Precambrian rocks below the unconformity<br />
surface is quite varied across the <strong>MRCSP</strong> study area. Rocks of the<br />
Grenville province (east of a line extending from south-central<br />
Kentucky, through western Ohio, and into the easternmost part of<br />
Michigan) are composed of Middle to Upper Proterozoic metamorphic<br />
rocks that have been intruded by igneous rocks. The age of<br />
metamorphism and faulting for the Grenville province rocks in the<br />
study area ranges from 1.1 to 0.880 billion years (Ga) (Lidiak and<br />
others, 1966; Hoppe and others, 1983; Keller and others, 1983; Van<br />
Schmus and Hinze, 1985; Lucius and Von Frese, 1988; Drahovzal<br />
and others, 1992). Protolith ages of the Grenville rocks are, at least<br />
in part, much older—1.457 Ga (Hoppe and others, 1983).<br />
Grenville province strata were thrust (in a present-day westnorthwestward<br />
direction) over other Precambrian terrains during<br />
the Grenville orogeny (Green and others, 1988; Pratt and others,<br />
1989; Culotta and others, 1990; Drahovzal and others, 1992; Stark,<br />
1997; Dean and Baranoski, 2002a,b). This orogenic event is thought<br />
to have created a large mountain chain that was mostly eroded during<br />
a subsequent period of prolonged Precambrian exposure. It is<br />
this erosional surface, creating the vast regional unconformity, that<br />
is mapped. The western limit of Grenville province rocks is called<br />
the Grenville front (Figure A1-1).<br />
West of the Grenville front, rocks of the East Continent rift basin<br />
(ECRB), the Granite-Rhyolite province, the Penokean province,<br />
and the Midcontinent rift system occur. Figure A1-1 illustrates the<br />
general extent of these Precambrian provinces (the relationships are<br />
also schematically shown on Figure 5 where rocks of the ECRB are<br />
represented by the Middle Run Formation and those of the Midcontinent<br />
rift system by the Cooper Harbor Conglomerate through the<br />
Jacobsville Sandstone).<br />
The Eastern Granite-Rhyolite province is an extensive Precambrian<br />
terrain that consists of various types of unmetamorphosed<br />
Mesoproterozoic igneous and dominantly felsic volcanic rocks.<br />
Age-dating of rocks from this province indicate they are of a similar<br />
age to the Grenville protoliths, ranging in age from 1.48-1.45 Ga<br />
(Lidak and Zietz, 1976; Hoppe and others, 1983; Denison and others,<br />
1984; Bickford and others, 1986).<br />
Figure A1-1.—Index map showing relationships of Precambrian tectonic<br />
provinces in and surrounding the <strong>MRCSP</strong> region. ECRB = East Continent<br />
Rift Basin, MRS = Midcontinent Rift System, and LPCM = Late Proterozoic<br />
continental margin. Map is modified from Drahovzal and others, 1992; Drahovzal,<br />
1997; and includes elements from Van Schmus and others, 1993 and<br />
VanSchmus and Hinze, 1993.<br />
The ECRB, a recently defined Middle and Late() Proterozoic<br />
province of rocks, lies west of, and partially buried beneath, the<br />
Grenville front. Rocks in the ECRB consist mainly of sedimentary<br />
clastics interbedded with felsic and mafic volcanic rocks (Shrake<br />
and others, 1990; Wickstrom and others, 1992a; Drahovzal and others,<br />
1992). Sedimentary and volcanic rocks of this interval encountered<br />
in drill holes consist primarily of lithic arenites and basalts<br />
that are thought to range in age from ≥1.5 to 0.6() Ga (Drahovzal<br />
and others, 1992; Drahovzal, 1997; Santos and others, 2002; Stark,<br />
1997; Drahovzal and Harris, 2004). Limited evidence suggests<br />
that some intervals of rocks within the ECRB may contain enough<br />
porosity and permeability to serve as saline formations, and thus,<br />
potential CO 2 reservoirs, (Drahovzal and Harris, 2004). However,<br />
very few wells have penetrated rocks of the ECRB; thus, the extent<br />
of such occurrences is presently unknown.<br />
49
50 CHARACTERIZATION OF GEOLOGIC SEQUESTRATION OPPORTUNITIES IN THE <strong>MRCSP</strong> REGION<br />
Another Middle Proterozoic rift system is found abutting the<br />
Grenville front in southern Michigan. This feature extends, in a circular<br />
fashion, northward through the upper peninsula of Michigan<br />
then southward, out of the <strong>MRCSP</strong> study area, through Minnesota,<br />
Iowa, and into Kansas. Termed the Midcontinent rift system, this<br />
feature exhibits similar lithologies and ages (1.2-1.1 Ga) to that of<br />
the ECRB (Daniels, 1982; Green, 1982; Van Schmus and Hinze,<br />
1985; Dickas, 1986). However, insufficient data exist to ascertain if<br />
these two rift systems are related (Drahovzal and others, 1992).<br />
The Penokean province is an early Proterozoic magmatic belt that<br />
consists of felsic and mafic volcanics (1.88-1.83 Ga) that contain<br />
younger granitic intrusions (1.83-1.7 Ga) (Smith, 1978; Sims and<br />
others, 1989; Van Schmus and Hinze, 1993). Penokean rocks are<br />
found only in portions of northern Michigan within the <strong>MRCSP</strong><br />
study area.<br />
Basement rocks occur at the surface in the upper peninsula of<br />
Michigan and consist of a variety of igneous, metamorphic, and sedimentary<br />
rocks that range from Archean to Proterozoic in age. East<br />
of the <strong>MRCSP</strong> study area, basement rocks are exposed in the Blue<br />
Ridge province where Grenville and Piedmont province metamorphic<br />
rocks occur in westward-thrusted blocks of the Appalachian<br />
mountains. Between these two areas, the basement rocks are in the<br />
subsurface. The top of basement ranges from surface exposures in<br />
Michigan and the Appalachians to depths that are speculated to be<br />
greater than 45,000-feet below sea level in southeastern Pennsylvania<br />
(Shumaker, 1996); however, no wells have penetrated nearly<br />
that deep, thus the actually depth remains unknown.<br />
Overall, the configuration of the basement can be seen as a bifurcating<br />
high-area in the west that has deeper areas to the southwest,<br />
north, and east (Figure A1-2). The shallowest areas on the map occur<br />
in west-central Ohio and north-central Kentucky, along the Cincinnati<br />
arch; here, basement rocks occur less than 2,000-feet below<br />
sea level. The Cincinnati arch extends from south-central Kentucky<br />
to west-central Ohio where it dissipates into the Ohio-Indiana platform,<br />
a broad expanse of relatively flat-lying terrain. To the northwest,<br />
the Kankakee arch extends across northern Indiana. Northeast<br />
of the Ohio-Indiana platform, and on the east side of the Grenville<br />
front, the Findlay arch, another positive structural element, occurs<br />
and extends northeastward into Canada.<br />
These positive features—the Cincinnati, Kankakee, and Findlay<br />
arches and the Ohio-Indiana platform (Figures 6 and A1-2)—separate<br />
the three major structural and sedimentary basins of this region:<br />
the Michigan basin to the north (centered in the lower peninsula of<br />
Michigan), the Illinois basin to the southwest (centered in southwest<br />
Indiana, south-central Illinois, and western Kentucky), and the Appalachian<br />
basin to the east (occurring in eastern Kentucky, eastern<br />
Ohio, West Virginia, western Maryland, and Pennsylvania). While<br />
subsidence was occurring in the three surrounding basins, the Cincinnati-Findlay-Kankakee<br />
arch complex remained relatively stable<br />
(at least compared to the rate of subsidence in the basins). However,<br />
during the major tectonic orogenies of the Paleozoic, some structural<br />
arching did occur and is reflected locally by the occurrence<br />
and distribution of various lithologic facies within specific intervals<br />
of rocks preserved in the <strong>MRCSP</strong> study area. Yet, despite this influence<br />
of the orogenic events of the rocks, most structural relief of the<br />
arches is thought to be the result of differential subsidence within<br />
the basins rather than tectonic arching of these structurally positive<br />
features (Wickstrom and others, 1992b). However, it should be<br />
pointed out that the majority of the subsidence of the surrounding<br />
basins occurred in the Silurian and later.<br />
The map of the structural surface of the Precambrian (Figure A1-<br />
2) represents its present-day configuration. The major sedimentary<br />
basins, as known today, did not exist during the Precambrian, nor<br />
during much of the Paleozoic. The reader will find many references,<br />
in later sections of this report, to proto-basins (e.g., proto-Michigan<br />
basin, etc.) meaning the early-formed portions of these basins.<br />
Throughout the early Paleozoic, these basins developed different<br />
configurations as the centers of deposition shifted with time (illustrated<br />
by the thickness (isopach) maps of units with different ages)<br />
in response to the multiple tectonic events that occurred during the<br />
Paleozoic. Mapping the structural elements (faults, highs, and lows<br />
as can be seen on various geologic surfaces) and the thickness of<br />
individual units as well as combined intervals of the area, reveals the<br />
geologic complexities of the region. Understanding these complexities<br />
are fundamental and necessary prerequisites in order to delineate<br />
where potential adequate, safe storage of CO 2 may be found.<br />
A few faults cut the Cincinnati arch, Ohio-Indiana platform,<br />
Kankakee arch and Findlay arch complex (Figure 6). One of<br />
these faults, the Grenville front fault, extends from south-central<br />
Kentucky, northward into eastern Michigan. In northern Ohio and<br />
southern Michigan, this fault system is expressed as the north-south<br />
trending Bowling Green fault system, which is locally exposed at<br />
the surface. To the south, in west-central Ohio, however, the fault<br />
is not exposed and a paucity of data limits our understanding of the<br />
feature. As a result, the extent and displacement on the fault during<br />
the Paleozoic is unknown and its position is imprecise, being based<br />
largely on potential field data (Lidiak and Zietz, 1976; Mayhew<br />
and others, 1982; Denison and others, 1984; Lidiak and others,<br />
1985). Further south, the Grenville front is once again expressed<br />
at the surface by a major fault system, the Lexington fault system,<br />
in central Kentucky.<br />
Several minor, northeast-oriented, down-to-southeast faults cut<br />
the axis and southwest flank of the Kankakee arch in northern Indiana<br />
and several northwest-trending faults cut the southeast flank of<br />
the Findlay arch in northwestern Ohio. On regional reflection seismic<br />
profiles in central Ohio, deep basement reflectors can be seen<br />
dipping to the southeast. To the east, in east-central Ohio, a zone of<br />
indistinct reflectors is present, while west-dipping reflectors occur<br />
in the basement of eastern Ohio. The transition zone between the<br />
southeast- to west-dipping reflectors is called the Coshocton zone<br />
(Figure 6) and is thought to represent an ancient continent to continent<br />
suture zone (Culotta and others, 1990).<br />
North of the Kankakee arch and west of the Findlay arch, the<br />
Michigan basin forms a nearly circular depression that reaches a<br />
depth of more than 15,000-feet below sea level (Warner, 1989). The<br />
configuration of the basin is largely based on oil and gas test wells<br />
because little publicly available seismic data exist for the region.<br />
Because of this, little is known of deep basement faulting in the<br />
basin. The Mid-Michigan rift part of the Midcontinent rift system<br />
(Figure 6) has been mapped largely on potential field data and is interpreted<br />
to form a Precambrian graben that extends northwestward<br />
across the basin (Hinze and others, 1971, 1975, 1997; Brown and<br />
others, 1982).<br />
South and southwest of the Kankakee arch, basement of the<br />
<strong>MRCSP</strong> study area dips southwest onto the northeast edge of the<br />
Illinois Basin, a feature that covers most of Illinois, southwestern<br />
Indiana and western Kentucky. The southwest dip is fairly regular at<br />
a rate of about a half of a degree (Buschbach, 1984; Rupp, 1991).<br />
To the east of the Cincinnati-Findlay arch is the Appalachian<br />
basin. The basement dips at an average rate of about one degree to<br />
the southeast in the Ohio part of the basin (Baranoski, 2002). Much<br />
of the basement configuration for Ohio is based on oil and gas well<br />
data, backed up by about 600 miles of publicly available reflection<br />
seismic data.
APPENDIX A: PRECAMBRIAN UNCONFORMITY SURFACE<br />
51<br />
-500 0<br />
EXPLANATION<br />
faults<br />
-10000<br />
5000 ft index contours<br />
1000 ft contours<br />
Elevationinfeet<br />
-2000<br />
-10000<br />
-49000<br />
-5000<br />
-15000<br />
-20000<br />
-2500<br />
-1000 0<br />
P R O J E C<br />
-5000<br />
-20000<br />
L I M I T O F<br />
M A P P I N G<br />
T L<br />
-15000<br />
I M I<br />
T<br />
-10000<br />
50 25 0 50 100 150 Miles<br />
50 25 0 50 100 150 200 Kilometers<br />
³<br />
Figure A1-2.—Structure map drawn on the top of the Precambrian unconformity.
52 CHARACTERIZATION OF GEOLOGIC SEQUESTRATION OPPORTUNITIES IN THE <strong>MRCSP</strong> REGION<br />
One of the most striking features in the Appalachian basin east<br />
and south of Ohio is the Rome trough (Figures and A1-2). The<br />
Rome trough is a graben that extends from the Lexington fault system<br />
in central Kentucky to at least as far northward as southwestern<br />
Pennsylvania (Woodward, 1961; McGuire and Howell, 1963; Harris<br />
1975; Wagner, 1976; Cardwell, 1977; Beardsley and Cable, 1983;<br />
Shumaker, 1986, 1996; Harper, 1989; Drahovzal and Noger, 1995;<br />
Gao and others, 2000; Wilson, 2000; Harris and others, 2004). The<br />
trough is the result of a Cambrian rifting event that down-dropped<br />
basement rocks thousands of feet. The apparent highly faulted nature<br />
of the Rome trough in eastern Kentucky is interpreted from the<br />
mapped surface geology and a relatively large number of basement<br />
tests that have been integrated with available seismic data (Drahovzal<br />
and Noger, 1995). Farther northeastward, in West Virginia<br />
and Pennsylvania, where the basin is deeper, there are fewer basement<br />
wells and less publicly available seismic data, making these<br />
areas appear to be less faulted. In eastern Kentucky, the structural<br />
relief on the top of the Precambrian is greater than 13,000 feet from<br />
the northern boundary of the Rome trough along the Kentucky<br />
River fault system to the trough’s deepest part near the center of<br />
the graben on the West Virginia state line. The trough in Kentucky<br />
steps down from a high northern boundary fault across a series of<br />
down-to-south normal faults into the center of the graben and then<br />
up again across a lower southern shoulder bounded by a smaller<br />
displacement fault, the Rockcastle River fault. The Rockcastle<br />
River fault changes from a low-displacement normal fault to a highdisplacement<br />
thrust fault in southern Kentucky where it was reactivated<br />
during the Alleghany orogeny (Drahovzal and Noger, 1995;<br />
Drahovzal and White, 2002). Many of the faults of the Rome trough<br />
were reactivated during subsequent Paleozoic orogenic movements<br />
and are expressed in Quaternary-age surface materials.<br />
The relatively symmetrical graben structure of the Rome trough,<br />
as mapped in Kentucky, changes near the West Virginia line to an<br />
asymmetric half graben, dipping southeast and bounded on the<br />
southeast by the major East-Margin fault (Gao and others, 2000;<br />
Wilson, 2000). Offsets along the East-Margin fault are up to 7,000<br />
feet. The half-graben structural character continues north into southwestern<br />
Pennsylvania to the cross-strike structural discontinuity referred<br />
to as the Pittsburgh-Washington lineament (Lavin and others,<br />
1982; Parrish and Lavin, 1982; Alexander and others, in press).<br />
North of the lineament, the structural character of the basement<br />
changes to a southeast dipping monocline cut by down-to-southeast<br />
dipping normal faults. Offsets across the lineament range from 0 to<br />
2,500 feet. Offsets along the down-to-southeast normal faults are<br />
generally less than 500 feet. Several other northwest-oriented lineaments<br />
cross the basement monocline farther to the northeast but<br />
exhibit relatively small offsets. The presence of the Rome trough<br />
north of this lineament is equivocal, but it has been postulated by a<br />
number of workers (Harris, 1975; Wagner, 1976; Shumaker, 1986,<br />
1996; Harper, 1989; Jacobi and others, 2004) to extend into New<br />
York in the north-central part of the state.<br />
The basement rocks of the <strong>MRCSP</strong> study area are extremely important<br />
because of their influence on the overlying Paleozoic rocks.<br />
Basement structure, in particular, has influenced the subsequent<br />
structural history of the Paleozoic rocks. In many cases, major basement<br />
faults were reactivated by later orogenic movement to fault<br />
the younger overlying rocks. Other basement faults show little or no<br />
reactivation and exhibit no shallow expression in Paleozoic rocks.<br />
Still other faults in Paleozoic rocks apparently have no basement<br />
roots, being solely the result of shallow tectonics. Careful study is<br />
required when assessing the faulting in a region to distinguish these<br />
three types of faults. The distinction between the types of faults and<br />
related structures is critical in the siting of sequestration targets in<br />
order to assure the integrity of seals associated with potential CO 2<br />
reservoirs. However, it is known that not all faults are permeable,<br />
or represent points of leakage, because mineralization may seal the<br />
faults, making them impermeable barriers rather than fluid pathways.<br />
Thus, site-specific investigations and testing are required to<br />
ascertain the integrity of any proposed CO 2-storage site.<br />
During <strong>Phase</strong> II of the Regional Carbon Sequestration Partnership<br />
studies, additional data on the basement structures will be<br />
required for those areas that are being considered for CO 2 injection.<br />
Reflection seismic profiles will be required to provide information<br />
on structure, especially faults that could compromise the reservoir<br />
seals. The data may also provide an indication of subsurface lithology,<br />
facies/permeability changes, and may even reveal some<br />
permeable basement zones, which may themselves be candidates<br />
for sequestration. Such initial seismic data will be critical in determining<br />
whether further examination of the area is warranted based<br />
on basement faulting and structure, as well as the structure of shallower<br />
Paleozoic sequestration target zones. Seismic reflection data<br />
will also act as a guide to the location of any subsequent drill holes,<br />
indicating best placement for injection, or where to drill to provide<br />
the most useful analytical information. Subsequent drill-hole and<br />
core data will not only provide critical information on reservoir and<br />
seal properties in the target sequestration zones, but will provide<br />
important basement lithologic and structural data that may have<br />
bearing and influence on overlying reservoirs.<br />
2. CAMBRIAN BASAL SANDSTONES<br />
The basal sandstone interval includes some of the most promising<br />
targets for CO 2 sequestration within the <strong>MRCSP</strong> study area. The<br />
Mt. Simon Sandstone, which is part of this mapped interval, has the<br />
largest sequestration potential of any individual geologic unit within<br />
the <strong>MRCSP</strong> study area (see volume calculations section). However,<br />
the Mt. Simon has also been one of the most misunderstood geologic<br />
units within the region. Many previous workers have assumed<br />
the Mt. Simon was present across much of the region (Janssens,<br />
1973; Havorka and others, 2000; Gupta, 1993) when, in fact, recent<br />
research has shown that the true Mt. Simon pinches out in central<br />
Ohio (Baranoski, in preparation). East of this pinch-out, thinner, less<br />
continuous sandstones are found in this “basal sand” position. Thus,<br />
for the <strong>Phase</strong> I <strong>MRCSP</strong> assessment, these sandstone intervals have<br />
been mapped as one group across the entire region.<br />
Cambrian stratigraphic nomenclature for the <strong>MRCSP</strong> study area<br />
is problematic. A cursory examination of the geologic correlation<br />
chart (Figure 5) demonstrates a lack of regional consistency in<br />
currently accepted geologic terms as well as a number of states<br />
simply using the term “basal sandstone.” In general, this problem<br />
grew from the practice of taking geologic contacts and formalized<br />
terms from outcrops studied in the upper Mississippi Valley and Appalachian<br />
fold and thrust belt and carrying them many miles into the<br />
deep subsurface of the region by analyzing drilling cuttings from<br />
sparse well control and interpreting correlative surfaces. The advent<br />
of modern geophysical logs allowed more detailed regional correlations;<br />
however, geologic terms remain entrenched provincially,<br />
and numerous correlation difficulties are not resolved. While the<br />
same can be said for many younger geologic units, the problem is<br />
especially acute within the deep Cambrian strata because of the low<br />
number of wells, and great distances between wells, that have been
APPENDIX A: CAMBRIAN BASAL SANDSTONES<br />
53<br />
drilled into, or through, this interval (Figure 10). The correlation difficulties<br />
and inconsistencies illustrate that an adequate treatment of<br />
nomenclature is beyond the scope of this project. Thus, the <strong>MRCSP</strong><br />
geology team has simply mapped the interval within which “basal”<br />
sandstones occur across the region. In general, this “basal” interval<br />
includes all units deposited on the Precambrian unconformity. The<br />
basal interval consists of a complex assemblage of Early, Middle<br />
and Furongian (previously Late) Cambrian clastic and carbonate<br />
rocks. Both the top and base of this interval are diachronous, which<br />
further complicates correlation and mapping of consistent, repeatable,<br />
and reliable surfaces throughout the region.<br />
The complexity of this basal interval is reflected by, and largely<br />
controlled by, structure and basin architecture of the Rome trough,<br />
and proto-Illinois/Michigan and Appalachian basins. The underpinning<br />
Precambrian basement complex and poorly understood<br />
regional Cambrian tectonics controlled subsidence, sediment input,<br />
and facies variations within and around the depositional centers of<br />
this interval. These geologic factors as well as multiple episodes<br />
of diagenesis ultimately control porosity and permeability of these<br />
highly heterogeneous saline reservoirs.<br />
STRATIGRAPHY<br />
The stratigraphically complex basal Cambrian sandstones lie unconformably<br />
on the Precambrian basement. For the region, we have<br />
mapped four basic units within this interval (Figures 8 and A2-1),<br />
each with distinctive stratigraphic and injection reservoir characteristics:<br />
1) the Mt. Simon Sandstone of the proto Illinois/Michigan basin<br />
area (Michigan, Indiana, western Kentucky, and western Ohio),<br />
2) the unnamed dolomitic sandstones of the Conasauga Group<br />
(eastern Ohio, northern Kentucky, western Pennsylvania, and West<br />
Virginia), 3) Potsdam Sandstone (northern and north-central Pennsylvania),<br />
and 4) stratigraphically older unnamed basal Cambrian<br />
(Rome trough) sandstones in the fault-bounded Rome trough and<br />
eastern proto-Appalachian basin (eastern Kentucky, West Virginia,<br />
and western Pennsylvania). This unnamed basal sandstone of the<br />
Rome trough may be equivalent to the Antietam Formation as<br />
named in eastern Pennsylvania and Maryland. The nature of the<br />
transition from the Potsdam Sandstone of northwestern Pennsylvania<br />
to the Antietam Sandstone and Rome trough unnamed sandstones<br />
is unclear because of a lack of deep wells in southwestern<br />
Pennsylvania and West Virginia. The transition from the Mt. Simon<br />
Sandstone of the Illinois and Michigan basins to the less continuous<br />
sands in the east can be clearly seen on the thickness map (Figure<br />
A2-2)—east of western Ohio there are no large accumulations of the<br />
basal sands as there are in Michigan and Indiana.<br />
The Mt. Simon consists of a lower subunit of shaley, arkosic<br />
sandstone and an upper subunit of relatively shale-free, massive<br />
sandstone in the eastern proto-Illinois/Michigan basin and western<br />
Ohio area. The Mt. Simon pinches out eastward, in central Ohio,<br />
into the western proto-Appalachian basin where unnamed Conasauga<br />
sandstones and the Potsdam Sandstone lie unconformably on<br />
the Precambrian. The unnamed Conasauga sandstones and the Potsdam<br />
Sandstone are feldspathic and dolomitic and stratigraphically<br />
distinctive from the Mt. Simon. Unnamed Conasauga sandstones,<br />
possible lateral equivalents to the Mt. Simon, may exist deeper in<br />
the proto-Appalachian basin/Rome trough based on regional thickness<br />
relationships. However, this hypothesis cannot be tested in<br />
the absence of additional well data and reliable geochronological<br />
markers. In Kentucky, the basal sandstones north of the northern<br />
boundary fault of the Rome trough are considered Mt. Simon, while<br />
deeper sandstones, occurring south of this fault, are simply called<br />
unnamed Rome trough sandstones. The unnamed basal Cambrian<br />
(Rome trough) sandstones are considered older than the Mt. Simon,<br />
Potsdam, and unnamed Conasauga sandstones based on their stratigraphic<br />
relationships observed in sparse deep-well control and limited<br />
seismic reflection data. The poorly understood, unnamed basal<br />
Cambrian sandstones were included within this mapping interval<br />
because of the proximity to the Precambrian unconformity and the<br />
potential for containing thick, extensive saline reservoirs. Seismic<br />
data suggests further study is warranted to locate potential unnamed<br />
basal Cambrian sandstone reservoirs.<br />
ORIGIN OF NAMES, TYPE SECTION, SIGNIFICANT<br />
EARLIER STUDIES ON THIS INTERVAL<br />
The following list provides significant references for each of the<br />
correlative units of the basal sandstones interval in the <strong>MRCSP</strong><br />
<br />
<br />
<br />
<br />
<br />
<br />
<br />
<br />
<br />
<br />
<br />
<br />
<br />
<br />
<br />
<br />
<br />
<br />
<br />
<br />
<br />
Figure A2-1.—Generalized schematic cross section illustrating the relationships of the mapped basal sandstones<br />
to other geologic units and structure.
T<br />
54 CHARACTERIZATION OF GEOLOGIC SEQUESTRATION OPPORTUNITIES IN THE <strong>MRCSP</strong> REGION<br />
500<br />
EXPLANATION<br />
Faults<br />
500<br />
500 ft Index contours<br />
50 ft contours<br />
Thickness in feet<br />
2000<br />
1000<br />
0<br />
1000<br />
500<br />
300<br />
100<br />
M A<br />
P P I N G<br />
O F<br />
P R O J E C<br />
M I<br />
T L<br />
L I<br />
I M I<br />
T<br />
0<br />
50 25 0 50 100 Miles<br />
50 25 0 50 100 150 Kilometers<br />
³<br />
Figure A2-2.—Map showing the thickness of the Cambrian basal sandstones interval.
APPENDIX A: CAMBRIAN BASAL SANDSTONES<br />
55<br />
study area (Figure 5). The name Mt. Simon Sandstone was first used<br />
by Walcott (1914) to designate a sandstone exposed near Eau Claire,<br />
Wisconsin (the type section). The Potsdam, described by Emmons<br />
(1838), was named for sandstone cropping out at Potsdam, New<br />
York. Haynes (1891) named the Conasauga Group for exposures of<br />
shale and limestone in the Conasauga Valley of northwest Georgia.<br />
The reader is referred to the following papers which include discussions<br />
on formal and informal nomenclature relative to the lower<br />
Sauk interval in statewide to semi-regional context (Cohee, 1948;<br />
Fettke, 1948; Sloss and others, 1949; Freeman, 1953; McGuire and<br />
Howell, 1963; Catacosinos, 1973; Janssens, 1973; Rickard, 1973;<br />
Calvert, 1974; Wagner, 1976; Bricker and others, 1983; Patchen and<br />
others, 1985a,b; Shaver and others, 1986; Rupp, 1991; Ryder, 1991,<br />
1992a,b; Riley and others, 1993; Ryder and others, 1995, 1996; Harris<br />
and others, 2004).<br />
NATURE OF LOWER AND UPPER CONTACTS<br />
The basal sandstone interval directly overlies the Precambrian unconformity<br />
surface, which locally may have significant topographic<br />
and/or structural relief (most apparent in western Ohio where well<br />
control is greatest). In some local areas, the entire interval is missing<br />
or is thicker due to incised channel development. The thickness of<br />
the interval can vary dramatically over such features, thus affecting<br />
reservoir quality in these areas. The lower contact is generally sharp<br />
due to a regolith found at the base of these rocks, but may appear<br />
gradational on geophysical logs depending on the underlying Precambrian<br />
lithology. A decrease in grain size and an increase in lithic<br />
and feldspathic components at the top of the Mt. Simon make the<br />
upper contact, where it underlies the Eau Claire Formation, appear<br />
gradational in the western part of the <strong>MRCSP</strong> study area. The upper<br />
contact is moderately gradational in the eastern region where thin<br />
discontinuous dolomitic sandstone layers of the Conasauga Group<br />
and Potsdam mark the top of the interval. The upper contact of the<br />
unnamed basal sandstones in the Rome trough and the adjacent<br />
eastern region is considered disconformable with the overlying<br />
Tomstown and Rome Formations (Harris and others, 2004).<br />
Gamma-ray log response of the Mt. Simon in western Ohio and<br />
the proto-Illinois/Michigan basin is relatively lower than that of the<br />
overlying Eau Claire Formation, indicating sandstone with lower<br />
feldspar, shale, and glauconite content. Gamma-ray curve shapes<br />
range from blocky-, to funnel-, and bell-shaped. Density and photoelectric<br />
(PE) logs are indicative of relatively higher quartz content<br />
of the Mt. Simon. The log response of the lower portion of the Mt.<br />
Simon locally appears cyclic, and may representing alternating beds<br />
of quartz arenite, shale, arkose, and sublitharenite. Conversely, the<br />
gamma-ray log response of the unnamed Conasauga sandstones and<br />
Potsdam Formation is higher than that of the Mt. Simon, an indicator<br />
of higher feldspar, shale, and glauconite content. Gamma-ray<br />
curve shapes for the unnamed Conasauga sandstones and Potsdam<br />
Formation are typically more ”spikey” than those of the Mt. Simon,<br />
indicating the greater cyclicity of lithologic components. PE logs of<br />
the Conasauga and Potsdam also indicate a higher dolostone content<br />
than the Mt. Simon. In eastern Kentucky, core from one well<br />
indicates that basal sandstones in the Rome trough are commonly<br />
arkosic, an attribute that affects the gamma ray log, giving a more<br />
shaley appearance.<br />
LITHOLOGY<br />
The Mt. Simon Sandstone is a white, pink, or purple, fine- to<br />
coarse-grained, moderately to well-sorted, quartz arenite that can be<br />
arkosic. The Mt. Simon also contains thin interbeds of red, green,<br />
gray, or black, sandy to silty shale. Locally, thin beds of tight, silicacemented<br />
quartz arenite occur. Bedding thickness ranges from thin<br />
to medium with many beds containing lamina and wisps of finer<br />
grained materials. Graded beds and cross bedding are common. Bioturbation<br />
is present but generally, poorly developed. However, in<br />
Michigan, preservation of burrowing has been observed to increase<br />
upward towards the contact with the overlying Eau Claire. Grains<br />
are sub-rounded to rounded, commonly etched and generally poorly<br />
cemented and friable. The lower portion is commonly conglomeratic<br />
and shaley, and stained by hematite, some of which is mottled.<br />
In the Michigan subsurface, dolomite cement is common in some<br />
intervals around the basin margin. Deeper in the proto-Michigan<br />
basin, below 7,000 feet, there is pervasive quartz overgrowth cement.<br />
Secondary porosity is common where carbonate cement and<br />
feldspar has been dissolved.<br />
The unnamed Conasauga sandstone and Potsdam Sandstone consist<br />
of interbedded, cyclical-appearing sandstone and dolostone. The<br />
sandstone components are typically white to light-gray and pinkish<br />
gray, and fine- to medium-grained, with moderate- to well-sorted,<br />
sub-rounded to angular grains, although arkosic sandstones occur in<br />
the basal portions of the Potsdam in northwestern Pennsylvania and<br />
south-central New York. Authigenic and primary feldspar, glauconite,<br />
and bioturbated zones are common. Normal and reverse graded<br />
bedding and trough cross-bedding are common thoughout the unit.<br />
Coarse to pebbly, normal graded bedding, and thin zones of rip-up<br />
clasts mark thin intercyclic intervals. Bedding ranges from thin to<br />
medium and massive, to interbedded with laminated and wispy<br />
dark gray shale. Bioturbation, including filled vertical burrows<br />
(Skolithos), graded bedding, and cross-bedding are common. The<br />
dolostone is light to medium gray and pinkish gray, cryptocrystalline,<br />
microcrystalline, medium crystalline, and arenaceous. Minor<br />
beds and laminae of gray to black shale, frosted quartz grains, vugs<br />
filled with selenite and dolomite crystals, ooids, pelloids, disseminated<br />
pyrite, laminae and thin beds of glauconite, apatite, flat pebble<br />
conglomerate, rip-up clasts, mudcracks, and clay-rich zones are also<br />
present (Harris and others, 2004; Baranoski, in preparation).<br />
The basal sandstones of the Rome trough are arkosic and, based<br />
upon a core from a well in Wolfe County, Kentucky, are interbedded<br />
with red and green shale, siltstone, sandy shale, and nodular evaporites.<br />
The unit is locally conglomeratic and may contain poorly<br />
developed cross beds (Harris and others, 2004).<br />
DISCUSSION OF DEPTH AND THICKNESS RANGES<br />
Depth to the top of the basal sandstones interval ranges from approximately<br />
2,000-feet below sea level (bsl) in northern Ohio and<br />
northwestern Indiana on the Ohio-Indiana platform to 14,000 feet<br />
bsl in the center of the Michigan basin, and 20,000 to 25,000 feet<br />
bsl in the Rome trough of southwestern Pennsylvania (Figure A2-3).<br />
Thickness ranges from zero, where local Precambrian topography<br />
(Janssens, 1973; Baranoski, 2002) exists, to more than 2,500 feet in<br />
northwestern Indiana and east-central portion of Illinois, just west<br />
of the <strong>MRCSP</strong> study area (Figure A2-2). This thick accumulation<br />
of sediments, or depocenter, is unique in its location, not being coincident<br />
with depocenters for any younger stratigraphic units. The<br />
Mt. Simon reaches a thickness in excess of 1,300 feet in east-central<br />
Michigan (Figure A2-2), where again this depositional pattern is<br />
not seen in other geologic units. Eastward, away from the Illinois<br />
and Michigan basins, the Mt. Simon is 50 to 300 feet thick in Ohio<br />
and adjacent central Kentucky. In eastern Kentucky, the Mt. Simon<br />
gradually thins eastward toward the Rome trough. The unnamed
-5000<br />
56 CHARACTERIZATION OF GEOLOGIC SEQUESTRATION OPPORTUNITIES IN THE <strong>MRCSP</strong> REGION<br />
EXPLANATION<br />
Faults<br />
5000 ft index contours<br />
500 ft contours<br />
Mean sea elevation (feet)<br />
-2000<br />
-10000<br />
-19000<br />
-2000<br />
-5000<br />
-10000<br />
F M<br />
A P P<br />
I N G<br />
T O<br />
P R O J E C<br />
T L<br />
L I M I<br />
I M I<br />
T<br />
50 25 0 50 100 Miles<br />
³<br />
50 25 0 50 100 150 Kilometers<br />
Figure A2-3.—Structure map drawn on the top of the Cambrian basal sandstones interval.
APPENDIX A: CAMBRIAN BASAL SANDSTONES<br />
57<br />
basal sandstones, Conasauga sandstones, and Potsdam Sandstone of<br />
eastern Ohio, West Virginia, and Pennsylvania range from 50 to 150<br />
feet. However, this is a total thickness of the interval; the amount<br />
of porous/permeable sandstone within the interval is uncertain and<br />
is highly variable and discontinuous. A recent deep well in Mason<br />
County, West Virginia encountered less than 10 feet of porous/<br />
permeable sandstone within this interval.<br />
Within the Rome Trough, the basal sandstones appear to thicken<br />
southward independent of major faults, indicating that the sandstones<br />
may be pre-rift deposits unaffected by movement on the<br />
major bounding faults of the Trough. Post-depositional structural<br />
movement, however, influenced depth and local thickness preservation<br />
(Harris and others, 2004). Some of the variability in thickness<br />
may also indicate structural influences from localized faulting, especially<br />
where there are substantial thickness changes in the basal<br />
sandstone across relatively short distances.<br />
DEPOSITIONAL ENVIRONMENTS/<br />
PALEOGEOGRAPHY/TECTONISM<br />
During late Precambrian and early Paleozoic time, the <strong>MRCSP</strong><br />
states were part of a large crustal plate, named Laurentia, which<br />
occupied a position straddling the equator (Dott and Batten, 1976).<br />
Laurentia included the present-day Canadian Shield and possibly<br />
the Transcontinental arch. In late Precambrian time, the Laurentian<br />
plate rifted away from an adjacent plate, creating the Iapetus Ocean<br />
between them (Dietz, 1972). At this time, the southern margin of<br />
Laurentia became a passive continental margin. During early and<br />
middle Cambrian time, the Grenville rocks in what is now the Appalachian<br />
basin states remained exposed to erosion. Deposition of<br />
sand on the Precambrian unconformity began late in the Middle<br />
Cambrian as sea level rose and the southern margin of Laurentia began<br />
to subside in response to the sediment loading. During the Lower<br />
or Middle Cambrian, the Rome trough formed along the southern<br />
margin of Laurentia. Harris (1978) described the Rome trough as<br />
the failed arm of a triple junction (an aulogen), extending from the<br />
Mississippi embayment through Kentucky to Pennsylvania. The<br />
aulacogen is thought to have originated on incipient Precambrian<br />
crustal-block faults derived from stresses during the opening of the<br />
Iapetus Ocean. Thus, the basal sandstones interval of the <strong>MRCSP</strong><br />
study area is a transgressive sequence of sandstone, shales and<br />
carbonates deposited on the regional Precambrian uncomformity<br />
surface. Both lower and upper boundaries are highly diachronous,<br />
making regional correlations difficult and tenuous at best. The basal<br />
sandstones in the Rome trough are not correlative to the Mt. Simon<br />
and unnamed Conasauga sandstones. The Mt. Simon and unnamed<br />
Conasauga sandstones are considered younger than the unnamed<br />
basal sandstones of the Rome Trough.<br />
Depositional environments for the basal sandstones range widely,<br />
from marginal marine, to marine, littoral, fluvial, and estuarine<br />
(Jannssens, 1973; Driese, 1981; Haddox and Dott, 1990). The<br />
marine influence is evident where sandstone intertongues with dolostone<br />
in the Appalachian basin area. In the Rome trough, red and<br />
green shales and siltstones with nodular evaporates interlayer with<br />
the sandstones, suggesting very shallow, subtidal to intertidal deposition,<br />
with restricted marine circulation (Harris and others, 2004).<br />
The regional shoreline generally migrated northward from the<br />
proto-Illinois/Michigan basin, Rome trough and eastern proto-Appalachian<br />
basin to the Canadian shield during transgression (Milici<br />
and de Witt, 1988).<br />
SUITABILITY AS A CO 2<br />
INJECTION TARGET OR SEAL UNIT<br />
The lithology of the intervals mapped varies, from the typical Mt.<br />
Simon Sandstone in western Ohio, Indiana, and Michigan to the<br />
basal shaley and arkosic sandstones of the Rome trough and sandy<br />
dolostones of the unnamed Conasauga sandstones. The Mt. Simon<br />
has overall higher porosity and permeability based on core analyses<br />
and a 35-year history of relative higher injectivity rates and volumes<br />
than the unnamed Conasauga sandstones. Data for the basal sandstones<br />
of the Rome trough is scant.<br />
The Mt. Simon of the Indiana-Ohio platform has good to excellent<br />
reservoir quality - gross thickness (200 to 350 feet), porosity<br />
(average 14 percent), and permeability (range 10 to 200+ millidarcies<br />
[md]) (Janssens, 1973; Clifford, 1975). Salinity ranges from<br />
111,000 to 316,000 milligrams per liter (mg/L) with an average<br />
specific gravity of about 1.075 grams per cubic centimeter (g/cc).<br />
Original reservoir pressure at 3,100 feet ranges from 1,000 to 1,100<br />
pounds per square inch (psi).<br />
Table A2-1 lists information from Ohio Class-1 injection wells,<br />
from which a number of observations can be made. Those sites that<br />
list the Mt. Simon as the injection interval (all in western Ohio) have<br />
higher porosities and permeabilities, thicker injection zones, higher<br />
injection rates, and larger cumulative volumes injected. In general,<br />
the Mt. Simon Class-1 sites have also been in operation longer<br />
and, with the exception of the Aristech site, are still in operation.<br />
The Class-1 facilities in northeastern Ohio that utilized the thinner<br />
sandstones and carbonates of the Conasauga Group (Reserve Environmental<br />
Services and Tomen Agro) could not attain very high injection<br />
rates. In fact, the Reserve Environmental Services site could<br />
not inject enough material to sustain its operation. This information<br />
should prove useful when examining prospective sites/reservoirs for<br />
potential CO 2 injection.<br />
In Kentucky, there has been only one attempt to inject waste into<br />
the Mt. Simon, near Louisville, west of the <strong>MRCSP</strong> study area.<br />
Upon drilling, the sandstones were found to be tight, and a porous<br />
zone within the shallower Copper Ridge Dolomite was ultimately<br />
chosen as the injection horizon.<br />
The overall reservoir character of the basal sandstones (Rome<br />
trough) is not known, but suspected to be relatively poor because<br />
the sandstones are shaley. However, proprietary seismic data in<br />
the region indicates areas where thick, well-developed, sandstones<br />
might be present. Future drilling would be required to confirm the<br />
presence and injection properties of the sandstones. Further characterization<br />
of injection properties of all the basal sandstones and<br />
other prospective reservoir units will be a goal of <strong>Phase</strong> II efforts<br />
within the <strong>MRCSP</strong> study area.<br />
The overlying shales, siltstones, and carbonates of the Eau Claire<br />
through Copper Ridge interval provide an excellent vertical seal<br />
system for the Mt. Simon Sandstone in the western part of the<br />
<strong>MRCSP</strong> study area. Measured vertical permeabilities of the shale<br />
and siltstone intervals typically range from unmeasurable (< .001<br />
md) to 0.01 md. Some sandy intervals within the seal sequence<br />
may have significantly more permeability and porosity, providing<br />
good zones to absorb and trap any CO 2 that might make it through<br />
the lower permeability layers. As depth to the Mt. Simon increases<br />
in the Michigan basin, additional seal units are stacked above this<br />
interval. Should injection intervals be found within the unnamed<br />
Conasauga sandstones, Potsdam Sandstone, or Rome trough sandstones,<br />
a very thick succession of overlying carbonates of the Knox
58 CHARACTERIZATION OF GEOLOGIC SEQUESTRATION OPPORTUNITIES IN THE <strong>MRCSP</strong> REGION<br />
Table A2-1.—Class 1 well data from Ohio<br />
Allowable Depth to Thickness Total<br />
Injectate Avg/Max Cumulative<br />
Date No. No. of<br />
Company County surface Injection Injection Injection confi ning Porosity Permeability Salinity Specifi c<br />
Flow volume<br />
of 1st of active plugged<br />
injection interval interval Unit interval (percent) (millidarcies) (mg/L) Rate injected*<br />
gravity Rate well wells wells<br />
pressure (feet) (feet) (feet) (gal/min) (gals)<br />
Cargill Incorporated Cuyahoga 150 psi 1,294 87 Oriskany 1,000 11 650 184,000 to 1.2 20-40 43,268,128 1971 INACTIVE 1<br />
(Akzo Salt) 277,000 Plugged 1999<br />
Aristech Scioto 1,650 psi 5,550 40 Conasauga/ 5,000 12 27 258,000 to 1.02 60-75 1,454,889,519 1968 INACTIVE 2<br />
Mt. Simon 316,000 through 4/96 Plugged 1996<br />
AK Steel Butler 634 psi 2,975 260 Mt. Simon 2,500 13 55 unknown 1.21 30-40 519,800,000 1969 2<br />
(Armco Steel)<br />
BP Chemicals Allen 825 psi 2,800 340 Mt. Simon 2,350 14 10 to 100 122,500 1.025 120-256 6,334,547,975 1968 4<br />
Waste Management Sandusky 790 psi 2,800 140 Conasauga/ 1,900 14 42 111,000 1.15 40 - 90 1,245,000,000 1976 4 3<br />
of Ohio Mt. Simon<br />
(Chemical Waste<br />
Management)<br />
Empire Reeves Richland 1,500 psi 4,990 500 Conasauga 4,490 10 9 unknown 1.195 35 10,314,933 1967 INACTIVE 1<br />
Steel Div. through 10/70 Plugged 1970<br />
Tomen Agro Lake 1,689 psi 5,643 450 Conasauga 5,130 8 4 to 6 195,000 to 1.025 unknown 630,634,412 1971 INACTIVE<br />
(Zeneca Ag; ICI 283,000 Plugged 1996<br />
Americas)<br />
Reserve Ashtabula 1,450 psi 5,469 500 Conasauga 4,899 7 3 to 10 182,000 1.09 15 - 20 89,344,171 1985 INACTIVE 1<br />
Enviromental through 12/94 Plugged 1994<br />
Services<br />
TOTAL =<br />
10,327,799,138<br />
*Most volume data from Ohio EPA, Division of Drinking and Ground Waters. Cumulative volumes through December, 2003.
APPENDIX A: BASAL SANDSTONES TO TOP OF COPPER RIDGE INTERVAL<br />
59<br />
Group, Beekmantown Group, Black River and Trenton limestones,<br />
and the Upper Ordovician clastics of the Cincinnati Group, Reedsville<br />
Shale, and Martinsburg Formation (Figure 5) directly overlie<br />
the injection interval. Additional layers of Middle and Upper Paleozoic<br />
clastics, carbonates, and evaporates would be added on top of<br />
this with increasing depth.<br />
3. BASAL SANDSTONES TO TOP OF COPPER RIDGE INTERVAL<br />
The stratigraphic interval from the top of the basal sandstones to<br />
the top of the Copper Ridge Dolomite (Figure 5) serves largely as<br />
a confining interval for possible injection in the underlying basal<br />
sandstones of the <strong>MRCSP</strong> study area. In some locations, however,<br />
units within the interval may be possible injection targets, although<br />
even for these units, the remainder of the interval would be considered<br />
a seal.<br />
The Basal Sandstones to the top of the Copper Ridge Interval can<br />
be divided into three informal sub-intervals across the region for<br />
descriptive purposes: 1) a thick clastic and carbonate interval above<br />
the basal sandstones within the Rome trough, including the Tomstown<br />
Dolomite, Rome Formation, Waynesboro Formation, and<br />
the lower part of the Conasauga Group; 2) an interval dominated<br />
by clastics in the west and carbonates in the east above the basal<br />
sandstones outside of the Rome trough, and continuous above the<br />
trough-filling interval, which includes the Eau Claire Formation,<br />
Conasauga Group, Elbrook Formation, and Warrior Formations;<br />
and 3) an upper, carbonate-dominated interval, that is extensive<br />
across the region, including the upper Munising Group, Trempealeau<br />
Formation, Davis Formation, Potosi Dolomite, Copper Ridge<br />
Dolomite, Gatesburg Formation, and Conococheague Group (Figure<br />
5). Stratigraphic relationships and thicknesses for these units in<br />
the eastern half of the <strong>MRCSP</strong> study area are based on a series of<br />
published regional cross sections (Ryder, 1991, 1992a; Ryder and<br />
others, 1992, 1996, 1997).<br />
Tomstown/Rome/Waynesboro/Lower Conasauga Formations—Units<br />
in this sub-interval are mostly confined to the Rome trough of<br />
eastern Kentucky, West Virginia, and Pennsylvania, and the eastern<br />
proto-Appalachian basin as far east as Maryland (Figures 5 and 6).<br />
The Shady or Tomstown Dolomite (250 to 500 feet thick) overlies<br />
the basal sandstone in the Rome trough and areas south and east<br />
of the Rome trough. The Shady/Tomstown is overlain by mixed<br />
clastics and carbonates of the Rome Formation in the Rome trough.<br />
Across the northern bounding faults of the Rome trough in eastern<br />
Kentucky, the Rome Formation may thicken from less than 300 feet<br />
to more than 6,000 feet, depending on usage (definitions of the top<br />
of the Rome have varied). In West Virginia, dramatic increases in<br />
thickness also occur across the southern or eastern fault boundary,<br />
although this is based on a limited number of wells deep enough<br />
to confirm the exact offset across the southern bounding faults<br />
into southern West Virginia. Eastward into northern West Virginia,<br />
Maryland, and Pennsylvania, the Shady/Tomstown Dolomite is<br />
overlain by shale and siltstone of the Waynesboro Formation (Figure<br />
5). The Waynesboro (400 to 500 feet thick) is equivalent to that<br />
part of the Rome Formation that extends south and east of the Rome<br />
trough. The Rome is overlain by the Conasauga Group (Figure 5).<br />
Like the underlying Rome Formation, the lower part of the Conasauga<br />
shows dramatic thickening into the Rome trough (from less<br />
than 200 feet north of the Rome trough, to more than 5,000 feet<br />
within the trough). In eastern Kentucky and West Virginia, six formations<br />
are defined within the Conasauga, from oldest to youngest:<br />
1) the Pumpkin Valley Shale (0 to 300 feet thick); 2) the Rutledge<br />
Limestone (0 to 1,200 feet thick); 3) the Rogersville Shale (0 to 700<br />
feet thick); 4) the Maryville Limestone (0 to 2,400 feet thick); 5) the<br />
Nolichucky Shale (0 to 500 feet thick); and 6) the Maynardsville<br />
Limestone (0 to 200 feet thick). The three lower formations are confined<br />
to the Rome trough, as is the lower part of the Maryville. The<br />
three upper units extend beyond the trough, but become thinner, and<br />
pinch out or merge with lateral units.<br />
Eau Claire/Conasauga/Elbrook/Warrior Formations—In the<br />
proto-Illinois/Michigan basin of Indiana and Michigan (Figure 6),<br />
the basal sandstone is overlain by the Munising Group (Figure 5).<br />
The lower part of the Munising is called the Eau Claire Formation<br />
(100 to 1,000 feet thick), which extends from Indiana and Michigan<br />
into western and central Ohio and northern Kentucky (Shaver and<br />
others, 1986; Rupp, 1991; Catacosinos and others, 2001). Eastward<br />
from central Ohio, the Eau Claire Formation thins and merges laterally<br />
into the Conasauga Group. That part of the Conasauga Group<br />
above the basal sand in southeastern Ohio and northeastern Kentucky<br />
represents only the upper part of the Conasauga preserved to<br />
the southeast in the Rome trough (Figure 5). In the trough, the upper<br />
third of the Maryville Limestone, the Nolichucky Shale, and the<br />
Maynardsville Limestone are equivalent to the Eau Claire. Farther<br />
east, the upper two thirds of the Maryville Limestone interfingers<br />
with the Elbrook Formation/Dolomite, and the Nolichucky and<br />
Maynardsville pinch out or are truncated beneath the lower sandy<br />
interval of the overlying Copper Ridge Dolomite. The lower third<br />
of the Elbrook (also called the Honaker Dolomite) is equivalent to<br />
the lower part of the Conasauga Group in the Rome trough, as well<br />
as an unnamed limestone in the upper Rome Formation. North and<br />
east into Pennsylvania, the Elbrook is estimated to be more than<br />
3,000 feet thick (Kauffman, 1999). In central and western Pennsylvania,<br />
the lower part of the Elbrook is equivalent to the Pleasant Hill<br />
Limestone/Formation (400 to 500 feet thick), and the upper part of<br />
the Elbrook is equivalent to the Warrior Formation (400 to 1,200<br />
feet thick). In some parts of western Pennsylvania, the Warrior Formation<br />
rests directly on the Potsdam Sandstone, which is the basal<br />
sandstone in this area, but younger than the basal sandstone in the<br />
Rome trough (Figure 5).<br />
Upper Munising/Trempealeau/Potosi/Davis/Copper Ridge/Gatesburg/Conococheague<br />
Formations—In Michigan, this sub-interval<br />
includes the upper part of the Munising Group and the overlying<br />
Trempealeau Formation (Milstein, 1983) (Figure 5). The Munising<br />
consists of the Galesville Sandstone (less than 100 to 600 feet thick)<br />
and Franconia Formation (100 to 500 feet thick). The Galesville<br />
and Franconia thicken toward the Chicago area in northern Illinois<br />
(Becker and others, 1978). In Indiana, the Ironton Sandstone occurs<br />
between the Galesville and Franconia within the upper Munising<br />
Group, and these units are restricted to the northwestern part of<br />
the state (Becker and others, 1978). Where the Munising Group<br />
thins southward and eastward in Indiana, the upper Munising is<br />
equivalent to the Davis Formation (Figure 5). The Davis thins gradationally<br />
into the Potosi Dolomite in southern Indiana (Shaver and<br />
others, 1986). The overlying Trempealeau Formation in Michigan<br />
(less than 100 to 900 feet thick) is also equivalent to the Potosi Dolomite<br />
(20 to 2,000 feet thick). Eastward, the Potosi is equivalent to<br />
the Copper Ridge Dolomite (700 to 1,200 feet thick) in Ohio, Kentucky,<br />
and western West Virginia, and the Conococheague Group/<br />
Limestone (2,500 feet thick) in eastern West Virginia, Pennsylvania,<br />
and Maryland. The Gatesburg Formation (1,000 to 1,350 feet thick)
60 CHARACTERIZATION OF GEOLOGIC SEQUESTRATION OPPORTUNITIES IN THE <strong>MRCSP</strong> REGION<br />
of western and central Pennsylvania is partly equivalent to the Copper<br />
Ridge part of the Knox Group to the west (Figure 5).<br />
ORIGIN OF NAMES, TYPE SECTION, SIGNIFICANT<br />
EARLIER STUDIES ON THIS INTERVAL<br />
Many of the stratigraphic names applied to this interval in the<br />
<strong>MRCSP</strong> study area were originally defined for units exposed at the<br />
surface outside of the region or in the Appalachian fold and thrust<br />
belts where these units come to the surface. For ease of presentation,<br />
the units are arranged alphabetically, followed by the reference for<br />
the original description, and the type locality.<br />
Conococheague Group (Limestone)—Stose (1908) for outcrops in<br />
Scotland, Pennsylvania.<br />
Conasauga Group (Shale, Dolomite, Limestone, or Formation)—<br />
Hayes and others (1891) for outcrops in a valley in northwestern<br />
Georgia.<br />
Copper Ridge Dolomite (Member)—Butts (1940) for outcrops near<br />
Thorn Hill, Tennessee<br />
Davis Formation—Bueler (1907) for outcrops on Davis Creek in St.<br />
Francois County, Missouri<br />
Eau Claire Formation—Wolcott (1914) for outcrops near Eau<br />
Claire, Wisconsin<br />
Elbrook Formation (Limestone or Dolomite)—Stose (1906) for a<br />
quarry in Franklin County, Pennsylvania<br />
Franconia Formation—Berkey (1897) for outcrops in Franconia,<br />
Chicago County, Minnesota<br />
Galesville Sandstone—Trowbridge and Atwater (1934) for outcrops<br />
in Trempealeau County, Wisconsin<br />
Gatesburg Formation—Butts (1918) for outcrops in Centre County,<br />
Pennsylvania<br />
Ironton Sandstone (Member)—Thwaites (1923) for outcrops near<br />
Ironton, Sauk County, Wisconsin<br />
Knox Group (Supergroup, Formation, or Dolomite)—Safford<br />
(1869) for outcrops in Knox County, Tennessee<br />
Maryville Limestone—Keith (1895) for outcrops in Blount County,<br />
Tennessee<br />
Maynardsville Limestone—Oder (1934) for outcrops in Union<br />
County, Tennessee<br />
Munising Group—Lane and Seaman (1907) for bluffs exposed in<br />
Munising, Michigan<br />
Nolichucky Shale—Keith (1896) for outcrops in Greene County,<br />
Tennessee<br />
Pleasant Hill Formation (Limestone)—Butts (1918) for outcrops in<br />
Blount County, Pennsylvania<br />
Potosi Dolomite—Winslow (1894) for outcrops near Potosi, Missouri<br />
Pumpkin Valley Shale—Rodgers and Kent (1948) for outcrops in<br />
Hawkins County, Tennessee<br />
Rogersville Shale—Campbell (1894) for outcrops in Hawkins<br />
County, Tennessee<br />
Rome Formation—Smith (1890) for outcrops in Rome, Georgia<br />
Rutledge Limestone (Dolomite)—Keith (1896) for outcrops in<br />
Grainger County, Tennessee<br />
Shady Dolomite—Keith (1903) for outcrops in Johnson County,<br />
Tennessee<br />
Tomstown Dolomite—Stose (1906) for outcrops in Franklin County,<br />
Pennsylvania<br />
Trempealeau Formation—proposed by E.O. Ulrich in Thwaites<br />
(1923) for outcrops in bluffs of the Mississippi River in Trempealeau<br />
County, Wisconsin<br />
Warrior Formation (Limestone)—Butts (1918) for exposures along<br />
Warrior Run in Blair County, and Warrior Creek in Huntingdon<br />
County, Pennsylvania<br />
Waynesboro Formation—Stose (1906) for outcrops in Franklin<br />
County, Pennsylvania<br />
For more information concerning the history of stratigraphic<br />
nomenclature in this interval, and the correlation of rock units in<br />
statewide to semi-regional contexts, see Cohee, 1948; Fettke, 1948;<br />
Sloss and others, 1949, 1986; Freeman, 1953; McGuire and Howell,<br />
1963; Catacosinos, 1973; Janssens, 1973; Rickard, 1973; Calvert,<br />
1974; Wagner, 1976; Webb, 1980; Berg and others, 1986; Bricker<br />
and others, 1983; Patchen and others, 1985a; Rupp, 1991; Ryder,<br />
1991, 1992a; Riley and others, 1993; Ryder and others, 1995, 1996;<br />
Harris and Baranoski, 1996; Catacosinos and others, 2001; and Harris<br />
and others, 2004.<br />
NATURE OF LOWER AND UPPER CONTACTS<br />
In the western portion of the <strong>MRCSP</strong> study area, where the Eau<br />
Claire Formation is present (western Ohio, central Kentucky, Indiana,<br />
and Michigan), the lower contact of the Basal Sandstones<br />
to top of Copper Ridge Interval is gradational and conformable.<br />
In the eastern portion of the <strong>MRCSP</strong> study area, above the Rome<br />
trough, and in areas south of the Rome trough, the Shady/Tomstown<br />
Dolomite overlies an older basal sandstone, and the contact is also<br />
mostly conformable (e.g., Ryder and others, 1996). In some areas,<br />
there may be a more abrupt change from the underlying basal sandstones<br />
to carbonates, rather than sandstone to shale to carbonate. In<br />
the central-eastern portion of the <strong>MRCSP</strong> study area (eastern Ohio<br />
and southwestern Pennsylvania), the lower contact of this interval<br />
is variable, based on the available data. In many wells, the basal<br />
sandstone is absent, leaving the sandy dolomites of the Conasauga<br />
Group in direct contact with Precambrian basement. In other wells,<br />
there is a minimal thickness of the basal sand, which gradually becomes<br />
more dolomitic upwards towards the Conasauga Group. The<br />
stratigraphic relationships of these basal units is currently the focus<br />
of a separate study by the Ohio <strong>Geologic</strong>al Survey. In parts of Pennsylvania,<br />
northern West Virginia, and western Maryland, the basal<br />
sandstone is the Antietam, which is overlain by the Shady-Tomstown<br />
Dolomite. In these areas, the Antietam is gradational with a<br />
calcareous shale in the Shady-Tomstown, which is overlain by thinbedded<br />
carbonates (Brezinski, 1991). In northern Pennsylvania, the<br />
younger Potsdam Sandstone is the basal sandstone (Figure 5). In<br />
areas where the Potsdam Sandstone is the basal sand, it is conformably<br />
overlain by sandy limestones of the Warrior Formation. In at<br />
least one graben in northern Pennsylvania the Potsdam is overlain<br />
by argillaceous carbonates and/or sandstones at the base of the Warrior<br />
Formation (Ryder, 1992b).<br />
The upper contact of this interval (top of the Copper Ridge<br />
equivalents) is also variable across the <strong>MRCSP</strong> study area. In central<br />
and western Ohio, erosion on the regional Middle Ordovician<br />
Knox unconformity extends down into the Copper Ridge (Figure 5).<br />
Where this occurs, the Copper Ridge Dolomite is overlain unconformably<br />
by the Wells Creek Formation or, in some instances, the<br />
Black River Limestone. In the western Appalachian basin (eastern<br />
Ohio, northern Kentucky, western Pennsylvania, and western West<br />
Virginia), the upper contact of the Copper Ridge equivalents is<br />
defined at the base of the Rose Run Sandstone or the Upper Sandy<br />
member of the Gatesburg Formation (Figure 5). In southern Indiana,<br />
central Kentucky, and southwestern Ohio, the Rose Run is<br />
absent (see next interval for Rose Run distribution), and the Copper
APPENDIX A: BASAL SANDSTONES TO TOP OF COPPER RIDGE INTERVAL<br />
61<br />
Ridge is directly overlain by dolomites of the Knox Group (Beekmantown<br />
Dolomite), making the contact very difficult to discern.<br />
The contact is also nearly indistinguishable in western Maryland,<br />
central Pennsylvania, and eastern West Virginia where limestones<br />
of the Conococheague (a Copper Ridge equivalent) are directly<br />
overlain by limestones of the Beekmantown Group (Figure 5). In<br />
the Michigan basin (also northwesternmost Ohio, northern Indiana,<br />
and Michigan), the contact between the Potosi Dolomite/Trempealeau<br />
Formation (a Copper Ridge equivalent) and sandy dolomites in<br />
the overlying Prairie du Chien Group is gradational and difficult to<br />
differentiate.<br />
LITHOLOGY<br />
Tomstown/Rome/Waynesboro/lower Conasauga Formations—The<br />
Shady or Tomstown Dolomite is a relatively consistent unit of<br />
limestone, shale, and dolomite (Ryder and others, 1996; 1997). In<br />
Maryland and Pennsylvania, the Shady-Tomstown consists of a calcareous<br />
shale grading upward into thin-bedded limestone, overlain<br />
by thick- to medium-bedded, dark gray, coarse-grained dolostone,<br />
and overlain by massive dolostone, and interbedded limestone and<br />
dolostone (Brezinski, 1991). The Rome and Warrior Formations<br />
unconformably overlie the Shady-Tomstown across much of the<br />
eastern <strong>MRCSP</strong> study area (Ryder and others, 1996, 1997). Both<br />
the Rome and Warrior are laterally and vertically heterogeneous<br />
in this area. The Rome Formation contains a complex sequence of<br />
shales, siltstones, sandstones, and carbonates that is divided into<br />
three units, in ascending order (Ryder, 1992b; Harris and others,<br />
2004): 1) alternating thin shales and arkosic, very fine-grained to<br />
conglomeratic sandstones. Sandstones are most common toward the<br />
northern, fault-bounded margin of the trough as part of a thick, clastic<br />
wedge; 2) a more consistent, shale-dominated sequence; and 3)<br />
a 300-footthick carbonate-ramp sequence, which interdigitates and<br />
grows thinner above the clastic wedge along the northern margin of<br />
the trough (Ryder and others, 1997; Harris and others, 2004). East<br />
of the Rome trough, units above the Shady-Tomstown Dolomite are<br />
mapped as the Rome or Waynesboro Formation. The Waynesboro<br />
is differentiated from overlying and underlying units by the presence<br />
of red, dolomitic to anhydritic shales and can be divided in<br />
some areas into a lower red clastic interval (red to purple shale and<br />
sandstone), middle dolostone to impure limestone, and upper red<br />
shale (Ryder, 1991, 1992b; Kauffman, 1999). The Rome outside of<br />
the trough may also contains redbeds (Read, 1989a; Ryder, 1992b).<br />
In central and western Pennsylvania, the Waynesboro also contains<br />
coarse- to medium-grained sandstones (Kauffman, 1999). Above<br />
the Rome Formation, within the Rome trough, the Pumpkin Valley<br />
Shale is a gray shale and siltstone (Ryder, 1992b). The overlying<br />
Rutledge Limestone is dominated by micritic limestone with lesser<br />
amounts of sandy limestone and sandstone (Ryder, 1992b). The<br />
Rogersville Shale consists of silty red and green shales and micritic<br />
limestones, which grades north and westward into sandy shales of<br />
the Rome Formation (Ryder, 1992b; Ryder and others, 1996, 1997).<br />
The Maryville Limestone is a thick sequence of limestone and argillaceous<br />
limestone that interfingers to the south and east with the<br />
Elbrook/Honaker Dolomite. The Maryville may contain a 50- to<br />
300-foot thick sandy interval in its lower half within the trough<br />
(Ryder and others, 1997).<br />
Eau Claire/Conosauga/Elbrook/Warrior Formations—In the western<br />
portion of the <strong>MRCSP</strong> study area (eastern Indiana and Michigan),<br />
the Eau Claire Formation (lower part of the Munising Group)<br />
conformably overlies the basal sandstone. The Eau Claire consists<br />
of dark gray, red, and green shales; dolomitic, feldspathic, and<br />
partly glauconitic siltstone; very fine-grained to fine-grained,<br />
well-sorted sandstone (often feldspathic and lithic); silty to sandy<br />
dolostone; and oolitic limestone (Shaver and others, 1986; Catacosinos<br />
and Daniels, 1991). Shales dominate the lower part of the<br />
unit above the underlying Mt. Simon Sandstone, and siltstones and<br />
silty dolostones and limestones dominate in the upper, coarseningupward<br />
part of the unit beneath the Galesville Sandstone or Davis<br />
Formation (Becker and others, 1978). Pore systems in the Eau<br />
Claire are poorly developed and often filled with diagenetic feldspar,<br />
clay minerals, dolomite and/or quartz cement . The Eau Claire<br />
Formation intertongues eastward in central Ohio with dolostone and<br />
dolomitic and feldspathic sandstones of the Conasauga Group. Bedding<br />
within the Conasauga sandstones ranges from thin to medium<br />
to massive, to interbedded with laminated and wispy, dark-gray<br />
shale. Bioturbation (including filled vertical burrows), graded bedding,<br />
and crossbedding are common. Dolostone are arenaceous and<br />
ranges from light- to medium-gray and pinkish gray in color, and<br />
from cryptocrystalline to microcrystalline to medium crystalline<br />
in texture. Minor beds and laminae of gray to black shale, frosted<br />
quartz grains, vugs filled with selenite and dolomite crystals, ooids,<br />
pelloids, disseminated pyrite, laminae and thin beds of glauconite,<br />
apatite, flat pebble conglomerate, rip-up clasts, mudcracks, and<br />
clay-rich paleosols() are also present. Eastward toward the Rome<br />
trough, the Conasauga Group is composed of multiple formations.<br />
The lower part of the Conasauga in this area is restricted to the<br />
Rome trough. The upper formations extend beyond the trough,<br />
either pinching out laterally away from the trough or merging with<br />
unnamed units in the Conasauga Formation. The Nolichucky Shale<br />
is a calcareous, olive-green to gray, silty shale and siltstone (Elton<br />
and Haney, 1974). The overlying Maynardsville Limestone is a<br />
micritic to coarse-grained limestone, transitional between the Nolichucky<br />
and the overlying carbonates of the Copper Ridge (Webb,<br />
1980). The upper two thirds of the Maryville Limestone is equivalent<br />
to the Elbrook Formation or Dolomite farther east, beyond the<br />
southern and eastern limits of the Rome trough. The Elbrook consists<br />
of a lower limestone, a middle, oolitic dolostone, and in some<br />
areas, an upper sandy dolomitic limestone (Ryder, 1991; Ryder<br />
and others, 1992b, 1996, 1997). In Pennsylvania, the Pleasant Hill<br />
Limestone is a sandy limestone and calcareous shale grading upward<br />
into dark-gray limestone (Berg, 1981). The overlying Warrior<br />
Formation consists of oolitic limestone and silty to sandy dolostone<br />
(Ryder and others, 1992b; Kauffman, 1999). Where it is thick in the<br />
Rome trough of southwestern Pennsylvania, the Warrior may also<br />
include a thick sequence of dolomitic sandstone overlain by darkgray<br />
to black shale (Ryder, 1992a). In the subsurface of western<br />
Pennsylvania, the Pleasant Hill and Warrior limestones have been<br />
thoroughly dolomitized. This makes regional correlation difficult<br />
on the basis of drill cuttings or cores. However, the gamma-ray and<br />
density log signatures typically remain fairly constant despite the<br />
change in lithology, making correlation by geophysical logs the<br />
most preferred method.<br />
Upper Munising/Trempealeau/Potosi/Davis/Copper Ridge/Gatesburg/Conococheague<br />
Formations—In Michigan, the upper Munising<br />
Group consists of the Galesville Sandstone and Franconia<br />
Formation. The Galesville (previously Dresbach) consists of lightcolored,<br />
fine- to coarse-grained, dolomitic sandstones. The upper<br />
part of the unit is glauconitic (Catacosinos, 1973; Lilienthal, 1978)<br />
and the lower part of the unit contains well-sorted quartz arenites<br />
with thin interbeds of dolostone and green shale (Milstein, 1983).<br />
The Galesville grades upward into the Ironton Sandstone in northwestern<br />
Indiana with a similar distribution to the Galesville. The<br />
Ironton consists of sandy dolostone, white, medium- to coarse-
62 CHARACTERIZATION OF GEOLOGIC SEQUESTRATION OPPORTUNITIES IN THE <strong>MRCSP</strong> REGION<br />
grained sandstone, dolomitic sandstone, and dolostone (Becker and<br />
others, 1978). Where both sandstones occur, they cannot easily be<br />
distinguished from one another (Becker and others, 1978; Shaver<br />
and others, 1986). Both sandstones become increasingly dolomitic<br />
and thin to the south and east (Becker and others, 1978). The Franconia<br />
consists of glauconitic, pink to gray, fine- to medium-grained<br />
dolomitic sandstone, quartz arenites, dolostone, shaly dolostone,<br />
dolomitic siltstone, and interbedded shales (Milstein, 1983; Shaver<br />
and others, 1986). Like the Eau Claire, the Franconia is feldspathic<br />
(Galarowicz, 1997). The Franconia has a similar thickness distribution<br />
to the underlying Galesville and Ironton Sandstones. Also, like<br />
those units, it becomes more dolomitic and thinner eastward and<br />
southward, where it grades into the upper part of the Davis Formation,<br />
or into the lower part of the Potosi Dolomite (Becker and others,<br />
1978; Shaver and others, 1986). The Davis Formation is composed<br />
of siltstone, shale, limestone, and dolostone that conformably<br />
overlie the Eau Claire Formation in eastern and southern Indiana<br />
(Becker and others, 1978; Shaver and others, 1986). The Upper<br />
Munising/Davis units are overlain by the Trempealeau Formation<br />
and the laterally equivalent Potosi Dolomite in the western <strong>MRCSP</strong><br />
study area. In Michigan, the Trempealeau is a buff to light brown<br />
dolostone, locally sandy and containing chert, with minor amounts<br />
of dolomitic shale and shaly dolostone. The Trempealeau contains<br />
a large amount of glauconite and minor amounts of anhydrite<br />
(Lilienthal, 1978; Milstein, 1983). Similarly, the equivalent Potosi<br />
Dolomite in Indiana is a pale gray to tan, dense, micritic to mediumgrained<br />
dolostone with interbeds of shale and siltstone. The lower<br />
and upper parts of the Potosi may be glauconitic (Shaver and others,<br />
1986). Eastward, the Potosi/Trempealeau interval is equivalent to<br />
the Copper Ridge Dolomite (Knox Group). The Copper Ridge is a<br />
thick interval of sandy dolostone with interbeds of sandstone and<br />
dark gray, argillaceous limestone in the eastern part of the <strong>MRCSP</strong><br />
study area (Ryder and others, 1996, 1997). Dolostones of the Copper<br />
Ridge in parts of northern Kentucky, eastern Indiana, and Ohio<br />
range from dense to vuggy. Vuggy dolostones may occur throughout<br />
an interval of at least 400 feet in this area (Shrake and others,<br />
1990). Farther eastward, in eastern West Virginia, Pennsylvania, and<br />
Maryland, the upper carbonate interval is equivalent to the Conococheague<br />
Group/Limestone and part of the Gatesburg Formation.<br />
The Conococheague is a thick carbonate-dominated sequence that is<br />
divided into several formations in Pennsylvania (Kauffman, 1999).<br />
The Conococheague contains sandy dolostone, which may be argillaceous<br />
and contain local layers of dolomitic, quartzose sandstones<br />
near the base of the unit; limestones with chert; and thin interbeds<br />
of limestone and dolostone (Kauffman, 1999). Cycles of intra-formational<br />
conglomerates, cross bedded grainstones, alternating thinbedded<br />
limestone and dolostone (called “ribbon rock”), and planar<br />
laminated to mud-cracked dolostone are documented in Virginia,<br />
where this unit is exposed (Demicco, 1983, 1985). The part of the<br />
Gatesburg Formation beneath the Rose Run-equivalent in Pennsylvania<br />
is a dolostone similar to the Copper Ridge, which tends to be<br />
sandy toward the base (Ryder, 1991, 1992b)<br />
DISCUSSION OF DEPTH AND THICKNESS RANGES<br />
The Basal Sandstone to top of Copper Ridge Interval ranges in<br />
thickness from slightly more than 1,100 feet in the western portion<br />
of the <strong>MRCSP</strong> study area to more than 9,000 feet in the Rome<br />
trough in West Virginia (Figure A3-1). Isopachs are not projected<br />
beyond the trough into southern West Virginia because there are<br />
no wells deep enough in this area to penetrate the interval. However,<br />
those wells in southeastern Kentucky, southwest Virginia (just<br />
outside of the <strong>MRCSP</strong> study area), and northern West Virginia that<br />
reach basement indicate that there is substantial thinning of the interval<br />
south and east of the trough-bounding faults so that thinning<br />
is expected in southern West Virginia. Most of the thickness variation<br />
within the trough occurs within the Rome Formation and lower<br />
part of the Conasauga Group (Ryder and others, 1996, 1997; Harris<br />
and others, 2004).<br />
The Basal Sandstone to top of Copper Ridge Interval also thickens<br />
into the Michigan basin (Figure A3-1). Thickening of the Franconia<br />
and Trempealeau formations into central Michigan indicates that the<br />
proto-Michigan basin continued to develop at this time (Catacosinos<br />
and Daniels, 1991). Subsidence occurred at a much slower rate than<br />
during the deposition of the basal sandstone. The proto-Appalachian<br />
basin also developed during this time, as indicated by southeastward<br />
thickening of units east of the Rome trough.<br />
The shallowest depth at which the top of the Basal Sandstone to<br />
top of Copper Ridge Interval occurs is across the Cincinnati arch<br />
(in some cases less than 500 feet) (Figure A3-2). In the center of the<br />
Michigan basin, the top of this interval may be deeper than 10,000<br />
feet, and in the Appalachian basin, the depth exceeds 20,000 feet.<br />
DEPOSITIONAL ENVIRONMENTS/<br />
PALEOGEOGRAPHY/TECTONISM<br />
During deposition of the Basal Sandstone to top of Copper Ridge<br />
Interval, a shallow epicontinental sea covered the <strong>MRCSP</strong> study<br />
area. Subsidence above the Rome trough and lesser subsidence in<br />
the proto-Michigan and Appalachian basins influenced depositional<br />
facies, as did sea-level fluctuations. The pervasive dolomitization<br />
of the upper part of this interval (Copper Ridge equivalents)<br />
throughout the North American continent continues to be enigmatic,<br />
although it may be related to the expulsion and migration of fluids<br />
from the Ordovician Sevier or late Paleozoic Alleghanian orogenies<br />
(Glumac and Walker, 2002; Montanez, 1994).<br />
Tomstown/Rome/Waynesboro/lower Conasauga Formations—The<br />
Shady-Tomstown Dolomite was deposited as a carbonate ramp<br />
along the Cambro-Ordovician passive margin of the craton (Read,<br />
1989a, 1989b). Because the thickness of the dolostone does not<br />
change substantially across the southern bounding faults of the<br />
Rome trough, it is presumed to represent pre-rift deposition (Harris<br />
and others, 2004). The great thickness of the Rome Formation<br />
within the trough document growth during rifting (Harris and<br />
others, 2004). Evidence suggests that sediments were transported<br />
into the trough from the north. The deeper parts of the trough were<br />
occupied by a distal clastic shelf or ramp. Along the northwest<br />
margin of the trough, delta front and shallow marine shelf deposits<br />
dominated a shallower structural platform , with sand supplied by<br />
fluvial systems to the north. Presumably, the areas north and west<br />
of the trough at this time were dominated by nondeposition or erosion<br />
on the Precambrian surface. Age correlations for this interval<br />
are hampered by a lack of cores with usable biostratigraphic data.<br />
During the time of deposition of the upper Rome Formation, the<br />
deeper Rome trough was occupied by a carbonate ramp. A deeper<br />
water, intra-shelf basin is interpreted in south-central Kentucky,<br />
based on the few wells drilled there (Harris and others, 2004).<br />
Lateral facies of the lower Conasauga Formation may represent<br />
downslope facies equivalents of Rome clastic wedges building off<br />
the northern trough margin into deeper water (Ryder, 1992b; Ryder<br />
and others, 1996, 1997). Thickening of these units into the trough<br />
indicates continued (but lessened) growth faulting. Outside of the<br />
Rome trough, in southern West Virginia, anhydrites and redbeds<br />
in the Rome and Waynesboro Formations may indicate upper tidal
APPENDIX A: BASAL SANDSTONES TO TOP OF COPPER RIDGE INTERVAL<br />
63<br />
EXPLANATION<br />
1000<br />
Faults<br />
1000<br />
Structural Front Line<br />
1000 ft contours<br />
Thickness in feet<br />
2000<br />
High : 9000<br />
1000<br />
Low : 1000<br />
1000<br />
1000<br />
R O<br />
N T L I N E<br />
F<br />
3000<br />
2000<br />
U R<br />
A L<br />
P R O J E C<br />
4000<br />
S T R U C T<br />
T L<br />
9000<br />
7000<br />
I M I<br />
5000<br />
T<br />
3000<br />
50 25 0 50 100 Miles<br />
³<br />
50 25 0 50 100 150 Kilometers<br />
Figure A3-1.—Map showing the thickness of the interval from the top of the Cambrian basal sandstones to the top of the Copper Ridge Dolomite.
64 CHARACTERIZATION OF GEOLOGIC SEQUESTRATION OPPORTUNITIES IN THE <strong>MRCSP</strong> REGION<br />
EXPLANATION<br />
-4000<br />
Faults<br />
-5000<br />
-6000<br />
Structural Front Line<br />
-8000<br />
5000 ft Index contours<br />
1000 ft contours<br />
-10000<br />
Mean sea elevation (feet)<br />
-1000<br />
-15000<br />
-4000<br />
-2000<br />
-1000<br />
-2000<br />
-4000<br />
-6000<br />
-8000<br />
-10000<br />
-12000<br />
A L<br />
F<br />
R O<br />
N T L I N E<br />
-1000<br />
U R<br />
P R O J E C<br />
T L<br />
S T R U C T<br />
-10000<br />
-12000<br />
I M I<br />
T<br />
-5000<br />
-6000<br />
-7000<br />
-10000<br />
-12000<br />
-14000<br />
-3000<br />
-4000<br />
50 25 0 50 100 Miles<br />
³<br />
50 25 0 50 100 150 Kilometers<br />
Figure A3-2.—Structure map drawn on the top of the Copper Ridge Dolomite.
APPENDIX A: UPPER CAMBRIAN ROSE RUN SANDSTONE<br />
65<br />
flat to sabkha conditions. The carbonate bank represented by these<br />
formations dipped seaward toward southeastern Virginia (southeast<br />
of the <strong>MRCSP</strong> study area) where these units are dominated by peritidal<br />
carbonates (Haynes, 1991).<br />
Eau Claire/Conosauga/Elbrook/Warrior Formations—Marine conditions<br />
continued in the units capping the trough fill. The marine<br />
shales of the Eau Claire Formation in the western part of the <strong>MRCSP</strong><br />
study area represent the continuation of the Mt. Simon transgression<br />
(Driese and others, 1981). It bears repeating that this transgressive<br />
sequence is different from the transgressive sequence that includes<br />
the basal sands in the Rome trough and the basal sands east of the<br />
Rome trough. The Eau Claire and lateral units represent deposition<br />
following filling of the Rome trough. Across the <strong>MRCSP</strong> study area,<br />
there is a west to east transition in this sub-interval from shallow<br />
marine siliciclastics of the Eau Claire Formation; to mixed carbonates<br />
and clastics deposited in intra-shelf settings in the Conasauga;<br />
to peritidal carbonates of the Elbrook and Pleasant Hill Formations<br />
(Read, 1989a, 1989b). The latter carbonates are part of the persistent<br />
carbonate bank that existed on the eastern, passive margin of the<br />
craton during Cambrian and Early Ordovician time.<br />
Upper Munising/Trempealeau/Potosi/Davis/Copper Ridge/Gatesburg/Conococheague<br />
Formations—During this sub-interval, a<br />
regression caused progradation of peritidal carbonates across the<br />
entire <strong>MRCSP</strong> study area (Read, 1989a and 1989b). This regression<br />
may have been related to the cessation of extensional tectonics on<br />
the passive margin, and marks the Sauk II/Sauk III boundary (Glumac<br />
and Walker, 2000). The Copper Ridge and its equivalents were<br />
deposited in a variety of peritidal environments. To the east, the<br />
Conococheague was deposited as platform carbonates transitional<br />
to deeper basinal facies to the south and east (Demicco, 1985). Shallowing-upward<br />
cycles within the Conococheague record repeated<br />
facies successions from storm to subtidal algal reef to subtidal shoal<br />
to intertidal flat and, ultimately, to sabkha (Demicco, 1983). Sandstones<br />
in the lower part of the Concococheague and lateral equivalents<br />
may be related to detrital influx following the Sauk II/Sauk<br />
III sea-level fall (Marchefka and Glumac, 2002). More widespread<br />
sandstones in Michigan and parts of Indiana (Galesville and Ironton)<br />
were deposited as shallow marine shelf sands, which preceded<br />
the accumulation of peritidal carbonates in the Trempealeau Formation<br />
(Catacosinos and Daniels, 1991).<br />
SUITABILITY AS A CO 2<br />
INJECTION TARGET OR SEAL UNIT<br />
Given the variability in the geology across the region, it is not<br />
surprising that the mineralogy of lithologies within the Basal Sandstone<br />
to top of Copper Ridge Interval in the <strong>MRCSP</strong> study area is<br />
quite variable. Much of the sandstone in the interval is composed of<br />
reworked, multicycle quartz similar to the underlying mineralogy of<br />
the basal sandstone. There are also significant amounts of detrital<br />
and diagenetic feldspars, as well as a variety of detrital and authigenic<br />
clay minerals present in some units. Additionally, there are<br />
numerous portions of the section that contain significant amounts<br />
of glauconite. The varied mineralogy complicates analyses of the<br />
interval because geophysical log responses are, in many cases, not<br />
representative of the actual porosity of the rocks. Microporosity<br />
in shales, and the complex mixing of carbonate and siliciclastic<br />
lithologies, complicate geophysical log responses in some areas and<br />
in some parts of the interval. These minerals make the assessment<br />
of porosity and, especially, permeability problematic. Core analyses<br />
from this interval on the Ohio platform indicate low permeability in<br />
the interbedded clastics and carbonates -, suggesting good to excellent<br />
reservoir seal/confining characteristics.<br />
Although the overall interval is mapped as a seal, there are units<br />
within the interval (especially in the east) that are possibilities for<br />
sequestration. These units themselves are confined by thick sections<br />
of shales or carbonates that would act as a seal. In northeastern<br />
Ohio, where limited porosity and permeability have been encountered,<br />
injection wells have been completed in the sandstones of the<br />
Conasauga Group. However, total cumulative injection volumes for<br />
these units are low when compared to Mt. Simon injection sites. In<br />
addition, multiple stratigraphic units had to be utilized at these sites<br />
to obtain the necessary injectivity.<br />
Geophysical log responses of a few well-developed dolomitic<br />
sandstone units within the Conasauga Group of eastern Ohio suggest<br />
potentially good to excellent injection reservoirs. Site-specific<br />
evaluation, coring, and core analysis would be necessary before using<br />
these sandstones as an injection target. These are possible targets<br />
for <strong>Phase</strong> II studies.<br />
Another potential sequestration target would be sandstones in<br />
the Rome Formation. These arkosic, marine sandstones may be as<br />
much as 500 feet thick (averaging approximately 250 feet). Limited<br />
oil and gas well drilling has encountered permeabilities as high as<br />
177 md, with an average of 62 md, and with mean porosities of 12<br />
percent (Harris and others, 2004). Because these are not regionally<br />
extensive units, they were not a focus of <strong>Phase</strong> I research, but they<br />
could be examined as part of the continuing geologic characterization<br />
in <strong>Phase</strong> II. Opportunities for structural closure exist within the<br />
fault-bound Rome trough, although reservoir heterogeneity may<br />
be common (Harris and Baranoski, 1996). The overlying shales<br />
of the Conasauga Group would form the seal on these potential<br />
reservoirs.<br />
Thick zones of vugular porosity have also been encountered in<br />
a number of scattered wells within the Copper Ridge Dolomite.<br />
Vuggy dolostones were used at the DuPont WAD Fee well in Louisville,<br />
Kentucky (just west of the <strong>MRCSP</strong> study area) for the disposal<br />
of industrial waste fluids, after a well in the Mt. Simon Sandstone<br />
encountered “tight” sandstones at that horizon. The interval of<br />
vuggy dolostone is sealed above by dense dolostones of the Copper<br />
Ridge. Coring of the potential reservoir and seal units within the<br />
Copper Ridge would be required to further evaluate their sequestration<br />
potential in this and other parts of the <strong>MRCSP</strong> study area.<br />
Where this unit is deep enough to keep the CO 2 in miscible form,<br />
analysis appears warranted for use as an injection target, especially<br />
as a backup or secondary target for deeper Mt. Simon wells. These<br />
are also potential targets for <strong>Phase</strong> II studies.<br />
4. UPPER CAMBRIAN ROSE RUN SANDSTONE<br />
In Ohio and eastern Kentucky, the Cambrian-Ordovician Knox interval<br />
is subdivided, in ascending stratigraphic order, into the Copper<br />
Ridge Dolomite, Rose Run sandstone, and Beekmantown Dolomite.<br />
The Cambrian Rose Run sandstone is the only laterally persistent sandstone<br />
within the Knox Dolomite. This sandstone interval can be correlated<br />
in the subsurface from eastern Ohio, where it subcrops beneath<br />
the Knox unconformity (Figure A4-1), to eastern Kentucky, into western<br />
West Virginia (upper sandstone member of the Knox), Pennsylvania<br />
(Upper Sandy member of the Gatesburg Formation) (Figure 5), and<br />
extends into New York (partial equivalent of the Theresa Formation).
66 CHARACTERIZATION OF GEOLOGIC SEQUESTRATION OPPORTUNITIES IN THE <strong>MRCSP</strong> REGION<br />
EXPLANATION<br />
Rose Run Subcrop<br />
Extent of Erosional Remnants<br />
Extent of RR Mapping<br />
25 12.5 0 25 50 Miles<br />
25 12.5 0 25 50 75 Kilometers<br />
³<br />
Figure A4-1.—Subcrop and extent map of the Rose Run sandstone.
APPENDIX A: UPPER CAMBRIAN ROSE RUN SANDSTONE<br />
67<br />
ORIGIN OF NAMES, TYPE SECTION, SIGNIFICANT<br />
EARLIER STUDIES ON THIS INTERVAL<br />
The Rose Run sandstone was first described and named by Freeman<br />
(1949) from the Judy and Young #1 Rose Run Iron Co. well<br />
in Bath County, Kentucky where about 70 feet of poorly sorted<br />
sandstone was encountered approximately 300 feet below the Knox<br />
unconformity. Butts (1918) initially named the Upper Sandy member<br />
of the Gatesburg Formation (Rose Run equivalent) from outcrop<br />
studies in central Pennsylvania. Wagner (1961, 1966a,b,c, 1976)<br />
conducted subsurface studies of Cambrian-Ordovician stratigraphy<br />
of western Pennsylvania and bordering states and attempted to establish<br />
a workable nomenclature for this interval. He adopted the<br />
central Pennsylvania nomenclature of Kay (1944), Wilson (1952),<br />
and others for the majority of rocks in western Pennsylvania. In this<br />
classification scheme, the Gatesburg Formation in western Pennsylvania<br />
is subdivided, in ascending stratigraphic order, into the Lower<br />
Sandy member, the Ore Hill member, and the Upper Sandy member<br />
(see Figure 5).<br />
Janssens (1973), in a detailed stratigraphic study of the Cambrian-Ordovician<br />
rocks in Ohio, extended the use of the term Rose<br />
Run from the subsurface of Kentucky into Ohio, but did not attempt<br />
to name it as a formal unit. He recognized the Copper Ridge, Rose<br />
Run, and Beekmantown as informal units of the Knox Dolomite.<br />
More recently, Riley and others (1993) performed a detailed investigation<br />
of the Rose Run in Ohio and Pennsylvania. They recognized<br />
the Copper Ridge, Rose Run, and Beekmantown as mappable,<br />
correlable units in the subsurface based on cores, cuttings, and<br />
geophysical logs, and suggested that these units be recognized as<br />
formal units in Ohio.<br />
Regional subsurface correlations of the Cambrian-Ordovician<br />
interval across the Appalachian basin have been published that<br />
illustrate the lateral extent of the Rose Run and equivalent units<br />
(Ryder, 1991; 1992a,b; Ryder and others, 1992, 1996). A more detailed<br />
review of nomenclature, and previous work on the Rose Run<br />
and equivalent units, can be found in Riley and others (1993) and<br />
Baranoski and others (1996).<br />
NATURE OF LOWER AND UPPER CONTACTS<br />
The Rose Run sandstone directly overlies the Copper Ridge Dolomite<br />
or equivalent throughout the mapped area (Figure 5). The<br />
base of the unit is typically a gradational contact with the underlying<br />
Copper Ridge Dolomite and is difficult to correlate consistently<br />
across the basin using geophysical logs. In Ohio, the Rose Run interval,<br />
as recognized in core and geophysical logs, consists of a stacked<br />
sequence of as many as five sandstone units interbedded with thin,<br />
low-permeability dolostone and carbonaceous shale (Baranoski and<br />
others, 1996; Riley and others, 2002). The basal sandstone unit of<br />
the Rose Run interval is typically separated from the main sandstone<br />
body by a dolostone lens approximately 30 feet thick (Figure A4-<br />
2). The contact with the underlying Copper Ridge is placed at the<br />
base of this lowermost sandstone unit. This lowermost sandstone<br />
is less developed in southern Ohio and Kentucky. In Kentucky, the<br />
lowermost sandstone unit of the Rose Run in Ohio is either poorly<br />
developed or absent. Thus, the Rose Run-Copper Ridge contact is<br />
identified at the base of the main (i.e., well-developed) sandstone<br />
interval there, which is stratigraphically higher in the section than in<br />
central Ohio. Therefore, the thickness of the Rose Run, as mapped<br />
in Kentucky, is less than that mapped in Ohio (Figure A4-3). The<br />
base of the Rose Run or equivalent in West Virginia and Pennsylvania<br />
is also difficult to identify consistently on geophysical logs<br />
because of the heterogeneity of the interval, but is typically placed<br />
at the base of the lowermost sandstone unit as in Ohio.<br />
The Rose Run sandstone conformably underlies a dolostone interval<br />
called the Beekmantown Formation in Ohio and eastern Kentucky<br />
(equivalent to the Mines Member of the Gatesburg Formation<br />
in central Pennsylvania), except within the Rose Run subcrop trend,<br />
where the Beekmantown is absent because of erosion on the Knox<br />
unconformity. Where the Beekmantown is eroded, either the Wells<br />
Creek Formation or Black River Group directly overlies the Rose<br />
Run. In areas with Beekmantown dolostone, the contact is gradational<br />
and the top of the Rose Run is placed at the top of the first<br />
well-developed, porous, sandstone unit underlying a low-permeability,<br />
nonporous dolostone (Riley and others, 1993; Baranoski and<br />
others, 1996; Riley and others, 2002). Within the Rose Run subcrop<br />
trend, the top of the Rose Run sandstone is a sharp, unconformable<br />
contact, and is placed at the top of porous, permeable sandstone<br />
that is overlain by impermeable interbedded shale and dolostone of<br />
the Wells Creek, or by impermeable, nonporous, dolostone of the<br />
Black River.<br />
LITHOLOGY<br />
The Rose Run interval, as described in subsurface core in Ohio,<br />
consists of white to light gray, fine-to medium-grained, sub- to<br />
well-rounded, moderately sorted, quartz arenites to subarkoses<br />
interbedded with thin lenses of nonporous dolostone (Riley and<br />
others, 1993; Baranoski and others, 1996). Glauconite and green<br />
shale laminae occur locally. Low-angle cross bedding is the most<br />
common sedimentary structure observed in both core and formation<br />
micro-imager (FMI) logs. Ripple marks have also been noted<br />
in both core and FMI logs. Polygonal mud cracks are present in<br />
several of the cores, indicating subaerial exposure of the sandstones<br />
during low stands in sea level.<br />
In core and outcrop in Pennsylvania, the Rose Run equivalent, the<br />
Upper Sandy member of the Gatesburg Formation, contains three<br />
principal facies: 1) sandstone; 2) mixed sandstone and dolostone;<br />
and 3) dolostone (Riley and others, 1993). The sandstone facies consist<br />
of light-gray, fine-grained, well-sorted quartz arenites. The principal<br />
cement is silica. Cross bedding is present, including herringbone<br />
cross-stratification. The mixed sandstone and dolostone facies<br />
is dominated by sandstone that consists of fine- to medium-grained,<br />
moderately well sorted quartz arenites. The principal cement is dolomite.<br />
The dolostone facies are light-gray to olive-gray and display<br />
nodular bedding and bioturbation. Outcrops in central Pennsylvania<br />
contain “ribbon rocks” (thin-bedded, wave-rippled and burrowed<br />
dolostone), wavy dololaminite, flat pebble conglomerates, and<br />
thrombolitic algal mounds in the dolostone facies (Riley and others,<br />
1993). Ooid grainstones are common within the dolostone facies.<br />
From a regional study of cores and outcrops in Ohio and Pennsylvania<br />
(Riley and others, 1993), monocrystalline quartz and potassium<br />
feldspar are the dominant framework constituents in the Rose<br />
Run. Polycrystalline quartz and chert generally comprise less than<br />
one percent of the sandstone and appear in the more feldspathic<br />
samples. Minor amounts (less than one percent) of muscovite and<br />
accessory minerals—zircon, tourmaline, garnet, and pyrite—occur<br />
locally. Allochems are locally abundant in the Rose Run and include<br />
dolostone clasts, glauconite, peloid and dolomitized ooids. Four<br />
major cementing agents occurring in the Rose Run include: 1) dolomite;<br />
2) clays; 3) quartz overgrowths; and 4) feldspar overgrowths<br />
(Riley and others, 1993). Dolomite is the dominant cementing agent<br />
as observed in cores throughout Ohio and Pennsylvania. Five pore<br />
textures were observed in the Rose Run, including: 1) intergranular
68 CHARACTERIZATION OF GEOLOGIC SEQUESTRATION OPPORTUNITIES IN THE <strong>MRCSP</strong> REGION<br />
<br />
<br />
<br />
<br />
<br />
<br />
<br />
<br />
<br />
<br />
<br />
<br />
<br />
<br />
<br />
<br />
<br />
<br />
<br />
<br />
<br />
<br />
<br />
<br />
<br />
<br />
<br />
<br />
<br />
<br />
<br />
<br />
<br />
<br />
<br />
<br />
<br />
<br />
<br />
<br />
<br />
<br />
<br />
<br />
<br />
<br />
<br />
<br />
<br />
<br />
<br />
<br />
<br />
<br />
<br />
<br />
<br />
<br />
<br />
<br />
<br />
<br />
<br />
<br />
Figure A4-2.—Figure showing difference in interpretation of the Rose Run sandstone between Ohio and Kentucky based on geophysical log picks. The basal<br />
sand unit of the Rose Run sequence as mapped in Ohio and Pennsylvania, is not present, or poorly developed, in Kentucky. Therefore, the Kentucky thickness<br />
map cannot be merged with the Ohio thickness map as can be seen on Figure A4-3.<br />
pores; 2) oversized pores; 3) moldic pores; 4) intraconstituent pores;<br />
and 5) fractures (Riley and others, 1993). Intergranular porosity is<br />
the most abundant porosity type in the Rose Run and appears to be<br />
mostly secondary based on corroded grain boundaries. Oversized<br />
pores are caused primarily by dissolution of dolomite and feldspar.<br />
Moldic pores occur in the more feldspathic samples and have the<br />
highest porosities and permeabilities. Intraconstituent pores occur<br />
most commonly in feldspar grains and appear to be more common<br />
toward the lower portion of the Rose Run. Fracture porosity is the<br />
least common porosity type observed in cores, but it may be locally<br />
significant in areas adjacent to major fault systems.<br />
DISCUSSION OF DEPTH AND THICKNESS RANGES<br />
Regional structure on the top of the Rose Run sandstone exhibits<br />
dip to the east and southeast with strike trending northeast-southwest<br />
(Figure A4-4). Subsea elevations range from 390 feet in northcentral<br />
Kentucky to 18,900 feet in south-central Pennsylvania. Dips
APPENDIX A: UPPER CAMBRIAN ROSE RUN SANDSTONE<br />
69<br />
EXPLANATION<br />
Faults<br />
Cropline<br />
100 ft Index contours<br />
25 ft contours<br />
Kentucky<br />
100 ft Index contours<br />
20 ft contours<br />
Thickness in feet<br />
600<br />
T M L<br />
A S S F<br />
20<br />
c r<br />
o p<br />
H<br />
F<br />
300<br />
400<br />
P W L<br />
b<br />
S<br />
u<br />
500<br />
200<br />
300<br />
400<br />
500<br />
500<br />
PROJECT LIMIT<br />
100<br />
100<br />
100<br />
I N<br />
100<br />
S U<br />
F F I<br />
C I E N<br />
T D A T A<br />
50 25 0 50 100 Miles<br />
³<br />
50 25 0 50 100 150 Kilometers<br />
Figure A4-3.—Map showing the thickness of the Rose Run sandstone. See Figure A4-2 for explanation of thickness differences between Ohio and Kentucky.<br />
The letters refer to the followig features: ASSF = Akron-Suffield-Smith Fault systems; HF = Highlandtown Fault system; PWL = Pittsburgh-Washington Lineament;<br />
TML = Tyrone-Mount Union Lineament.
70 CHARACTERIZATION OF GEOLOGIC SEQUESTRATION OPPORTUNITIES IN THE <strong>MRCSP</strong> REGION<br />
EXPLANATION<br />
faults<br />
Subcrop<br />
1000 ft Index contour<br />
250 ft contours<br />
Mean sea elevation (feet)<br />
-500<br />
-6000<br />
-18000<br />
S<br />
u<br />
b<br />
c r<br />
o p<br />
A S S F<br />
H<br />
F<br />
P W L<br />
T M L<br />
-13000<br />
-15000<br />
-16000<br />
-16000<br />
-17000<br />
-2000<br />
-4000<br />
-6000<br />
-8000<br />
-11000<br />
-13000<br />
D A T A<br />
PROJECT LIMIT<br />
-2000<br />
-4000<br />
-6000<br />
-7000<br />
I N<br />
S U<br />
F F I<br />
C I E N T<br />
50 25 0 50 100 Miles<br />
³<br />
50 25 0 50 100 150 Kilometers<br />
Figure A4-4.—Structure contour map drawn on the top of the Rose Run sandstone. The letters refer to the followig features: ASSF = Akron-Suffield-Smith<br />
Fault systems; HF = Highlandtown Fault system; PWL = Pittsburgh-Washington Lineament; TML = Tyrone-Mount Union Lineament.
APPENDIX A: UPPER CAMBRIAN ROSE RUN SANDSTONE<br />
71<br />
range from approximately 50 feet per mile in northeastern Ohio and<br />
northwestern Pennsylvania to approximately 100 feet per mile in<br />
southeastern Ohio, and western West Virginia.<br />
The major tectonic features affecting Rose Run structure occur<br />
in northeastern Ohio, western Pennsylvania, eastern Kentucky, and<br />
western West Virginia. In western Pennsylvania, these include the<br />
Tyrone-Mt. Union and Pittsburgh-Washington lineaments, which<br />
have been interpreted as northwest-southeast trending wrench<br />
faults (Riley and others, 1993). In addition, numerous growth faults<br />
above basement rifts have been proposed that have been offset by<br />
movement along these major wrench faults (Laughrey and Harper,<br />
1986; Harper, 1989; Riley and others, 1993). In northeastern Ohio,<br />
the major tectonic features indicated by regional mapping are the<br />
northwest-southeast trending Akron-Suffield-Smith and the Highlandtown<br />
fault systems, which also have been suggested to be<br />
wrench faults (Riley and others, 1993). These are extensions of the<br />
Pittsburgh-Washington lineament in Pennsylvania. In eastern Kentucky<br />
and western West Virginia, the Rose Run structure is broken<br />
by the east- to northeast-trending Rome trough. Locally, small-scale<br />
features are present that are not evident on the regional-scale maps.<br />
A relationship between basement faults and paleotopographic highs<br />
on the Knox or Rose Run has been proposed as a controlling factor<br />
in reservoir development and hydrocarbon production (Coogan and<br />
Lesser, 1991; Riley and others, 1993).<br />
The Rose Run sandstone interval thickens gradually from zero<br />
feet at the western limit of the subcrop to about 200 feet throughout<br />
the area of eastern Ohio and northwestern Pennsylvania (Figure A4-<br />
3). The irregular nature of the Rose Run isopach map in Ohio near<br />
the subcrop is a result of erosion on the Knox unconformity. Various<br />
paleotopographic features, including numerous erosional remnants,<br />
are present along the subcrop trend as a result of paleodrainage.<br />
East of this broad zone of gradual thickening, the contours become<br />
narrower in western Pennsylvania as a result of the rapid thickening<br />
that is present in the Rome trough. Various authors have indicated<br />
that the Rome trough was actively subsiding during Rose Run deposition<br />
(Wagner, 1976; Harper, 1991). Approximately 470 feet of<br />
Rose Run was encountered in the Amoco #1 Svetz well in Somerset<br />
County, Pennsylvania before drilling was stopped at 21,640 feet;<br />
most of that thickness occurred in the uppermost sandstone body.<br />
The depositional pattern of the Rose Run in south-central Ohio<br />
and north-central Kentucky suggests control by the Waverly arch, a<br />
north-south trending feature that was first identified by Woodward<br />
(1961). Isopach maps of the Knox by Janssens (1973), and the Prairie<br />
du Chien by Shearrow (1987), indicate thinning over the feature.<br />
This thinning is also coincident with a facies change in the Rose<br />
Run in which it is sandstone-dominant on the east side and carbonate-dominant<br />
on the west side of the Waverly arch (Riley and others,<br />
1993). A rather abrupt thinning occurs on the isopach map across the<br />
state line boundary of Ohio and Kentucky. This is, in part, an artifact<br />
of how the base of the Rose Run is interpreted differently in Ohio<br />
and Kentucky as discussed previously. In eastern Kentucky, changes<br />
in the contours along the Rome trough indicate that this fault influenced<br />
Rose Run deposition.<br />
DEPOSITIONAL ENVIRONMENTS/<br />
PALEOGEOGRAPHY/TECTONISM<br />
Following the Rome trough aulacogen and deposition of the basal<br />
sandstones described in an earlier section, Late Cambrian recycled<br />
sands, including those of the Rose Run, continued to be deposited<br />
across the present-day Appalachian basin area. These sands were<br />
mixed with shelf carbonates that eventually dominated this passive<br />
margin (Riley and others, 1993). Provenance studies of the Rose<br />
Run sandstone suggest that they are compositionally mature and<br />
were derived from the crystalline Precambrian shield complexes<br />
and overlying platform rocks (Miall, 1984; Riley and others, 1993).<br />
The widespread Knox unconformity developed during the initial<br />
collision of the passive margin and the lowering of eustatic sea level<br />
in the Middle Ordovician (Mussman and others, 1988; Read, 1989).<br />
The progressive westward truncation of Knox units along this regional<br />
unconformity created and exposed the Rose Run subcrop<br />
trend (Figures A4-1, A4-3 and A4-4).<br />
Deposition of the Rose Run and adjacent Knox units has been<br />
attributed by various authors to represent a peritidal to shallow<br />
subtidal marine environment (Mussman and Read, 1986; Anderson,<br />
1991; Gooding, 1992; Ryder, 1992a; Ryder and others, 1992; Riley<br />
and others, 1993). The Rose Run is part of a heterogeneous assemblage<br />
of interbedded siliciliclastic and carbonate facies in the Knox<br />
that were deposited on a carbonate shelf, which Ginsburg (1982)<br />
referred to as the “Great American Bank.” The Rose Run represents<br />
lowstand deposits of siliciclastic sediments that were transported<br />
onto the peritidal platform and reworked during subsequent sealevel<br />
rises (Read, 1989).<br />
Many authors have interpreted tidal flat deposition for the Rose<br />
Run and equivalent strata (Mussman and Read, 1986; Anderson,<br />
1991; Enterline, 1991; Riley and others, 1993) based upon core and<br />
outcrop description. Sedimentary features supporting this include<br />
herringbone cross bedding and basal lags of dolostone and shaly<br />
dolostone indicating scour along tidal channel thalwegs. In outcrop<br />
in central Pennsylvania, a shallowing-upward tidal flat sequence<br />
is recognized and include the following subfacies: 1) storm sheet<br />
deposition with flat pebble conglomerates; 2) algal patch reefs with<br />
thrombolitic bioherms; 3) subtidal ooid-peloid sand shoals with<br />
cross stratified ooid grainstones; 4) lower intertidal mixed sandmud<br />
flats with ribbon rock; 5) upper intertidal algal flats with prismcracked<br />
wavy laminites; and 6) supratidal flats with mudcracked<br />
flat laminites (Riley and others, 1993). Subsurface cores in Ohio<br />
also indicate a supratidal facies from the presence of digitate algal<br />
stromatolites, mudcracks, and nodular anhydrite and chert replacing<br />
evaporites. Extensive mottling from bioturbation indicative of intertidal<br />
and subtidal environments is pervasive throughout the Rose<br />
Run and adjacent Knox units.<br />
SUITABILITY AS A CO 2<br />
INJECTION TARGET OR SEAL UNIT<br />
Suitability of CO 2 injection for the Rose Run can be subdivided<br />
into three geographic areas for discussion: 1) within the Rose Run<br />
subcrop trend; 2) downdip of the eastern edge of the subcrop; and<br />
3) within the Rome Trough. In most of these areas, the Rose Run<br />
occurs at depths greater than 2,500 feet, which should be within the<br />
preferred condition to obtain adequate minimum miscibility pressures<br />
for CO 2 sequestration. Availability of subsurface well data<br />
is greatest within the subcrop trend, where most of the petroleum<br />
exploration and production from this formation has occurred. Thus,<br />
knowledge of reservoir characteristics is best within the subcrop<br />
trend, where thousands of oil and gas wells have targeted the Rose<br />
Run, and decreases basinward away from the subcrop.<br />
Within and adjacent to the Rose Run subcrop, reservoir quality<br />
is controlled by erosional truncation and paleotopography on the<br />
Knox unconformity. Erosional remnants are found along the subcrop<br />
trend, typically 80 acres or less in area. Large-scale injection<br />
of CO 2 in Rose Run remnants would be difficult because of their<br />
limited size. However, reservoir quality within these remnants is
72 CHARACTERIZATION OF GEOLOGIC SEQUESTRATION OPPORTUNITIES IN THE <strong>MRCSP</strong> REGION<br />
often very good because of enhanced secondary porosity, and would<br />
provide good areas for enhanced oil recovery. Within the subcrop<br />
trend, average porosities measured from core and geophysical logs<br />
range from 6 to 12 percent with values as high as 14 percent (Riley<br />
and others, 1993; Baranoski and others, 1996). Permeabilities<br />
vary widely from .01 to 198 md, averaging 4 md (Baranoski and<br />
others, 1996). Thickness of the Rose Run varies depending on the<br />
size of the remnant. Wells with a complete section of Rose Run in<br />
the subcrop trend have a gross thickness of approximately 110 feet<br />
and a net thickness of about 50 feet of highly porous, permeable<br />
sandstone. The subcrop trend of the Rose Run (Figure A4-1) is an<br />
attractive prospect for CO 2 injection.<br />
High porosities and permeabilities are not restricted to wells<br />
within the subcrop trend. Cores in Jackson and Scioto counties,<br />
Ohio, approximately 40 to 50 miles down dip from the subcrop,<br />
indicate average porosities ranging from six to 12 percent, and permeabilities<br />
often greater than 1.0 md, with some values exceeding<br />
100 md. These porosities and permeabilities indicate good reservoir<br />
quality away from the highly drilled and explored subcrop trend.<br />
Although the gross interval of the Rose Run thickens to the east,<br />
the sandstone-to-carbonate ratio decreases to the east and southeast,<br />
suggesting a clastic source to the north and northwest (Riley and<br />
others, 1993). Thus, net sandstone generally decreases to the east<br />
and southeast. The American Electric Power #1 AEP well drilled<br />
in New Haven, West Virginia, encountered only 18 net feet of<br />
sandstone greater than six percent porosity within the Rose Run.<br />
This well was drilled as part of a DOE-funded project to assess the<br />
potential injection for CO 2 sequestration.<br />
There has been no oil or gas production from the Rose Run in<br />
Kentucky, and there are fewer data to determine the composition,<br />
reservoir quality, and suitability of the Rose Run as an injection<br />
target. While the Rome trough was actively subsiding during Rose<br />
Run deposition, large amounts of clastic sediment were probably<br />
built up in localized areas of Kentucky, West Virginia, and Pennsylvania.<br />
Wells such as the Amoco #1 Svetz well in Somerset County,<br />
Pennsylvania, with approximately 470 feet of Rose Run, indicate<br />
the potential for large sequestration capacity at the greater depths in<br />
the Rome trough. Well logs in Kentucky indicate porosity up to 18<br />
percent at depths greater than 5,000 feet in the Rose Run.<br />
In most areas the Rose Run sandstone contains an adequate seal<br />
and confining units for CO 2 sequestration, as indicated by the trapping<br />
efficiency of significant volumes of oil and gas. The nonporous<br />
Beekmantown Formation dolostone and Wells Creek Formation<br />
that directly overlie the Rose Run provide an excellent seal for<br />
containment of CO 2. In some areas (e.g., south-central Kentucky),<br />
the Beekmantown is porous and is a hydrocarbon reservoir. The risk<br />
of an inadequate seal is higher in these areas, especially where the<br />
Beekmantown is fractured. In Ohio, a thick sequence of Ordovician<br />
shales and Black River and Trenton carbonates overlie the Rose<br />
Run and serves as a confining unit. Below the Rose Run, a thick<br />
sequence of Cambrian dolostone and shale act as the confining unit<br />
between the Rose Run and earlier Cambrian sandstones.<br />
To date there has been no injection activity in the Rose Run, thus<br />
data regarding CO 2 injectivity is not available. A DOE-funded pilot<br />
study is currently under consideration at the AEP New Haven site to<br />
inject CO 2 into the Rose Run and other potential units. This will provide<br />
critical data necessary for evaluating the injectivity in potential<br />
areas for Rose Run sequestration.<br />
5. KNOX TO LOWER SILURIAN UNCONFORMITY INTERVAL<br />
The stratigraphic sequence herein referred to as the Knox to<br />
Lower Silurian Unconformity Interval has been mapped because of<br />
its potential function as a major confining interval. This interval is<br />
dominated by thick, relatively impermeable carbonates at the bottom<br />
and thick shale sequences at the top. There is, however, some<br />
potential for carbon sequestration in several of the units, including<br />
the St. Peter Sandstone (which is mapped and discussed separately<br />
for this project), some of the fractured or dolomitized portions of the<br />
carbonate sequence, and the coarser clastics of the Bald Eagle and<br />
Juniata Formations at the top of the sequence in the eastern part of<br />
the <strong>MRCSP</strong> study area. The interval is bounded by two major unconformities,<br />
the Knox unconformity at the base and the Cherokee<br />
unconformity at the top (i.e., at the Ordovician-Silurian boundary).<br />
The stratigraphic nomenclature associated with the Knox to<br />
Lower Silurian Unconformity Interval can be intimidating (Figure<br />
5). Most of the laterally equivalent units shown in Figure 5 are<br />
lithologically similar, at least in the lower half of the correlation<br />
diagram, despite name changes across state boundaries. The stratigraphic<br />
nomenclature toward the top of the Ordovician sequence,<br />
however, becomes much more complex due to the multitude of<br />
westward prograding Upper Ordovician flysch facies resulting from<br />
the Taconic orogeny.<br />
ORIGIN OF NAMES, TYPE SECTION, SIGNIFICANT<br />
EARLIER STUDIES ON THIS INTERVAL<br />
The St. Peter Sandstone is the lowest (Middle Ordovician) strata<br />
in the Knox to Lower Silurian Unconformity Interval in the Michigan<br />
basin. However, because it is discussed in detail elsewhere in<br />
this report, it will not be mentioned further here except in reference<br />
to adjacent formations. In the following discussion, italicized state<br />
names in parentheses, for example (Michigan), indicate the use of<br />
the particular stratigraphic name in that state, whether or not it is a<br />
direct lithologic correlative of the type section.<br />
Calvin (1906) named the Middle Ordovician Glenwood Formation<br />
(Michigan) for a thin (3 to 15 feet) shale in Glenwood<br />
Township, Winneshiek County, Iowa, lying between the St. Peter<br />
Sandstone and the Platteville Limestone. The Ancell Group (Indiana),<br />
named by Templeton and Willman (1952) for rocks exposed<br />
in the Dixon-Oregon area of northern Illinois, comprises in ascending<br />
order, the Kingdom, Daysville, Loughridge, and Harmony Hill<br />
Formations. Lusk (1927) first used the name Wells Creek Formation<br />
(Kentucky, Ohio, West Virginia, and northwestern Pennsylvania)<br />
without explanation in a stratigraphic column of rocks in central<br />
Tennessee, apparently to replace Ulrich’s (1911) Wells Chert (the<br />
name Wells was already in use for a younger formation in Idaho<br />
and Utah). Bentall and Collins (1945) later described the Wells<br />
Creek Formation as 432 feet of tan to grayish green, silty to sandy,<br />
argillaceous, fine-grained dolostone interbedded with dark-brown to<br />
tan, dense limestone lying between the Knox unconformity and the<br />
Murfreesboro Limestone in the Ada Belle Oil #2-A well in Trigg<br />
County, Kentucky. Ulrich (1911) named the Bellefonte Formation<br />
of the Beekmantown Group (central Pennsylvania and Maryland)<br />
for 2,145 feet of light-gray, argillaceous, highly magnesian limestone<br />
and yellowish-gray or drab, generally fine-grained and occasionally<br />
laminated dolostone alternating with dark, finely crystalline<br />
dolostone at Bellefonte, Centre County, Pennsylvania. All of these<br />
formations are more or less equivalent in age and grade laterally<br />
with each other.<br />
Field (1919) recognized a zone of interbedded limestone and
APPENDIX A: KNOX TO LOWER SILURIAN UNCONFORMITY INTERVAL<br />
73<br />
dolostone above the dolostones of the Beekmantown that he called<br />
the Loysburg Formation (Pennsylvania) from outcrops at Loysburg,<br />
Bedford County, Pennsylvania. This formation is considered Middle<br />
Ordovician in age at the type locality, but grows progressively<br />
younger westward across the state (Berg and others, 1986). Westward,<br />
drillers refer to a clean micritic limestone interval in this part<br />
of the section as the “Gull River limestone” (Ohio), an erroneous<br />
name originally applied to a younger stratigraphic unit in Ontario<br />
(Wickstrom, 1996).<br />
Above these strata are the Upper Ordovician Black River Group<br />
(or Limestone) (Michigan, Indiana, Ohio, Pennsylvania, West Virginia,<br />
and Maryland), named by Vanuxem (1842) for the Ordovician<br />
limestones lying below the Trenton Limestone in cliffs along<br />
the Black River in New York. Its equivalent is the High Bridge<br />
Group (Kentucky), which was described by Campbell (1898), for<br />
200 feet of white limestone grading downward into gray limestone<br />
and calcareous shales. The High Bridge includes in ascending order,<br />
the Camp Nelson, Oregon, and Tyrone Limestones (Cressman and<br />
Peterson, 2001). Above these strata are the Trenton Group (or Limestone)<br />
(Michigan, Indiana, Ohio, Pennsylvania, West Virginia, and<br />
Maryland), first described by Vanuxem (1938) from Trenton Falls,<br />
Oneida County, New York, where 100 feet of light-gray, sparry<br />
limestone underlain by dark-gray to black compact limestone are<br />
exposed in the waterfall and adjacent cliffs. The equivalent Lexington<br />
Limestone (Kentucky) was described by Campbell (1898) for<br />
140 to 180 feet of thin-bedded, gray limestone that contains chert<br />
nodules at the base and a persistent band of chert at the top. It has<br />
since been divided into numerous members (Cressman, 1973).<br />
Above the Trenton/Lexington interval, the section becomes increasingly<br />
complicated. Dark mudrocks gradually to sharply replace<br />
the carbonates, and in turn are replaced by coarser clastics. The<br />
Richmond Group (southwestern Michigan) consists of three formations<br />
described by Hussey (1926) from Delta County, Michigan,<br />
including (in ascending order): 1) the Bill’s Creek Shale, composed<br />
of thin-bedded shales with thin layers of interbedded argillaceous,<br />
fossiliferous limestone exposed on Bill’s Creek; 2) the Stonington<br />
Formation, consisting of a lower 20 feet of cherty limestones and<br />
upper 38 feet of argillaceous limestone in alternating hard and soft<br />
layers exposed north of the Stonington Post Office; and 3) the Big<br />
Hill Formation, a 27 feet thick sequence of light-gray, moderately<br />
hard, noncrystalline limestone grading to dark-gray, hard, coarsely<br />
crystalline, argillaceous limestone exposed along Maywood Road.<br />
White (1870) described the equivalent Maquoketa Group (Indiana)<br />
as 80 feet of bluish and brownish shales exposed on the Little<br />
Maquoketa River in Dubuque County, Iowa. The U. S. <strong>Geologic</strong>al<br />
Survey later adopted the name for the middle formation of the Richmond<br />
Group in the lower Mississippi Valley.<br />
The Clays Ferry Limestone (central and eastern Kentucky and<br />
southern Ohio) is equivalent with the lower part of the Maquoketa.<br />
It consists of interbedded thin shales, limestones, and siltstones (as<br />
summarized by Weir and others, 1965) and grades upward and laterally<br />
into interbedded carbonate and clastic lithologies comprising<br />
the Fairview, Leipers, Ashlock, Drakes, Grant Lake, and Bull Fork<br />
formations (Kentucky and southern Ohio), as summarized by Weir<br />
and others (1984) and Cressman and Peterson (2001). The Clays<br />
Ferry grades northward and eastward into the Point Pleasant Formation<br />
(Ohio and Pennsylvania), a relatively thick sequence of interlayered<br />
gray to green, calcareous shale, limestone, siltstone, and<br />
sandstone named by Newberry (1873) for strata exposed at Point<br />
Pleasant, Clermont County, Ohio. The Point Pleasant grades eastward<br />
and southeastward with the Utica Shale (southeastern Michigan,<br />
eastern Ohio, West Virginia, Maryland, and Pennsylvania), a<br />
series of gray to black and brown shales with few, if any, interbedded<br />
limestones. This unit was named by Emmons (1842) for black<br />
shales exposed in Utica, Oneida County, New York.<br />
Above the Utica is a thick sequence of shales that Ulrich (1911)<br />
named the Reedsville Formation (western Pennsylvania and western<br />
West Virginia) for exposures at Reedsville, Mifflin County,<br />
Pennsylvania. The Utica and Reedsville together grade laterally<br />
into the Martinsburg Formation (central Pennsylvania, Maryland,<br />
West Virginia, and southeastern Ohio), named by Geiger and Keith<br />
(1891) for exposures at Martinsburg, West Virginia. The Martinsburg<br />
consists primarily of dark colored calcareous and argillaceous<br />
shales with some siltstone and limestone. This sequence (Utica<br />
and Reedsville/Martinsburg) gradually coarsens upward. Where<br />
the dominant lithology is sandstone the names Oswego Sandstone<br />
(southeastern Ohio, West Virginia, and Maryland) and Bald Eagle<br />
Formation (Pennsylvania) are applied. Prosser (p. 946 in Ashburner,<br />
1888) first used the name Oswego Sandstone to replace “grey sandstone<br />
of Oswego,” a term used by Emmons (1842) for exposures in<br />
Oswego County, New York. The Oswego consists of gray, fine- to<br />
coarse-grained sandstones interbedded with siltstones and shales.<br />
Grabau (1909) named the Bald Eagle for gray to white conglomerates<br />
and quartz sandstones exposed on Bald Eagle Mountain in Blair<br />
County, Pennsylvania. The Oswego and Bald Eagle grade upward<br />
into the red sandstones and shales of the Juniata Formation (central<br />
Pennsylvania, Maryland, West Virginia, and southeastern Ohio).<br />
Darlton (1896; also Darlton and Taff, 1896) first referred to the<br />
Juniata while describing brownish-red sandstones alternating with<br />
red shales. The name refers to exposures along the Juniata River<br />
in central Pennsylvania. To the north and west, the Juniata loses<br />
most of the coarser clastics, and the name changes to Queenston<br />
Formation (southeastern Michigan, northeastern Ohio, and western<br />
Pennsylvania), although the red coloration remains. Grabau (1908)<br />
first used the name Queenston for red shales underlying the Medina<br />
Sandstone at Queenston, Ontario. Thompson (1999) summarized<br />
the stratigraphic and lithologic character of the post-Trenton clastics<br />
sequence in Pennsylvania and adjacent areas, and Laughrey and<br />
Harper (1996) studied the potential for gas production from the Bald<br />
Eagle and Oswego formations. Because the Bald Eagle/Oswego and<br />
Juniata sequences have carbon sequestration potential, more details<br />
are provided below.<br />
NATURE OF LOWER AND UPPER CONTACTS<br />
The Knox to Lower Silurian Unconformity Interval is bounded<br />
on the bottom by the Knox unconformity and at the top by the<br />
Cherokee unconformity. Based on lithostratigraphy, both unconformities<br />
seemingly grade to conformable contacts eastward in central<br />
Pennsylvania and Maryland. However, with the advent of sequence<br />
stratigraphy in the 1980s and 1990s, it has been shown that at least<br />
the Cherokee unconformity is probably basin wide in nature.<br />
The Knox unconformity (= Owl Creek unconformity in North<br />
America) is a much larger magnitude erosional event than the Cherokee<br />
unconformity. It developed as a result of a change in the southern<br />
margin of the Laurentian plate from passive to convergent by<br />
arc-continent or microplate-continent collision during Middle Ordovician<br />
time (Jacobi, 1981; Shanmugam and Lash, 1982; Scotese<br />
and McKerrow, 1991). This caused major changes in sea level, tectonism,<br />
and depositional environments across the continent (Mussman<br />
and Read, 1986; Read, 1989). By the early Middle Ordovician,<br />
much of the southern continental shelf of Laurentia was emergent,<br />
resulting in exposure of the Middle Ordovician through Upper Cambrian<br />
strata to severe erosion, from the Transcontinental arch in the
74 CHARACTERIZATION OF GEOLOGIC SEQUESTRATION OPPORTUNITIES IN THE <strong>MRCSP</strong> REGION<br />
midcontinent region almost to the center of the depositional basin in<br />
central Pennsylvania and Maryland. Throughout the <strong>MRCSP</strong> study<br />
area, the Knox unconformity is easily recognized by the juxtaposition<br />
of upper Middle Ordovician strata (St. Peter Sandstone, Wells<br />
Creek Formation, Glenwood Formation) on the often karstified surface<br />
of Cambrian or Lower Ordovician strata (Baranoski and others,<br />
1996). In places, it amounted to 30 million years worth of erosion<br />
(Brett and Caudill, 2004). In central Pennsylvania, however, there is<br />
no specific evidence of an unconformity. A zone of chert occurs near<br />
the base of the Bellefonte Formation of the Beekmantown Group<br />
(Figure 5) throughout central Pennsylvania from Bedford County to<br />
Centre County (Knowles, 1966). Ryder and others (1992; also Riley<br />
and others; 1993) speculated that this chert zone might be a remnant<br />
of the Knox unconformity surface that is unidentifiable by other<br />
means in this area. This hypothesis has never been tested. It is probable<br />
that a sequence stratigraphic approach, rather than a classical<br />
lithostratigraphic one, will be required to resolve this problem.<br />
The Cherokee unconformity is one of the most important regional<br />
unconformities in North America. It resulted from a combination<br />
of tectonism—the end of the Taconic orogeny—and eustacy. The<br />
Cherokee unconformity, which coincides with the Ordovician-Silurian<br />
boundary, has been correlated across most of North America. In<br />
classical stratigraphy, the unconformity does not exist in the eastern<br />
part of the Appalachian basin (central Pennsylvania, Maryland, and<br />
northeastern West Virginia). Instead, the Upper Ordovician Juniata<br />
Formation grades conformably upward into the Lower Silurian Tuscarora<br />
Formation. There is even a sequence of rocks containing<br />
features of both the Juniata and Tuscarora that has been called the<br />
“Juniata-Tuscarora transition zone” in Pennsylvania (Avary, 1996;<br />
McCormac and others, 1996) and the “lower Tuscarora Sandstone”<br />
in Virginia (Dorsch and others, 1994). However, a growing body of<br />
evidence from sequence stratigraphic studies in these and adjacent<br />
areas suggests that the Cherokee unconformity occurs basin-wide,<br />
even within this transition zone (Castle, 1998; Dorsch and others,<br />
1994; Hettinger, 2001; Ryder, 2004).<br />
LITHOLOGY AND DEPOSITIONAL ENVIRONMENTS<br />
Much of the Cambrian and Ordovician stratigraphic section comprises<br />
a thick sequence of predominantly shallow-water carbonates<br />
formed on what Ginsburg (1982) called the “Great American Bank.”<br />
This bank extended more than 1,875 miles along the length of the<br />
southern seaboard of the Laurentian plate from Early Cambrian<br />
through early Late Ordovician time (Hardie, 1986), and contained<br />
a complex mosaic of interdependent subenvironments in which<br />
depositional processes imprinted distinctive physical, diagenetic,<br />
and biogenic features on the sediments. Although sedimentation<br />
was primarily carbonate precipitation and skeletal grain reworking,<br />
the bank received periodic influxes of shales, siltstones, and sandstones<br />
from the Laurentian highlands north and west of the basin<br />
(for example, the Glenwood and Wells Creek Formations). The<br />
clastics periodically interrupted carbonate deposition and resulted<br />
in argillaceous carbonates, alternating carbonates and shales, and<br />
the occasional siltstone or sandstone overprint over much of the<br />
extent of the platform.<br />
Both the Upper Ordovician carbonates and mixed carbonate/shale<br />
sequences typically consist of well-cemented, bioclastic grainstones<br />
and carbonate mudstones separated by relatively thin calcareous shales<br />
or argillaceous limestones that developed in shallow-platform and peritidal<br />
settings (Nuttall, 1996). A generalized depositional model (Figure<br />
A5-1) shows a variety of carbonate shelf facies that characterize parts<br />
of the Middle and Upper Ordovician sequence in the study area.<br />
Figure A5-1.—Generalized model of Middle and Upper Ordovician carbonate<br />
depositional environments (based on Walker and James, 1992; from<br />
Nuttall, 1996).<br />
In summary, the Glenwood and Wells Creek formations represent<br />
a brief interval of mixed clastic and carbonate sedimentation in a<br />
shallow sea that spread back across the area following the Knox unconformity<br />
event. Black River and High Bridge strata were deposited<br />
in shallow epeiric seas in environments ranging from shallow<br />
subtidal to tidal flat, while Trenton and Lexington carbonates were<br />
deposited in somewhat more clastic-rich shelf environments to the<br />
east and southwest, and cleaner carbonate platform environments to<br />
the northwest (Figure A5-2) (Wickstrom, 1996).<br />
The Utica Shale and Point Pleasant Formation represent a major<br />
transgression across the eastern United States, resulting in a deeper<br />
interplatform, anoxic depositional environment (Figure A5-2) that<br />
probably started penecontemporaneously with the later Trenton carbonate<br />
buildups in response to compression from the Taconic orogeny<br />
(Wickstrom and others, 1992). The dark colored shales indicate a<br />
large influx of organic material, restricted circulation, and low-energy<br />
conditions within the depositional basin (Bergström and Mitchell,<br />
1992). In fact, there has been some debate over whether or not an<br />
unconformity exists at the top of the Trenton (Keith and Wickstrom,<br />
1993). Wickstrom and others (1992) concluded that the contact between<br />
the Trenton/Lexington and the Utica/Point Pleasant represents<br />
a disconformity. Based on conodont biostratigraphy, Bergström and<br />
Mitchell (1992) determined that this contact represents a period of<br />
very slow, or interrupted, deposition in a submarine environment.<br />
The succession of clastics above the Utica/Point Pleasant interval<br />
includes, in ascending order: 1) gray shales and minor siltstones of<br />
the Reedsville and Martinsburg Formations; 2) gray, sandstones<br />
of the Oswego Sandstone and correlative fine- to coarse-grained<br />
sandstones and conglomerates of the Bald Eagle Formation; and<br />
3) the reddish sandstones and shales of the Juniata Formation and<br />
reddish shales of the correlative Queenston Formation. These units<br />
comprise a distinctive clastic sequence in the Appalachian basin<br />
during Ordovician time that contains well-developed marine units<br />
formed on the continental margin, as well as shallow marine to nonmarine<br />
units deposited on the foreland of the Taconic orogenic belt<br />
(Laughrey and Harper, 1996). Thompson (1970, 1999) defined six<br />
lithofacies that reflect the sedimentary processes active within these<br />
diverse depositional systems (Figure A5-3). Grabau (1909) originally<br />
defined the Bald Eagle Formation as the gray-colored sandstones<br />
lying between the gray shales of the Reedsville Formation and the<br />
red beds of the Juniata Formation. However, Horowitz (1965) demonstrated<br />
that the Bald Eagle sandstones initially were red like those
APPENDIX A: KNOX TO LOWER SILURIAN UNCONFORMITY INTERVAL<br />
75<br />
Figure A5-2.—Regional reconstruction of major depositional and tectonic elements present near the end of Trenton-age<br />
deposition (from Wickstrom, 1996).<br />
of the Juniata, and that the color was later leached out by diagenetic<br />
processes. As such, color in the Bald Eagle is only of diagenetic significance<br />
and has no stratigraphic importance. The gray-to-red color<br />
boundary actually occurs at different levels at different localities,<br />
varies by as much as 656 feet, and crosscuts distinctive lithostratigraphic<br />
units (Laughrey and Harper, 1996) (Figure A5-3).<br />
DEPTH AND THICKNESS RANGES<br />
The Knox unconformity surface lies approximately 11,000 feet below<br />
sea level at its deepest point in the Michigan basin, but it is only<br />
500 to 1,000 feet below sea level on the Cincinnati, Kankakee, and<br />
Findlay arches. It actually is exposed at the surface in central Kentucky<br />
(Figure A5-4). The surface deepens again into the Rome trough,<br />
and at the point where it seems to disappear from the sequence of<br />
dolostones in the Beekmantown Group in south-central Pennsylvania<br />
and northeastern West Virginia it is about 15,000 feet below sea level.<br />
In the Amoco #1 Svetz well in Somerset County, Pennsylvania, the<br />
estimated equivalent position of the unconformity is at about 19,300<br />
feet. In this well, the Beekmantown Group appears to be a completely<br />
uninterrupted sequence just under 3,000 feet thick.<br />
The Cherokee unconformity lies at a maximum depth of about<br />
8,500 feet in the Michigan basin (Figure A5-5). It is exposed on the<br />
central arches of eastern Indiana, western Ohio, and central Kentucky,<br />
but becomes deeper once again down into the Appalachian<br />
basin where it reaches a maximum depth of about 9,000 feet in<br />
southwestern Pennsylvania and northwestern West Virginia. The<br />
pattern of structure contours in the Appalachian basin shown in<br />
Figure A5-5 closely follows the present geometry of the basin. This<br />
is in contrast to the structure contours on the Knox unconformity<br />
(Figure A5-4) that seem to indicate a fairly sharp bend in the basin<br />
center in south-central Pennsylvania. The contour differences may<br />
represent a progression from Rome trough-dominated structures<br />
on the Middle Ordovician carbonate bank to the relatively more<br />
modern basin structure that originated with the Taconic orogeny.<br />
However, the paucity of wells in the area penetrating the Ordovician<br />
section requires cautious interpretation.<br />
The thickness of the Knox to Lower Silurian Unconformity Interval<br />
in the western part of the <strong>MRCSP</strong> study area ranges from<br />
600 feet in the extreme northwestern corner of Indiana to more than<br />
2,800 feet in the Michigan basin (Figure A5-6). Thickness along the<br />
central arches ranges from 0 to 2,000 feet thick. In the Appalachian<br />
basin, thickness increases from 2,000 along the western edge of the<br />
basin in Ohio to more than 6,000 feet in central Pennsylvania.
76 CHARACTERIZATION OF GEOLOGIC SEQUESTRATION OPPORTUNITIES IN THE <strong>MRCSP</strong> REGION<br />
TRAPS/STRUCTURE<br />
Figures A5-4 and A5-5 show only the grossest structures in the<br />
<strong>MRCSP</strong> study area—the Michigan and Appalachian basins, and the<br />
central arches area of eastern Indiana, western Ohio, and central<br />
Kentucky. Other, somewhat more subtle geologic structures occur<br />
throughout the region that have affected the siting of wells targeting<br />
deeper Ordovician and Cambrian production. Many good hydrocarbon<br />
producing areas within the region are associated with flexures<br />
and structural noses mapped on higher formations that are not apparent<br />
on regional maps (Potter, 1978).<br />
Figure 6 illustrates some of the major structural features affecting<br />
the <strong>MRCSP</strong> study area that are not readily apparent in Figures<br />
A5-4 and A5-5. Those of prime importance include the Grenville<br />
front, East Continental rift basin, Rome trough, Bowling Green<br />
fault zone, Findlay arch, Cincinnati arch, Lexington fault system,<br />
and the Pine Mountain thrust fault. Some production is associated<br />
with fractures stemming from these structures, and some occur as<br />
a result of subtle diagenetic affects related to equally subtle highs.<br />
Ordovician carbonate reservoirs, for example, are coincident with<br />
subsurface features associated with these structures. Some structural<br />
traps occur in narrow, linear, dolomitized zones along normal and<br />
strike-slip faults associated with basement faults. For example, the<br />
Albion-Scipio trend in Michigan is a model for fault-related fractured<br />
and dolomitized reservoir rocks in the Ordovician carbonates.<br />
Wickstrom and others (1992) speculated that much of the fracturing<br />
associated with Ordovician carbonate reservoirs probably resulted<br />
from reactivation of deeper structures. Oil and gas fields associated<br />
with fractured Ordovician carbonates in eastern Kentucky and central<br />
West Virginia lie along mapped faults associated with the Rome<br />
trough, a large Cambrian extensional feature extending from central<br />
Kentucky through West Virginia and Pennsylvania (McGuire and<br />
Howell, 1963; Harris, 1978), possibly into New York (Harper, 1989;<br />
Jacobi and others, 2004).<br />
Similarly, Lacazette (1991) indicated that the Bald Eagle Formation<br />
was highly fractured in the limited area of north-central<br />
Pennsylvania where the formation produces natural gas. Henderson<br />
and Timm (1985) identified deep-seated (basement-involved),<br />
down-to-the-north, normal faulting on seismic data extending<br />
upward through Upper Ordovician carbonates and shales (Trenton<br />
and Utica). Fracture porosity in the Bald Eagle sandstones occurs in<br />
zones containing vertical to subvertical fracture sets associated to<br />
the deep-seated faulting (Laughrey and Harper, 1996).<br />
SUITABILITY AS A CO 2<br />
INJECTION TARGET OR SEAL UNIT<br />
Sealing Units<br />
Figure A5-3.—Representation of Upper Ordovician clastic lithofacies<br />
(based on Thompson, 1970). The bracketed interval indicates the range of<br />
color-boundary fluctuation within the Bald Eagle interval.<br />
The Knox to Lower Silurian Unconformity Interval has many<br />
properties favorable for a confining unit. The carbonate rocks above<br />
the Knox unconformity typically serve as a fluid barrier (Baranoski<br />
and others, 1996), and the shales above provide an extra seal in areas<br />
where fracture porosity and permeability exist in the carbonates.<br />
Faults, fractures, and the Knox paleokarst system provide the<br />
major migration avenues for fluids within the Ordovician carbonate<br />
sequence (Nuttall, 1996), so these rocks would have the most effective<br />
sealing properties in areas where fracturing has not occurred,<br />
or where the fractures have been sealed by mineralization. Figure<br />
6 shows the major basement structures in the <strong>MRCSP</strong> study area,<br />
structures that are known to have affected fracturing in the carbonates.<br />
The best potential areas for seals should occur where these
APPENDIX A: KNOX TO LOWER SILURIAN UNCONFORMITY INTERVAL<br />
77<br />
EXPLANATION<br />
Structural Front Line<br />
FAULTS<br />
5000 ft index contours<br />
500 ft contours<br />
Elevation in feet<br />
-10000<br />
0<br />
-15000<br />
-5000<br />
B OWL ING G R EE N<br />
FA ULT S YS TEM<br />
-1000<br />
E<br />
N<br />
L I<br />
G<br />
P R O J E C<br />
-5000<br />
-10000<br />
T A<br />
-10000<br />
-15000<br />
M I<br />
T O F M A P<br />
T U R A L F R O N T<br />
I N<br />
P<br />
T L<br />
A<br />
D<br />
U C<br />
N T<br />
L I<br />
R<br />
0<br />
I M I<br />
T<br />
I N S U F F I C I E<br />
S<br />
T<br />
50 25 0 50 100 Miles<br />
50 25 0 50 100 150 Kilometers<br />
³<br />
Figure A5-4.—Structure contour map drawn on the top of the Knox surface (mainly Knox unconformity).
N<br />
T<br />
78 CHARACTERIZATION OF GEOLOGIC SEQUESTRATION OPPORTUNITIES IN THE <strong>MRCSP</strong> REGION<br />
EXPLANATION<br />
structurefront<br />
FAULTS<br />
5000 ft Index contours<br />
-8500<br />
500 ft contours<br />
Mean sea elevation (feet)<br />
500<br />
-5000<br />
-9000<br />
INSUFFICIENT DATA<br />
B OWL ING G RE EN<br />
FA ULT S YS TE M<br />
0<br />
E<br />
N<br />
L I<br />
G<br />
P R O J E C<br />
T L<br />
O U T<br />
O R<br />
C R<br />
D O<br />
O P<br />
V I<br />
C I A<br />
-5000<br />
-9000<br />
D A T A<br />
U C<br />
L I<br />
M I<br />
T U R A L F R O N T<br />
I N<br />
T O F M A P P<br />
R<br />
N<br />
T<br />
I E<br />
S<br />
-5000<br />
0<br />
I M I<br />
T<br />
500<br />
I N S U<br />
F F<br />
I C<br />
50 25 0 50 100 150 Miles<br />
50 25 0 50 100 150 200 Kilometers<br />
³<br />
Figure A5-5.—Structure contour map drawn on the Lower Silurian (Cherokee) unconformity.
N<br />
T<br />
R<br />
APPENDIX A: KNOX TO LOWER SILURIAN UNCONFORMITY INTERVAL<br />
79<br />
EXPLANATION<br />
structurefront<br />
FAULTS<br />
1000 ft index contours<br />
100 ft contours<br />
Thickness in feet<br />
6000<br />
2000<br />
600<br />
INSUFFICIENT DATA<br />
BOWLING G R EEN<br />
FAU LT SY S TEM<br />
6000<br />
E<br />
1000<br />
3000<br />
L I<br />
N<br />
G<br />
P R O J E C<br />
T L<br />
I M I<br />
O U T<br />
O R<br />
C R<br />
D O<br />
O P<br />
V I<br />
C<br />
I A N<br />
2000<br />
4000<br />
D A T A<br />
4000<br />
U C<br />
L I<br />
M I<br />
T O F M A P P<br />
T U R A L F R O N T<br />
I N<br />
T<br />
T<br />
I N S U<br />
F F<br />
I E<br />
I C<br />
0 25 50 100 150 Miles<br />
S<br />
³<br />
0 25 50 100 150 200 Kilometers<br />
Figure A5-6.—Map showing the thickness of the Knox to Lower Silurian unconformity interval.
80 CHARACTERIZATION OF GEOLOGIC SEQUESTRATION OPPORTUNITIES IN THE <strong>MRCSP</strong> REGION<br />
structures are absent or have had little or no effect on the interval.<br />
The shales, particularly the very argillaceous and organic-rich<br />
shales of the Maquoketa, Clays Ferry, Utica, and Point Pleasant<br />
formations, should provide excellent sealing capability. Like the<br />
Upper Devonian organic-rich shales, they probably have low matrix<br />
porosities and permeabilities, even in fractured zones that would<br />
provide effective seals for sequestration targets in lower strata. Although<br />
the formation is characterized as fractured, joints within the<br />
Maquoketa have collapsed due to the fissile nature of the shale, and<br />
where present, the low hydraulic conductivity of the rock inhibits<br />
fluid flow. In fact, it has been referred to as the Maquoketa Confining<br />
Unit in regional aquifer studies (McGarry, 1996). It is highly<br />
likely the same attributes will be found within the other Upper Ordovician<br />
shales as well.<br />
Lack of measured physical parameters for these strata in areas<br />
not known to produce oil or gas will be a problem in evaluating the<br />
rocks for sealing potential. A considerable amount of research will<br />
be necessary to determine these parameters prior to initiating any<br />
injection projects.<br />
Potential Injection Targets<br />
There are at least four targets for sequestration potential in the<br />
Knox to Lower Silurian Unconformity Interval: 1) fractured or<br />
coarse-grained bioclastic carbonates; 2) enhanced gas recovery in<br />
thick organic-rich black shales of the Utica/Point Pleasant; 3) fractured<br />
Bald Eagle and Oswego sandstones and conglomerates; and 4)<br />
possible fractured or diagenetically altered Juniata sandstones.<br />
Ordovician Carbonates—According to Sullivan (1983) and Nuttall<br />
(1996), stratigraphic traps occur in the upper part of the Lexington<br />
Limestone in Kentucky, sealed by fine-grained, impermeable<br />
strata and tightly cemented grainstones. Net pay thickness averages<br />
10 feet, and average matrix porosity is 11.8 percent with a maximum<br />
porosity of 15 percent. Moldic, interparticular, intraparticular, and<br />
intercrystalline porosity types dominate. Nuttall (1996) reported<br />
that a core from Clinton County, Kentucky had an average reservoir<br />
permeability of 57.1 millidarcies (md) and a maximum permeability<br />
of 293 md. In this particular area of Kentucky, the Ordovician carbonates<br />
are too shallow for effective sequestration (less than 2,500<br />
feet), but similar reservoir zones in the Trenton Limestone in deeper<br />
parts of the Michigan and Appalachian basins could ultimately be<br />
useful for sequestration. This is especially true in areas where porosity<br />
and permeability occur as a result of fracturing. Production<br />
from fractured Black River/High Bridge and Trenton/Lexington<br />
reservoirs in central Kentucky and West Virginia appears to be from<br />
open, unmineralized fractures, probably related to reactivation of<br />
deep-seated faults, although Hamilton-Smith and others (1990)<br />
acknowledge that minor secondary mineralization might help keep<br />
the fractures open. Dolomitized fracture zones and grainstone facies<br />
account for much of the upper Black River/High Bridge and<br />
Trenton/Lexington production in southeastern Michigan, Kentucky,<br />
central Ohio, south-central Ontario, north-central Pennsylvania, and<br />
south-central New York. In areas affected by large fault systems<br />
with sizeable gouge zones, fluids interacted with the gouge to create<br />
thick zones of mineralization and vugular porosity within the zones,<br />
whereas smaller fault systems are more likely to have good intercrystalline<br />
porosity development (Wickstrom, 1996).<br />
Utica Shale and Point Pleasant Formation—Both the Utica and<br />
Point Pleasant consist of dark gray to black, organic-rich shales,<br />
with the Point Pleasant also containing interbedded Trenton-type<br />
limestones. Many authors (for example, see Cole and others, 1987;<br />
Wallace and Roen, 1989; Ryder and others, 1991; Wickstrom, 1996)<br />
consider the Utica/Point Pleasant interval to be the source rocks for<br />
the hydrocarbons found in the underlying Trenton and Black River<br />
carbonates, as well as many of the overlying units (Bald Eagle, Medina,<br />
Tuscarora, Lockport, etc.). The Utica /Point Pleasant interval<br />
is more than 700 feet thick in parts of central Pennsylvania, but thins<br />
to the northwest until it is only about 100 feet thick in northwestern<br />
Ohio (Wickstrom, 1996). Because of their thickness and depth below<br />
2,500 feet in much of the Michigan and Appalachian basins, the<br />
Utica/Point Pleasant shales could have potential for sequestration<br />
through enhanced shale gas recovery. Gas content probably varies<br />
regionally with changes in thickness, pressure, organic carbon content,<br />
and thermal maturity, as in the Upper Devonian black shales<br />
of Appalachian and Michigan basins (Boswell, 1996). The interval<br />
does not have a history of gas production (although strong shows<br />
through the interval are regularly noted), so it would require substantial<br />
research to determine how effective the shales would be to<br />
both sequestration and gas production.<br />
Bald Eagle and Oswego Formations—The Bald Eagle Formation,<br />
where it produces natural gas in north-central Pennsylvania<br />
at depths of 12,900 to 13,272 feet, is a naturally fractured reservoir<br />
in which the fractures are vertical to subvertical and run parallel to<br />
structural axes (Laughrey and Harper, 1996). There is no known<br />
production from the Oswego Sandstone in the <strong>MRCSP</strong> study area,<br />
but owing to lithologic similarities with the Bald Eagle, it probably<br />
would also serve as a producing reservoir and potential sequestration<br />
target in zones of intense fracturing. The sandstones from the<br />
pay interval consist of moderately sorted to well sorted, fine- to<br />
medium-grained, lithic arenites. Monocrystalline quartz and chert<br />
dominate composition, but detrital and authigenic feldspars, some<br />
altered to chlorites and mixed-layer illite-smectite, mica, low-grade<br />
metamorphic rock fragments, and trace amounts of homblende and<br />
pyrite also occur. Dolomite, with some minor calcite, comprise the<br />
principal cement in the matrix, but they also contain minor authigenic<br />
quartz cement (Laughrey and Harper, 1996). The sandstone<br />
matrix has relatively low porosity and permeability, which contributes<br />
to the seal. In addition, syntectonically precipitated minerals,<br />
such as quartz, hematite, and calcite, often partially fill the fractures.<br />
Upward-decreasing grain size, increasing clay content, and shale<br />
beds in the overlying Juniata Formation might assist in sealing the<br />
reservoir (Laughrey and Harper, 1996). Porosity and permeability<br />
are extremely variable—fracture zones have porosities as high as<br />
30 percent, whereas matrix porosities tend to be only two to eight<br />
percent and matrix permeability was calculated at 0.07 md in the<br />
reservoir, with all of the production coming from fracture permeability<br />
(Laughrey and Harper, 1996)<br />
Juniata Formation—Although Laughrey and Harper (1996)<br />
consider the shales and fine-grained sandstones of the Juniata Formation<br />
to contribute to the seal for Bald Eagle/Oswego reservoirs,<br />
there is some potential for Juniata sandstones to act as sequestration<br />
targets. This apparent discrepancy in interpretation is the result of<br />
confusion of terminology. As Thompson (1970, 1999) has shown,<br />
the Bald Eagle/Oswego and Juniata are artificial lithologic constructs<br />
based on color differences—the Bald Eagle/Oswego is gray,<br />
and the Juniata is red. Inasmuch as the color boundary between the<br />
two formations varies by up to 656 feet within the Upper Ordovician<br />
clastic lithofacies, Thompson (1970) recommended that the lithofacies<br />
were far more consistent and meaningful than the formation<br />
names. Thompson (1970, p. 1256, 1257) described lithofacies D<br />
(Figure A5-3) as “unfossiliferous, cross-bedded medium- to coarsegrained<br />
sandstone and conglomerate, with essentially no siltstone or
APPENDIX A: MIDDLE ORDOVICIAN ST. PETER SANDSTONE<br />
81<br />
shale, 700 to 800 ft thick . . .” This lithofacies occurs primarily in<br />
the Bald Eagle/Oswego, but because of the variability of the color<br />
boundary, it also occurs to some extent in the Juniata. Lithofacies<br />
E, composed of siltstone and shale with minor sandstone interbeds,<br />
overlies lithofacies D, providing the latter with an effective seal.<br />
The uppermost lithofacies in the sequence (F) consists of mediumgrained<br />
sandstone with rare shale interbeds. As such, it could also<br />
be a potential sequestration target, given the proper porosity and<br />
permeability parameters. These data are lacking, however, because<br />
no one has attempted to produce hydrocarbons from the Juniata.<br />
Therefore, any consideration of the Juniata as a sequestration target<br />
would require a great deal of research to determine its physical and<br />
chemical characteristics.<br />
CONCLUSIONS<br />
It is very likely that the Knox to Lower Silurian Unconformity<br />
Interval will provide a suitable confining unit for CO 2 sequestration<br />
in strata below the Knox unconformity, but only following complete<br />
evaluation of the interval at potential target sites. Ideal conditions<br />
within the interval at target sites must include, at a minimum, established<br />
low matrix porosity and permeability in both the carbonate<br />
and shale portions of the interval, as well as a lack of fracturing, or<br />
complete mineralization of fractures, in the carbonate section.<br />
Conversely, four of the units have some potential for sequestration<br />
within their matrices, including the potential for CO 2 enhanced<br />
recovery of hydrocarbons. Matrix porosity typically is restricted<br />
to very narrow zones, if it exists at all, within the carbonates and<br />
clastics of the interval. However, fracture porosity and permeability,<br />
particularly in the carbonates and the Bald Eagle/Oswego sandstones<br />
and conglomerates, has been established in numerous areas<br />
of the Applachian and Michigan basins. These areas have potential<br />
for both sequestering carbon and for producing additional resources<br />
to meet the nation’s demand for oil and natural gas.<br />
6. MIDDLE ORDOVICIAN ST. PETER SANDSTONE<br />
The St. Peter Sandstone is a widespread quartz arenite unit<br />
in the Michigan and Illinois basin areas of the <strong>MRCSP</strong> study<br />
area (Figures 5, A6-1, and A6-2) (Michigan, Indiana, western<br />
Kentucky, and northwestern Ohio). This Middle to Upper Ordovician<br />
unit is widely recognized throughout the mid-continent<br />
as an unconformity-related sandstone. It lies above dolomitized<br />
rocks of the Knox Group in Ohio, eastern and southern Indiana<br />
and Kentucky, and above the Prairie du Chien Group in Michigan<br />
and northern Indiana. The St. Peter Sandstone is overlain by the<br />
Glenwood Formation in Michigan and Indiana and by the Wells<br />
Creek Formation in Kentucky, Ohio, and West Virginia. The St.<br />
Peter Sandstone appears to be better developed on the western side<br />
of the <strong>MRCSP</strong> study area; however, wells drilled in Ohio, West<br />
Virginia, and eastern Kentucky occasionally report a thin St. Peter<br />
Sandstone on the Knox unconformity. In local areas of eastern<br />
Kentucky along the Rome Trough, the St. Peter is much thicker.<br />
The exact stratigraphic relationship of the St. Peter Sandstone in<br />
West Virginia and eastern Kentucky is not known due to the sparse<br />
deep wells in the area.<br />
ORIGIN OF NAMES, TYPE SECTION, SIGNIFICANT<br />
EARLIER STUDIES ON THIS INTERVAL<br />
Owen (1847) first used the name St. Peter Sandstone for<br />
sandstone outcrops along the St. Peter River (now Minnesota<br />
River) near Minneapolis/St. Paul, Minnesota. The type section<br />
is along a bluff where the Minnesota River joins the Mississippi<br />
River at Fort Snelling, Minnesota. Many detailed studies<br />
describe stratigraphic, sedimentologic, and petrologic relationships<br />
in the St. Peter Sandstone in the region of the outcrop<br />
in Minnesota, Wisconsin and northern Illinois (for examples,<br />
see Dott and Byers, 1981; Mai and Dott, 1985; Mazullo and<br />
Ehrlich, 1987; Collinson and others, 1988). Recent studies<br />
emphasize correlation to well known outcrop occurrences,<br />
stratigraphic and sedimentologic similarities and difference,<br />
and petrology of the St. Peter sandstone in the Michigan basin<br />
subsurface (Barnes and others, 1992; Barnes and others, 1996).<br />
Subsurface studies in other parts of the <strong>MRCSP</strong> study area include<br />
Price (1981) in eastern Kentucky, and Humphreys and<br />
Watson (1996). This latter reference provides an overview of<br />
the St. Peter gas play in the Appalachian basin.<br />
NATURE OF LOWER AND UPPER CONTACTS<br />
The St. Peter Sandstone overlies an extensive erosional unconformity<br />
on top of dolostones of the Knox and Prairie du Chien Groups.<br />
This erosional surface can have significant topographic relief, especially<br />
across the major structural arches and reactivated faults in the<br />
region. The thickness of the St. Peter can vary significantly around<br />
such features. This pre-St. Peter topographic relief was caused by<br />
erosion, resulting in stream channels, and, more commonly, sinkhole<br />
formation upon a karsted surface. The St. Peter underlies the<br />
Glenwood or Wells Creek Formations with a gradational contact.<br />
In Indiana and Ohio, the upper part of the St. Peter Sandstone is<br />
thought to be the facies equivalent of the Wells Creek, which is locally<br />
arenaceous near the base. In general, the St. Peter Sandstone is<br />
a clean, relatively pure, quartz arenite and yields a very low gamma<br />
ray value on geophysical logs. In the Michigan basin, where the<br />
St. Peter is very thick, intervals of higher gamma ray values are<br />
found near the base and at various intervals throughout the section,<br />
indicating interbeds of shale and other argillaceous rocks within the<br />
total St. Peter section. Except in the center of the Michigan basin,<br />
the base of the St. Peter shows a sharp contact with the underlying<br />
dolostone on wireline logs. The upper contact is generally gradational<br />
with increasing gamma ray intensity toward the shaley or<br />
mixed siliciclastic Glenwood/Wells Creek Formation.<br />
LITHOLOGY<br />
The St. Peter Sandstone is usually a clean, nearly pure, quartz<br />
arenite throughout the region. However, in Michigan, the St. Peter<br />
Sandstone also exhibits interbedded shale and shaley dolostone.<br />
Biostratigraphic data suggests little or no hiatus at the base of the<br />
St. Peter in the center of the Michigan basin (Barnes and others,<br />
1996). Portions of central Michigan may have a gradational contact<br />
relationship with shaley carbonates of the underlying Foster Formation.<br />
Throughout the section in Michigan, the St. Peter has beds with<br />
higher potassium feldspar concentrations. Near the top of the formation,<br />
the St. Peter becomes arkosic, with more than 25 percent feldspar<br />
in some layers. Known cements include considerable amounts<br />
of quartz overgrowths and dolomite in some areas. Authigenic clays<br />
are also present as matrix. In most areas, the St. Peter Sandstone<br />
is medium-grained, although small amounts of coarse- and fine-
50<br />
30<br />
82 CHARACTERIZATION OF GEOLOGIC SEQUESTRATION OPPORTUNITIES IN THE <strong>MRCSP</strong> REGION<br />
³<br />
20 0 20 40 Miles<br />
EXPLANATION<br />
20 0 20 40 60 Kilometers<br />
10 ft contours<br />
100 ft Index contours<br />
1000<br />
FAULTS<br />
800<br />
Thickness in feet<br />
600<br />
1000<br />
400<br />
0<br />
200<br />
20<br />
B OWLIN G GR E E N<br />
FA ULT S Y STE M<br />
100<br />
80<br />
P R O J E C T L I M I T<br />
N T<br />
T E<br />
E E X T<br />
E U N D<br />
O F U N I T<br />
R M I<br />
N E D<br />
Figure A6-1.—Map showing the thickness of the St. Peter Sandstone.
-6000<br />
-8000<br />
APPENDIX A: MIDDLE ORDOVICIAN ST. PETER SANDSTONE<br />
83<br />
EXPLANATION<br />
2000 ft index contours<br />
1000 ft contours<br />
³<br />
20 0 20 40 Miles<br />
20 0 20 40 Kilometers<br />
FAULTS<br />
Elevation in feet<br />
-1000<br />
-9000<br />
-4000<br />
B OWLIN G GR E E N<br />
FA ULT S Y STEM<br />
-2000<br />
N T<br />
T E<br />
E X T E<br />
E U N D<br />
O F U N I T<br />
R M I<br />
N E D<br />
P R O J E C<br />
T L I<br />
M I T<br />
Figure A6-2.—Structure contour map drawn on the top of the St Peter Sandstone.
84 CHARACTERIZATION OF GEOLOGIC SEQUESTRATION OPPORTUNITIES IN THE <strong>MRCSP</strong> REGION<br />
grained textures are present throughout the section. Cross bedding,<br />
bioturbation, and rare shell fossils have been observed in outcrop<br />
and core material. Porosity is usually good in outcrop and the shallow<br />
subsurface; however, burial compaction and cementation significantly<br />
reduce porosity in the deeper subsurface. In some facies<br />
in the Michigan basin, early carbonate cement and feldspar grains<br />
have been dissolved, producing extensive secondary porosity. Porosity<br />
as high as 14 percent has been measured from core at depths<br />
greater than 11,000 feet in central Michigan. Throughout Ohio, the<br />
St. Peter, where present, is a relatively clean, well-rounded, fine- to<br />
medium- to coarse-grained, friable, quartz arenite. Drillers in Ohio<br />
encounter flows of brine from this thin, yet highly porous and permeable<br />
unit that typically washes out during drilling.<br />
DISCUSSION OF DEPTH AND THICKNESS RANGES<br />
The St. Peter Sandstone is thinnest (10 to 100 feet) and shallowest<br />
(depths of less than 2,500 feet) across the arches of Indiana<br />
and Ohio (Figures A6-1 and A6-2). The unit is thickest and deepest<br />
in the Illinois and Michigan basins. The thickness of the St. Peter<br />
Sandstone exceeds 1,100 feet in the center of the Michigan basin,<br />
which is ten times greater than the maximum thickness across the<br />
arches in Indiana and Ohio. No significant thickening is noted in<br />
the southwestern portion of the region at the margin of the Illinois<br />
basin. In Michigan, the St. Peter ranges from approximately 3,000<br />
feet deep at the southern state line to more than 11,000 feet deep in<br />
the basin center.<br />
DEPOSITIONAL ENVIRONMENTS/<br />
PALEOGEOGRAPHY/TECTONISM<br />
Large areas of the North American craton were exposed during<br />
Knox unconformity time, thus providing ample sediments to be<br />
reworked and deposited as part of the St. Peter Sandstone. Penecontemporaneous<br />
subsidence in the Michigan and Illinois basins<br />
resulted in thick accumulations being preserved in those areas.<br />
Subsequent erosion may have removed much of the sand deposited<br />
across Ohio and adjacent areas. Subsidence along the Rome trough<br />
in northern Kentucky also resulted in locally thick St. Peter Sandstone<br />
(Price, 1981; Humphreys and Watson, 1996). Studies from<br />
the outcrop of the St. Peter Sandstone in Wisconsin (west of the<br />
<strong>MRCSP</strong> study area) suggest that it was deposited in a terrestrial to<br />
shallow marine shelf facies belt that transgressed across the upper<br />
<strong>Midwest</strong> (Dott and Byers, 1981). Aeolian facies are known from<br />
central Wisconsin and marine facies have been documented from<br />
other areas of the outcrop belt. In the Michigan basin, the facies<br />
range from shoreface to inner and outer marine shelf (Barnes and<br />
others, 1992).<br />
SUITABILITY AS A CO 2<br />
INJECTION TARGET OR SEAL UNIT<br />
Because of its widespread occurrence, depth, and porosity in the<br />
Michigan basin, the St. Peter Sandstone should make an important<br />
sequestration target there. Northern and eastern Kentucky has good<br />
potential, where the St. Peter is locally thick, although more data are<br />
needed. Ohio and Indiana have marginal to spotty potential, due mainly<br />
to the shallower depths and thin nature of the unit in these areas.<br />
Injectivity rates are not well known for the St. Peter Sandstone in<br />
Michigan; however, it is an important oil- and gas-producing unit.<br />
High flow rates of natural gas (5 to 30 million cubic feet per day<br />
[MMcfpd]) and gas condensate have been recorded from Michigan<br />
wells. Porosity above 10 percent is present at various intervals<br />
throughout the formation. Permeability ranges from less than 10<br />
to over 300 md. Porosity and permeability have been shown to be<br />
related to primary depositional facies and formation of secondary<br />
porosity (Barnes and others, 1992).<br />
In the Michigan basin, porosity decreases proportionally with<br />
burial depth due to compaction and quartz cementation, so that,<br />
below 4,000 to 5,000 feet, there is usually very little porosity in this<br />
unit. In some facies that have a high feldspar grain content that had<br />
been cemented early with carbonate minerals, however, significant<br />
secondary porosity has formed at depth by dissolution of carbonate<br />
cement and grains. At depths below 7,000 feet, the only apparent<br />
porosity is from this secondary dissolution processes (Barnes and<br />
others, 1992). Although permeability generally increases with porosity,<br />
the precipitation of authigenic clay minerals in the secondary<br />
porosity may severely reduce permeability and create microporosity<br />
that may not be very effective. The porosity and permeability at<br />
depth will require further analysis.<br />
7. LOWER SILURIAN MEDINA GROUP/“CLINTON” SANDSTONE<br />
The Medina Group (Figure 5) consists of interbedded sandstones,<br />
siltstones, and shales with some carbonates of Early Silurian age<br />
(McCormac and others, 1996). The stratigraphic nomenclature of<br />
this unit is somewhat complex, due to the influence of both facies<br />
changes across the Appalachian basin and drillers’ terminology.<br />
Specifically, this sequence is known as the Medina Group in northwestern<br />
Pennsylvania and western New York; the Cataract Group in<br />
southern Ontario and eastern Ohio; and erroneously as the “Clinton”<br />
sandstone by basin drillers, particularly in eastern Ohio and northern<br />
Kentucky (see discussion below). The Medina Group of Pennsylvania<br />
and New York is comprised of three major stratigraphic units,<br />
in descending order: 1) the Grimsby Formation; 2) the Cabot Head<br />
Shale (sometimes called the Power Glen Shale); and 3) the Whirlpool<br />
Sandstone (Figure A7-1). In eastern Ohio, drillers’ terminology<br />
predominates, so the Grimsby is called the “Clinton” sandstone, and<br />
the Whirlpool is known as the “Medina” sandstone. The “Clinton”<br />
undergoes a facies change in central Ohio (Figure A7-2), where the<br />
porous (petroleum-producing) sandstones associated with this unit<br />
pinch out and are replaced by the Cabot Head Shale and limestone<br />
of the Brassfield Formation. The <strong>MRCSP</strong> discussion of this interval<br />
revolves around its potential as a CO 2 sink, thus this interval is not<br />
mapped or discussed separately west of this facies change. A fourth<br />
unit, known as the Manitoulin Dolomite, is equivalent to the basal<br />
Whirlpool Sandstone and is present in southern Ontario, eastern<br />
Ohio, and near the shores of Lake Erie in Pennsylvania (Laughrey,<br />
1984; McCormac and others, 1996; Castle, 1998). In the southern<br />
and eastern portions of the basin, the Medina Group nomenclature<br />
is lost. In northern Kentucky, the “Clinton” and Tuscarora Sandstones<br />
are equivalent to the Grimsby and Whirlpool sandstones of<br />
northwestern Pennsylvania, respectively (McCormac and others,<br />
1996). In West Virginia and southcentral and central Pennsylvania,<br />
the stratigraphic equivalent of the Medina Group is the Tuscarora<br />
Sandstone, and in eastern Pennsylvania, the Shawangunk Formation<br />
is equivalent to this sequence (Piotrowski, 1981; Avary, 1996).
APPENDIX A: LOWER SILURIAN MEDINA GROUP/“CLINTON” SANDSTONE<br />
85<br />
Figure A7-1.—Stratigraphic correlation chart of the Medina Group/“Clinton” Sandstone and equivalent units in the <strong>MRCSP</strong><br />
study area (modified from Avary, 1996, and McCormac and others, 1996).<br />
ORIGIN OF NAMES, TYPE SECTION, SIGNIFICANT<br />
EARLIER STUDIES ON THIS INTERVAL<br />
The Medina Group was named by Vanuxem (1840) for its type<br />
locality in Medina, Orleans County, New York. The basal unit of<br />
this sequence, the Whirlpool Sandstone, was first named by Grabau<br />
(1909) for its type locality along the Canadian side of the whirlpool<br />
in the Niagara River Gorge, and the uppermost unit of this sequence,<br />
the Grimsby Sandstone, was first named by Williams (1914). Reference<br />
to the productive zones in this sequence as “Clinton” originated<br />
in Fairfield County, Ohio, where drillers erroneously thought<br />
that limestone in the overlying Clinton Group was the source of<br />
gas in the Medina discovery well (McCormac and others, 1996).<br />
By the time it was established that the Medina Group sandstones<br />
were actually the producing units in these early wells, the “Clinton”<br />
misnomer had become engrained in basin operator terminology, and<br />
still is today.<br />
Early studies of the Medina and equivalent units were performed<br />
in the 1960s through early 1980s (Yeakel, 1962; Knight, 1969;<br />
Martini, 1971; Piotrowski, 1981; Cotter, 1982, 1983). A summary<br />
of these and related works was provided in McCormac and others<br />
(1996). By the 1990s, sequence stratigraphy was emerging as an<br />
important tool for the interpretation of reservoir rocks. Perhaps the<br />
most prominent, recently published studies relative to the Medina<br />
Group and equivalent units are those of Castle (1998), Hettinger<br />
(2001), and Ryder (2004). Each of these researchers used sequence<br />
stratigraphy, rather than lithostratigraphy, to correlate early Silurianage<br />
units in the northern Appalachian basin.<br />
NATURE OF LOWER AND UPPER CONTACTS<br />
The nature of the contacts of the Medina Group with overlying<br />
and underlying units varies depending upon which stratigraphic<br />
approach is applied. The traditional, lithostratigraphic view of<br />
early Silurian-age rocks in the Appalachian basin is consistent<br />
with a conformable upper contact between the Medina and Clinton<br />
Groups, and a combination of conformable and unconformable<br />
lower contacts between this sequence and Upper Ordovician<br />
clastics. In the northern portion of the basin, the Medina Group is<br />
interpreted as unconformably underlain by the Queenston Shale<br />
(Piotrowski, 1981; Laughrey, 1984; Laughrey and Harper, 1986;<br />
Brett and others, 1995; McCormac and others, 1996). The origin<br />
of this unconformity is associated with a drop in sea level (i.e.,<br />
regression) during late Ordovician time. As the Medina grades into<br />
the Tuscarora Sandstone in south-central and central Pennsylvania,<br />
however, traditional lithostratigraphy interprets a gradational contact<br />
with the Queenston Shale’s equivalent, the Juniata Formation<br />
(Heyman, 1977; Piotrowski, 1981; Avary, 1996; McCormac and<br />
others, 1996). This conformable contact between the Tuscarora and<br />
Juniata extends southward through West Virginia and into eastern<br />
Kentucky (Avary, 1996). In eastern Pennsylvania, the Tuscarora<br />
Sandstone’s equivalent facies, the Shawangunk Formation, is unconformably<br />
underlain by the Upper Ordovician Martinsburg Formation<br />
(Avary, 1996).<br />
In recent years, the oil and gas industry has begun to use sequence<br />
stratigraphy to interpret reservoir rock relationships. Using<br />
this framework as a guide, the Medina and equivalent units are<br />
seen as unconformably underlain by the Queenston Shale and Juniata<br />
Formation basin-wide (Castle, 1998; Hettinger, 2001). Hettinger<br />
(2001) identifies the Cherokee discontinuity as the sequence<br />
boundary between the Medina Group and underlying Queenston<br />
Shale, with this boundary interpreted as inferred between the Tuscarora<br />
and Juniata Formations in the eastern portion of the basin.<br />
At the top of the Medina Group, a marine flooding surface separates<br />
the Grimsby Sandstone from the overlying Clinton Group<br />
(Castle, 1998).
86 CHARACTERIZATION OF GEOLOGIC SEQUESTRATION OPPORTUNITIES IN THE <strong>MRCSP</strong> REGION<br />
...........................<br />
F A C I E<br />
S C<br />
H A N<br />
................<br />
.............<br />
....<br />
G E<br />
.<br />
..............<br />
....... ..<br />
INDIAN CREEK POOL<br />
NATURAL CO 2 PRODUCTION<br />
EXPLANATION<br />
Gas Fields<br />
Oil Fields<br />
20 10 0 20 40 60 Miles<br />
20 10 0 20 40 60 80 Kilometers<br />
³<br />
Figure A7-2.—Oil and gas fields producing from the Medina Group/“Clinton” Sandstone and Tuscarora Sandstone. The limit of production in Ohio delineates<br />
a facies change whereby these sands pinch-out and are replaced by the Cabot Head Shale and limestone of the Brassfield Formation.
APPENDIX A: LOWER SILURIAN MEDINA GROUP/“CLINTON” SANDSTONE<br />
87<br />
LITHOLOGY<br />
The Medina Group is composed of interbedded sandstones, siltstones,<br />
and shales, with some carbonates (Laughrey, 1984; Laughrey<br />
and Harper, 1986; McCormac and others, 1996). The sandstones of<br />
the Grimsby Formation are very fine- to medium-grained, monocrystalline,<br />
quartzose rocks, with subangular to subrounded grains,<br />
variable sorting, and thin, discontinuous, silty shale interbeds.<br />
These sandstones vary in color, from white to gray to red; hence,<br />
the reference to these units by drillers as “Red Clinton” and “White<br />
Clinton”, particularly in eastern Ohio (Figure A7-1). Cementing materials<br />
include secondary silica, evaporites, hematite, and carbonates<br />
(Piotrowski, 1981; McCormac and others, 1996). The Cabot Head<br />
Shale is a dark green to black, marine shale with thin, quartzose, siltstone<br />
and sandstone laminations that increase in number toward the<br />
top of the unit (Piotrowski, 1981; Laughrey, 1984). The Whirlpool<br />
Sandstone forms the basal unit of this sequence, and, in the greater<br />
part of the Appalachian basin, is composed of a white to light gray to<br />
red, fine- to very fine-grained quartzose sandstone that is moderately<br />
well sorted and has subangular to subrounded grains (Piotrowski,<br />
1981; Brett and others 1995; McCormac and others, 1996). This<br />
basal unit becomes dolomitic in localized areas within the northwestern<br />
part of the basin (i.e., the Manitoulin Dolomite) (Laughrey,<br />
1984; McCormac and others, 1996; Castle, 1998).<br />
DEPTH AND THICKNESS RANGES<br />
The Medina Group crops out at its type locality in New York; in<br />
central Pennsylvania, outcrops of the equivalent Tuscarora Sandstone<br />
are present. In the remainder of the Appalachian basin, however,<br />
the Medina and equivalent units remain in the subsurface. The<br />
depth to this reservoir ranges from less than 1,000 feet to 6,700 feet,<br />
with wells located offshore in central Lake Erie reporting depths of<br />
over 2,200 feet (McCormac and others, 1996).<br />
Figure A7-3 illustrates the structure of the Medina Group throughout<br />
the basin. Structure contours are given in subsea elevations using<br />
an interval of 500 feet. The structure on top of the Medina Group<br />
strikes northeast-southwest and dips toward the southeast at a rate of<br />
approximately 40 to 70 feet per mile, with more shallowly dipping<br />
strata toward the north and west. A low point (subsea elevation of<br />
-9,000 feet) exists in southwestern Pennsylvania and northern West<br />
Virginia. East of this point, toward the Appalachian structural front,<br />
the Medina Group dips steeply to the northwest at rates of 70 to<br />
about 180 feet per mile.<br />
Figure A7-4 illustrates the thickness of this sequence across the<br />
basin using a contour interval of 50 feet. Gross thicknesses range<br />
from 0 feet in the northwestern portion of the basin to more than<br />
700 feet in eastern West Virginia. These thicknesses are generally<br />
consistent with those previously published by McCormac and others<br />
(1996) and Laughrey and Harper (1986). The actual pay zones of the<br />
Medina Group (i.e., where reservoir porosity and permeability are<br />
favorable) comprise only a portion of these thicknesses, however.<br />
Pay zones range from 3 to 50 feet and average 23 feet in thickness<br />
(McCormac and others, 1996).<br />
The structure and thickness of the Medina Group and equivalent<br />
units, as presented in Figures A7-3 and A7-4, are consistent with<br />
the interpretation that during early Silurian time, an influx of siliciclastic<br />
material came from eroding Taconic highlands and an island<br />
arc located at the eastern edge of the Appalachian basin (i.e., central<br />
Pennsylvania and eastern West Virginia). These sediments were<br />
shed across the basin to create a clastic wedge that is thickest in the<br />
southeast and thins toward the northwest. The low area on the structure<br />
contour map (Figure A7-3) is indicative of the foreland basin<br />
that existed adjacent to the eroding highlands.<br />
DEPOSITIONAL ENVIRONMENTS/<br />
PALEOGEOGRAPHY/TECTONISM<br />
The depositional history of the Medina Group dates back to the<br />
latter part of the Taconic orogeny in early Silurian time. During<br />
this period, clastic material eroded from both foreland fold-belt<br />
highlands adjacent to the eastern edge of the Appalachian basin<br />
and the plutonic igneous rocks of the island arc orogen (Laughrey,<br />
1984; Laughrey and Harper, 1986; McCormac and others, 1996).<br />
The directions of sediment transport from these highlands were<br />
both parallel (i.e., northeast-southwest) and perpendicular (i.e.,<br />
to the northwest) to the shoreline (Laughrey and Harper, 1986),<br />
which ran from northern Beaver County to central Warren County<br />
in Pennsylvania (Piotrowski, 1981). The Medina depositional<br />
system is that of a shelf/longshore-bar/tidal-flat/delta complex.<br />
The Whirlpool Sandstone is the basal transgressive unit of this<br />
system and is overlain by shelf muds and transitional silty sands<br />
of the Cabot Head Shale. These sediments were overlain by shoreface<br />
and nearshore sands of the lower Grimsby Sandstone, which<br />
grade into argillaceous sands at the top of this unit (Laughrey,<br />
1984; Laughrey and Harper, 1986; McCormac and others, 1996).<br />
Laughrey (1984) divided the Medina Group’s depositional system<br />
into five facies: 1) tidal flat, tidal creek, and lagoonal sediments;<br />
2) braided fluvial-channel sediments; 3) littoral deposits; 4) offshore<br />
bars; and 5) sublittoral sheet sands. Facies 1, 2, and 3 sediments<br />
comprise the Grimsby Sandstone, which was deposited in a complex<br />
deltaic to shallow marine environment. The deeper, offshore<br />
mud and sand bar deposits of Facies 4 were reworked by both storm<br />
and tidal currents to become transitional sandstones of the Cabot<br />
Head Shale. The Whirlpool Sandstone is included in Facies 5, which<br />
was formed in nearshore marine and fluvial, braided river environments<br />
in existence during the beginning of a marine transgression<br />
(Piotrowski, 1981; Laughrey, 1984; McCormac and others, 1996).<br />
STRUCTURE/TRAP TYPES<br />
Throughout the Appalachian basin, stratigraphic traps have been<br />
shown to control the occurrence of gas in the Medina Group, although<br />
in localized areas (e.g., Portage County, Ohio, and Mercer<br />
County, Pennsylvania), gas production may be enhanced by geologic<br />
structure (Piotrowski, 1981; Laughrey and Harper, 1986; McCormac<br />
and others, 1996). The overall heterogeneity of this reservoir is<br />
evidenced by the variety of mechanisms forming the stratigraphic<br />
traps, which include sandstone pinchouts, porosity changes, gaswater<br />
contacts, and diagenesis (Laughrey and Harper, 1986).<br />
SUITABILITY AS A CO 2<br />
INJECTION TARGET OR SEAL UNIT<br />
The <strong>MRCSP</strong> considers the Medina Group/ “Clinton” sandstone<br />
as a sequestration target (Figure 5), particularly for its prevalence<br />
throughout the Appalachian basin as a reliable oil-and-gas-producing<br />
reservoir (Figure A7-2), its sandstone lithologies, and the<br />
presence of less permeable confining rocks above and below the<br />
sequence. However, several factors, including the variability in<br />
lithology, the “tight” nature of this reservoir (with respect to both<br />
porosity and permeability), and discontinuity of sandstone lenses in<br />
the northwestern portion of the basin, may limit the overall success<br />
of the Medina Group as a CO 2 sequestration target.
88 CHARACTERIZATION OF GEOLOGIC SEQUESTRATION OPPORTUNITIES IN THE <strong>MRCSP</strong> REGION<br />
EXPLANATION<br />
2500 ft index contours<br />
500 ft contours<br />
Mean sea elevation (feet)<br />
0<br />
-10000<br />
-10000<br />
0<br />
F A C I E S C H A N<br />
....................<br />
...........<br />
....<br />
......<br />
....<br />
-2500<br />
-5000<br />
-7000<br />
-8000<br />
-5000<br />
L I M I<br />
T O<br />
G<br />
F M A P P I N<br />
..........<br />
G E<br />
.... ...<br />
30 15 0 30 60 Miles<br />
30 15 0 30 60 90 Kilometers<br />
³<br />
Figure A7-3.—Structure contour map on the top of the Medina Group/“Clinton” sandstone sequence.
APPENDIX A: LOWER SILURIAN MEDINA GROUP/“CLINTON” SANDSTONE<br />
89<br />
EXPLANATION<br />
100 ft Index contours<br />
50 ft contours<br />
Thickness in feet<br />
700<br />
0<br />
F A C I E S C H A<br />
N G<br />
............<br />
..........<br />
...<br />
.<br />
....................<br />
100<br />
100<br />
500<br />
200<br />
600<br />
300<br />
100<br />
700<br />
400<br />
L I M I<br />
T O<br />
G<br />
F M A P P I N<br />
...........<br />
E<br />
.... ...<br />
30 15 0 30 60 Miles<br />
³<br />
30 15 0 30 60 90 Kilometers<br />
Figure A7-4.—Map showing the thickness of the Medina Group/“Clinton” sandstone.
90 CHARACTERIZATION OF GEOLOGIC SEQUESTRATION OPPORTUNITIES IN THE <strong>MRCSP</strong> REGION<br />
The Medina Group is comprised of interbedded sandstones,<br />
mudrocks, and some carbonates that were deposited under variable<br />
conditions (Laughrey, 1984; Laughrey and Harper, 1986; McCormac<br />
and others, 1996). As a result, this reservoir is heterogeneous<br />
because of variations in several rock characteristics, including grain<br />
size, type and degree of cementation, clay content, and pore geometry<br />
(McCormac and others, 1996). This is evidenced in the three<br />
major facies of this sequence, the Grimsby Formation, Cabot Head<br />
Shale, and Whirlpool Sandstone as described above. Due to these<br />
lithologic variations within the Medina Group, detailed characterization<br />
of this unit for injection potential needs to be performed at<br />
each prospective site.<br />
Figure A7-5 illustrates typical geophysical log curves for the<br />
Medina Group in the northern Appalachian basin. The gamma-ray<br />
signature demonstrates the relatively thick, sandy nature of the<br />
Grimsby, the increasing-upward siltstone/sandstone laminations<br />
within the Cabot Head Shale, and the abrupt, sandy signature of the<br />
Whirlpool Sandstone as it overlies the Queenston Formation. This<br />
gamma-ray response has been collectively referred to as a “broken<br />
sandstone” signature by Laughrey (1984).<br />
The porosity and permeability of the Medina Group varies due<br />
to both depositional and diagenetic processes. The deposition of<br />
mudrocks isolated sandy and silty layers of the Grimsby Sandstone<br />
and the upper Cabot Head Shale, creating permeability barriers<br />
between these reservoir rocks. Diagenesis has altered the relatively<br />
tight, primary porosity in the northern portion of the basin, creating<br />
two major types of secondary porosity, intergranular and moldic.<br />
The secondary intergranular porosity is the result of dissolution of<br />
primary calcite cement and grain edges, and moldic porosity is due<br />
to the corrosion of silica cement and dissolution of feldspar minerals<br />
(McCormac and others, 1996). However, diagenesis does not<br />
always enhance porosity in this reservoir. Secondary cementation<br />
by authigenic silica has been observed to reduce porosity, in some<br />
cases surrounding entire grains to destroy the primary porosity<br />
(Laughrey, 1984).<br />
Work performed by Laughrey (1984) in the Athens Field of Crawford<br />
County, Pennsylvania, identified several porosity types in the<br />
Medina Group, from relict, primary porosity to microporosity, intraconstituent<br />
porosity, and fracture porosity. The occurrence of fracture<br />
porosity in the Medina and equivalent units has been documented<br />
to a limited extent in other parts of the basin as well (McCormac<br />
and others, 1996). In northwestern Pennsylvania, Laughrey (1984)<br />
associated the highest porosity zones with those areas influenced by<br />
both depositional environment and diagenetic phenomena.<br />
Figure A7-5 illustrates typical porosity curves for the Medina<br />
Group in the northern part of the basin. The crossover between<br />
density porosity and neutron porosity curves is shown with light<br />
gray shading and indicates a gas effect in the porous zones in the<br />
Grimsby Sandstone, the transitional, silty sandstones of the Cabot<br />
Head Shale, and the Whirlpool Sandstone. Medina Group porosities<br />
range from 2 to 23 percent across the basin, and average 7.8 percent<br />
(McCormac and others, 1996).<br />
Medina Group permeabilities are widely variable, ranging from<br />
less than 0.1 md to 40 md (McCormac and others, 1996). In northwestern<br />
Pennsylvania, Medina permeabilities fall on the lower end<br />
of this range (Laughrey, 1984). Even so, the Perrysville Consolidated<br />
Field (Ashland County, Ohio) recorded average permeabilities of<br />
over 100 md, and isolated permeabilities of individual layers in this<br />
sequence can have permeabilities in excess of 200 md (McCormac<br />
and others, 1996).<br />
Brines in the Medina Group of Pennsylvania have salinity values<br />
ranging from approximately 95,000 to 280,000 parts per million<br />
(ppm). The primary components of these brines are calcium, sodium,<br />
and chloride, with lesser amounts of magnesium, strontium, po-<br />
Figure A7-5.—Gamma-ray and porosity geophysical log curves for the Madura #1 (API# 3708520801), a typical Medina gasproducing<br />
well in Mercer County, Pennsylvania. The gamma-ray response has been described as a “broken sandstone” signature,<br />
and the crossover of neutron porosity and density porosity curves illustrates a gas effect in the porous, gas-bearing zones of this<br />
sequence.
APPENDIX A: LOWER SILURIAN MEDINA GROUP/“CLINTON” SANDSTONE<br />
91<br />
Table A7-1.—Summary of data for “Clinton”-Medina gas storage fi elds in the Appalachian basin. Modifi ed from American Gas Association (2001)<br />
Storage Field<br />
Avg.<br />
Total Gas<br />
Max. Min.<br />
Number<br />
Max. Year Year State/<br />
/Reservoir County Thickness (Base + Working) Pressure<br />
Depth Depth<br />
of Wells Discovered Activated Province<br />
Name (ft) (MMcf) (psi)<br />
Benton Hocking, Vinton 2699 1711 10 214 24800 780 1910 1936 Ohio<br />
Chippewa Wayne 3646 3584 8 99 10557 1500 1918 1941 Ohio<br />
Crawford Hocking, Fairfi eld 2699 2048 10 150 30700 800 1895 1977 Ohio<br />
Gabor Wayne 3842 0 43 35 2805 1500 1956 1961 Ohio<br />
Holmes Holmes, Wayne 3502 2805 10 135 15700 1150 1918 1954 Ohio<br />
Laurel Hocking 2542 2031 10 177 23300 780 1901 1950 Ohio<br />
Lorain Lorain 2653 2296 10 57 10700 1150 1939 1948 Ohio<br />
Lucas Ashland, Richland 3080 2387 10 427 60400 1150 1910 1936 Ohio<br />
McArthur Vinton 2402 1924 8 97 10900 900 1916 1957 Ohio<br />
Medina Medina 3272 2930 10 68 8500 1150 1915 1958 Ohio<br />
Muskie Muskingum 3551 3431 44 8 924 1100 1966 1973 Ohio<br />
Pavonia Ashland, Richland 2956 2351 10 299 47500 1150 1910 1951 Ohio<br />
Perry Perry 2864 2759 26 22 2800 1025 1934 1956 Ohio<br />
Stark-Summit Stark-Summit 4559 3960 23 630 126220 1550 1927 1941 Ohio<br />
Wayne Ashland, Holmes, Wayne 4306 2828 10 94 16400 1150 1917 1953 Ohio<br />
Weaver Ashland, Knox, Richland 3049 2423 10 275 50500 1150 1911 1937 Ohio<br />
Wellington Lorain, Medina 3454 2172 10 181 22364 1150 1939 1947 Ohio<br />
Zane Muskingum 4150 4150 nr 1 60 1100 1941 1955 Ohio<br />
Zane Muskingum 3865 3795 53 17 2149 1100 1947 1954 Ohio<br />
Corry Erie 4539 4386 12 13 1250 1200 1947 1955 Pennsylvania<br />
TOTAL =<br />
468529
92 CHARACTERIZATION OF GEOLOGIC SEQUESTRATION OPPORTUNITIES IN THE <strong>MRCSP</strong> REGION<br />
tassium, and bromide (Dressel, 1985). In eastern Ohio, correlative<br />
“Clinton” brines range from 113,000 to 370,000 ppm, and average<br />
250,000 ppm. Like those in Pennsylvania, the primary components<br />
of these brines are sodium, calcium and chloride (Sanders, 1991).<br />
As a sequestration target, the Medina Group/ “Clinton” sandstone<br />
and the Tuscarora Sandstone are overlain by limestones, dolostones,<br />
and shales of the Clinton Group, and underlain by the Queenston<br />
Formation (Medina/”Clinton”) and Juniata Formation (Tuscarora).<br />
These units should serve as effective seals above and below the Medina<br />
target based on their lithologic and low permeability characteristics,<br />
just as they currently serve as components of the stratigraphic<br />
trapping mechanism of this reservoir. Further, the presence of extensive,<br />
mostly tight, carbonate and evaporite rocks immediately above<br />
the Clinton Group contributes to the ability of this rock sequence to<br />
prevent any vertical migration of gas out of the Medina Group.<br />
The demonstrated widespread use of this interval for gas storage<br />
and brine disposal would seem to validate, to some degree,<br />
the potential of this group for use as a CO 2 sequestration reservoir.<br />
Gas storage in depleted “Clinton” fields in Ohio was first initiated<br />
in 1936 in the Benton storage field in Hocking and Vinton counties<br />
and the Lucas storage field in Ashland and Richland counties.<br />
Currently there are 19 former, “Clinton” gas fields in Ohio that<br />
are operating as gas storage fields, and 32 wells completed in the<br />
“Clinton” sandstone are being used as injection wells in that same<br />
state to dispose of brine associated with petroleum production.<br />
Minimum depths to “Clinton” gas storage fields range from 1,711<br />
feet in Hocking County to 4,150 feet in Muskingum County. Average<br />
thickness for all “Clinton” storage fields ranges from 10 to<br />
53 feet. Maximum storage pressures range from 780 to 1,550 psi.<br />
Table A7-1 summarizes the information for the “Clinton” gas storage<br />
fields in Ohio and Pennsylvania.<br />
In Pennsylvania, only one Medina Group field has been converted<br />
to natural gas storage. The Corry storage field, situated in Wayne<br />
Township, Erie County, Pennsylvania, was discovered in 1947 and<br />
first underwent gas injection in 1955 (Lytle, 1963). The average<br />
producing depth and thickness of Medina sandstones in this field<br />
were 4,520 and 13 feet, respectively. Maximum storage pressure<br />
was reported at 1,200 psi. The total capacity of the Corry storage<br />
field is 600 million cubic feet of gas (Lytle, 1963).<br />
It should also be mentioned that the Tuscarora Sandstone contains<br />
the only commercial production of CO 2 from a natural reservoir in<br />
the Appalachian basin. The Indian Creek pool in Kanawha County,<br />
West Virginia produced natural gas with a very high CO 2 content.<br />
The CO 2 was used to attempt some small-scale EOR projects in<br />
neighboring oil pools in the 1970s and 1980s. Currently it is being<br />
used as a commercial CO 2 source for non-EOR uses. Additional<br />
data on this field and the associated EOR projects will be analyzed<br />
within the <strong>MRCSP</strong> phase II project.<br />
The Medina Group oil fields typically do not respond well to normal<br />
waterflooding for enhanced oil recovery (only seven enhanced<br />
recovery wells are in operation in Ohio). This is thought to be due to<br />
the relatively low permeability and heterogeneity of the reservoirs.<br />
However, CO 2 enhanced recovery may prove to be much more effective<br />
in these reservoirs because of the ability of CO 2 to solubilize<br />
in the native oil and brine, thereby lessening their viscosity and<br />
allowing better flow through this low-permeability, heterogeneous<br />
system. If this potential can be proven via a pilot project, a vast area<br />
of the Appalachian basin becomes available for CO 2 sequestration<br />
with the potential to produce hundreds of millions of barrels of additional<br />
oil from reservoirs of this group.<br />
In summary, the Medina Group/ “Clinton” sandstone is a potential<br />
CO 2 sequestration target that would require a certain amount of<br />
follow-up study were it chosen for a sequestration pilot project. The<br />
site-specific lithology and cementation characteristics, particularly<br />
as they relate to reservoir porosity and permeability, would need<br />
to be evaluated to determine the injectibility of this target. In addition,<br />
the relative areal extent and volume of the producing zone(s)<br />
targeted for injection would need to be determined, namely because<br />
of the discontinuity of Grimsby and Cabot Head sandy/silty lenses<br />
in the northwestern portion of the basin.<br />
8. NIAGARAN/LOCKPORT THROUGH ONONDAGA INTERVAL<br />
The Niagaran/Lockport through Onondaga Interval is a multifaceted<br />
sequence of Silurian and Devonian carbonates, clastics, and<br />
evaporites (Figure 5) that is, overall, viewed as a confining unit.<br />
However, both saline formations and oil and gas reservoirs occur<br />
as local sequestration candidates in this interval throughout the<br />
<strong>MRCSP</strong> study area.<br />
ORIGIN OF NAMES, TYPE SECTION, SIGNIFICANT<br />
EARLIER STUDIES ON THIS INTERVAL<br />
The Lockport Dolomite and its equivalents (Figure 5) are widespread<br />
throughout the region as the basal units of the Niagaran/<br />
Lockport through Onondaga interval. Hall (1839) named the Lockport<br />
for exposures of carbonate rocks at Lockport, Niagara County,<br />
New York. In the subsurface of Ohio, Kentucky, Pennsylvania, and<br />
West Virginia, the Lockport consists mostly of Middle Silurian<br />
marine dolomites, although limestones do exist in large areas; the<br />
carbonates grade eastward into the shales and sandstones of the<br />
Mifflintown and McKenzie Formations of central Pennsylvania,<br />
West Virginia, and Maryland. Lesley (1878) named the Mifflintown<br />
Formation for outcrops of calcareous sandstone on the west bank of<br />
the Juniata River near Mifflintown, Juniata County, Pennsylvania.<br />
Ulrich (1911) named the McKenzie Formation for sandy shales<br />
overlying the shale beds of the Clinton Group at McKenzie Station<br />
in Allegany County, Maryland. In central and eastern Ohio, portions<br />
of the Lockport are often referred to informally as the “Newburg,”<br />
which represents any significant porosity zone, probably associated<br />
with patch reef development, within the Lockport interval (Floto,<br />
1955; Janssens, 1977; Noger and others, 1996). Janssens (1977)<br />
treated the Lockport as a group in northwest Ohio, and subdivided<br />
it into three units, in ascending stratigraphic order: 1) Gasport Dolomite;<br />
2) Goat Island Dolomite; and 3) Guelph Dolomite. Significant<br />
production from Lockport carbonates occurs in the Appalachian<br />
basin portion of the <strong>MRCSP</strong> study area (Conrad, 1987; Smosna<br />
and others, 1989; Noger and others, 1996). The Lockport equivalent<br />
in the Michigan basin is the Niagara Group, which was originally<br />
named by Hall (1839) for essentially the same rock as the Lockport<br />
where it occurs in outcrop in the gorge of the Niagara River some<br />
miles away. Locally, the Niagara Group contains substantial reef<br />
buildups, especially in Ohio, Indiana, and Michigan. In Michigan,<br />
these reefs (called “Brown Niagaran” pinnacle reefs by the petroleum<br />
industry) represent a vast area of oil and gas reservoirs. They<br />
are described separately in this report.<br />
Overlying the Lockport Dolomite and its equivalents is the Upper<br />
Silurian Salina Group, a a lithologically mixed interval of evaporates,<br />
including halite, dolomitic carbonates, and shales that grade<br />
eastward into sandstones, shales, and thin-bedded limestones of the<br />
Bloomsburg, Wills Creek, and Tonoloway formations in Pennsyl-
APPENDIX A: NIAGARAN/LOCKPORT THROUGH ONONDAGA INTERVAL<br />
93<br />
vania, Maryland, and West Virginia (Figure 5). The Salina equivalent<br />
formation in Indiana is called the Wabash Formation. Also, a<br />
gas-productive sandstone called the “Newburg” (not related to the<br />
porous Lockport called “Newburg”) occurs between the Salina and<br />
the Lockport locally in western West Virginia and southeastern Ohio<br />
(Patchen, 1996). The Salina Group, named by Dana (1863) for occurrences<br />
of salt near Syracuse, New York, is a very important seal<br />
and confining unit within the Niagaran/Lockport through Onondaga<br />
Interval; however, there are local hydrocarbon reservoirs in the dolostones<br />
that could be used for sequestration. Salina salt has been<br />
mined in Michigan, Ohio, and northwestern West Virginia, both by<br />
relatively shallow (less than 2,000 feet) room-and-pillar mining and<br />
much deeper solution mining (Figure A8-1). White (1883) named<br />
the Bloomsburg Formation for a series of red shales in the vicinity<br />
of Bloomsburg, Columbia County, Pennsylvania. The Wills Creek<br />
Formation was named by Uhler (1905) for exposures of yellowish<br />
calcareous shales and thin sandstones along Will Creek near Cumberland,<br />
Maryland. Ulrich (1911) named the Tonoloway Formation<br />
for 400 feet of thin-bedded limestone and shale exposed on the<br />
lower slopes of Tonoloway Ridge, Washington County, Maryland.<br />
The Wabash Formation was named by Pinsak and Shaver (1964) for<br />
the “Niagaran” rocks in northern Indiana equivalent to the Salina<br />
Group (Figure 5).<br />
The Salina typically is overlain by laminated dolostones of the<br />
Bass Islands Dolomite in Michigan, Ohio, and northwestern Pennsylvania<br />
(Figure 5). The Bass Islands Dolomite was named for rocks<br />
cropping out on a group of islands in western Lake Erie by Lane and<br />
others (1909). Ulteig (1964) defined the Bass Islands as the rocks<br />
overlying the stratigraphically highest anhydrite in the Salina Group<br />
and underlying the cherty and sandy carbonates of the Middle and<br />
Lower Devonian. Janssens (1977), in a subsurface study of Silurian<br />
rocks in northwest Ohio, recognized the Bass Islands Dolomite as<br />
those rocks that overly the Salina G unit. It is a local oil and gas reservoir<br />
in Erie County, Pennsylvania, and outside the <strong>MRCSP</strong> study<br />
area in western New York where it occurs as a narrow, 84-mile-long<br />
structurally-controlled trend (Van Tyne, 1996b). The Bass Islands<br />
grades southeastward into the dolomitic limestones of the Keyser<br />
Formation, which was named by Ulrich (1911) for exposures at<br />
Keyser, West Virginia.<br />
Above the Bass Islands and its equivalents is the Helderberg<br />
Formation or Group (Figure 5), named by Conrad (1837) for the<br />
Helderberg Mountains in Albany County, New York. This formation<br />
consists of five or six units, in ascending order: 1) New Creek Limestone;<br />
2) Corriganville Limestone; 3) Mandata Shale; 4) Licking<br />
Creek Limestone; and 5) Shriver Chert, which is a facies equivalent<br />
to the Licking Creek (Head, 1969), The individual units typically<br />
are very low porosity and permeability carbonates; the Mandata<br />
Shale may be a sequestration target in western Maryland, southcentral<br />
Pennsylvania, and northeastern West Virginia. It is discussed<br />
separately in this report. In Michigan and Indiana, most, if not all of<br />
the Helderberg inverval is missing; however, a carbonaceous shale<br />
in Michigan called the Garden Island Formation (Ehlers,1945), apparently<br />
is equivalent to the Shriver/Licking Creek interval of the<br />
Appalachian basin.<br />
A major interregional unconformity, the Wallbridge unconformity,<br />
occurs on top of this part of the interval, truncating formations as<br />
low in the section as the upper Salina Group. Overlying this unconformity<br />
is the Oriskany Sandstone, a widespread gas reservoir and,<br />
often, saline formation in the Appalachian basin part of the <strong>MRCSP</strong><br />
study area (Pennsylvania, West Virginia, eastern Ohio, and eastern<br />
Kentucky) (Harper and Patchen, 1996; Opritza, 1996; Patchen and<br />
Harper, 1996). Vanuxem (1839) named the Oriskany Sandstone for<br />
exposures on the hillsides above Oriskany Falls, New York. This<br />
unit is discussed in more detail elsewhere in this report.<br />
The Oriskany Sandstone is overlain by various carbonates and<br />
clastics (Figure 5). The Bois Blanc Formation, named by Ehlers<br />
(1945), consists mostly of limestones, with some basal sandstones<br />
and siltstones, that occurs above the unconformity in Michigan,<br />
Ohio, and northwestern Pennsylvania. The basal sandstone of the<br />
Bois Blanc is called the Springvale Sandstone; it is often confused<br />
with the Oriskany Sandstone. The Bois Blanc is partly equivalent<br />
with the Huntersville Chert in western Pennsylvania and West Virginia.<br />
This formation, which was named by Price (1929) for exposures<br />
of highly silicified black shale in the vicinity of Huntersville,<br />
Pocahonta County, West Virginia, is a very important gas-producing<br />
unit in West Virginia and Pennsylvania (Flaherty, 1996). The<br />
Huntersville grades laterally to the east with the Needmore Shale<br />
in central Pennsylvania, Maryland, and eastern West Virginia. The<br />
Needmore also is discussed in more detail in this report.<br />
The Sylvania Sandstone of Michigan, northeastern Indiana,<br />
and northwestern Ohio also overlies the Bois Blanc Formation. It<br />
forms the lower portion of the Detroit River Group in this part of<br />
the <strong>MRCSP</strong> study area. The Sylvania is detailed further elsewhere<br />
in this report.<br />
The uppermost portion of the Niagaran/Lockport thru Onondaga<br />
Interval is a carbonate unit called Onondaga Limestone in Kentucky,<br />
Maryland, Pennsylvania, West Virginia, and portions of Ohio<br />
(Figure 5). Conrad (1837) named the Onondaga for gray crinoidal<br />
limestones exposed in Onondaga County, New York that at one time<br />
were called the Upper Helderberg limestone by earlier workers.<br />
Reef development in the Onondaga in New York and Pennsylvania<br />
consists of both patch reefs and pinnacle reefs. Many have been productive<br />
of both gas and condensate (Van Tyne, 1996a; Bruner and<br />
Smosna, 2002). As a result, these could provide some sequestration<br />
capability for nearby CO 2 sources. To the west, the name changes to<br />
Columbus Limestone in Ohio (named by Mather, 1859), and to Jeffersonville<br />
Limestone in Indiana (named by Kindle, 1899). This interval<br />
also correlates with the lower part of the Muscatatuck Group<br />
of Indiana, which was named by Shaver (1974) for rocks exposed in<br />
the south-central part of that state. In northwestern Ohio, northern<br />
Indiana, and Michigan, the Onondaga equivalent includes both the<br />
Amherstburg and Lucas formations (Figure 5), which consists of<br />
thick dolomitic carbonates interbedded with thick evaporites. Sherzer<br />
and Grabau (1909) named the Amherstburg Formation for the<br />
rock forming the bottom of the eastern channel of the Detroit River<br />
opposite Amherstburg, Ontario. The Lucas Formation was named<br />
by Prosser (1903) for exposures in Lucas County, Ohio. Unlike the<br />
Salina Group evaporites, the Lucas evaporites have not been extensively<br />
mined.<br />
Dennison and Head (1975), Mesolella (1978), and Smosna and<br />
Patchen (1978) provided important overviews of the Silurian and<br />
Devonian rocks of the Appalachian basin. Significant studies of the<br />
Lockport Dolomite were published by Floto (1955), Ulteig (1964),<br />
and Janssens (1977) in Ohio, by Laughery (1987) in Pennsylvania,<br />
and by Patchen and Smosna (1975) in West Virginia. Fergusson and<br />
Prather (1968), Dellwig and Evans (1969), Clifford (1973), Smosna<br />
and others (1977), and Tomastik (1997) provided a variety of information<br />
on the Salina Group in the Michigan and Appalachian basins.<br />
Details of post-Salina Group carbonates and their equivalents<br />
can be found in the following reports:<br />
Bass Islands Dolomite—Van Tyne (1996b); Janssens (1997)<br />
Helderberg Formation—Head (1969); Rickard (1984); Dorobek<br />
and Read (1986); Janssens (1997)
94 CHARACTERIZATION OF GEOLOGIC SEQUESTRATION OPPORTUNITIES IN THE <strong>MRCSP</strong> REGION<br />
EXPLANATION<br />
!(<br />
!(<br />
!(!(<br />
!(<br />
Salt Solution Well<br />
!(<br />
!(<br />
Salt Mines<br />
!(<br />
!(!(<br />
!(!(<br />
!(!(<br />
!(!(!(!(!(!(!(!(!(!(!(!(<br />
!(<br />
!(<br />
!(!(<br />
!(!(!( !(<br />
!(!( !(<br />
!(<br />
!(!(!(!(!(!(!(<br />
!(<br />
!(<br />
!(!(<br />
!(!(<br />
!( !(!(!(!(!( !(<br />
!( !(<br />
!(<br />
!(!(!(!(!(!(!(!(!(!(!(!(!(!(!(!(!( !(!(!(!(!(!(!(!(!(!(<br />
!(<br />
!(!(!(!(!(!(<br />
!(!( !(<br />
!(!(!(!(!(!(!(!(!(!(<br />
!(!(!(!(<br />
!( !(!( !(!(<br />
!(!(!( !( !( !( !(<br />
!(!( !( !(!(!(!( !( !( !(!(<br />
!(!(!(!( !(<br />
!(<br />
!(!(!(!(<br />
!(!(!(!(!(!(!(!(!(!(!(!(!(!(!(!( !(!(!(<br />
!(!(<br />
!( !(!(!(!(!(!(<br />
!(<br />
!(!(<br />
!(!(!( !(<br />
!(!( !( !( !(!(!(!(!(!(<br />
!(!(!(!(!(!(<br />
!(!(<br />
!(!(!( !(!( !(<br />
!(<br />
!(!(<br />
!(!(!(!(!( !(!(!(<br />
!( !(!( !(<br />
!( !(<br />
!(<br />
!(<br />
!(!(!( !(<br />
!( !( !(<br />
!(<br />
!(<br />
!(<br />
!(<br />
!(!(!(!(!(!(!(!(!(!(!(<br />
!(!(<br />
!( !(<br />
!(<br />
!(!( !(!(!(!(!(!(!(!( !(!(!(!(!(!(!(!(!(<br />
!(!(<br />
!(!(!(!(!(!(<br />
!( !(<br />
!(<br />
!(<br />
!(!(!(!(<br />
!( !(!(!(!(<br />
!(!(<br />
!(<br />
!(!(!(!(!(!(!(!(!(!(!(!(!(!(!(!(!(!(!(!(!(!(!(!(!(!(!(!(!(!(!(!(!(!(!(!(!(!(!(!(!(!(!(<br />
!(!(!(!(!(<br />
!(<br />
!(!(<br />
!(!(!(<br />
!(!(!(!(!(!(!(!( !(!(!(!( !(<br />
!(<br />
!(!(!(!(!(!(!(!(!(!(!(!(!(!(!(!(!(!(!(!(!(!(!(!(!(<br />
!(<br />
!(!(!(!(!(!(!(<br />
!(!(!(!(!(!(!(!(!(!(!(!(!(!(!(!(<br />
!(!(!(<br />
!(!(!(!(!(!(!( P R O J E C T<br />
!(!(!(!(<br />
!(!(!(!(!(!( !(!(<br />
!(!( !(!(!(!(<br />
!(!(!(!(!(!(!(!(!(!(!(<br />
L I M<br />
I T<br />
50 25 0 50 100 Miles<br />
50 25 0 50 100 150 Kilometers<br />
³<br />
Figure A8-1.—Map showing the location of salt solution wells (Class 3 injection wells) and the extent of major salt mines in the <strong>MRCSP</strong> region.
APPENDIX A: NIAGARAN/LOCKPORT THROUGH ONONDAGA INTERVAL<br />
95<br />
Oriskany Sandstone—Harper and Patchen (1996); Opritza (1996);<br />
Patchen and Harper (1996); Janssens (1997)<br />
Bois Blanc Formation—Summerson and Swann (1970); Janssens<br />
(1997)<br />
Sylvania Sandstone—Gardner (1974)<br />
Huntersville Chert—Weed (1982); Sherrard and Heald (1984);<br />
Flaherty (1996)<br />
Needmore Shale—Inners (1975)<br />
Onondaga Limestone—Van Tyne (1996a); Janssens (1997); Bruner<br />
and Smosna (2002)<br />
Columbus Limestone—Janssens (1997)<br />
Lucas Formation—Janssens (1997)<br />
NATURE OF LOWER AND UPPER CONTACTS<br />
Because this interval is a complex series of groups and formations,<br />
the contacts are quite variable locally. The lower contact of<br />
the entire interval is generally gradational with underlying strata,<br />
which typically are clastics (shales and some sandstones). In Ohio,<br />
where it has been examined in outcrop, the contact between the<br />
Lockport Dolomite and underlying Rochester Shale is sharp and<br />
conformable (Janssens, 1977). In other areas, such as northwestern<br />
Pennsylvania, the contact is transitional between the underlying<br />
shale and the dolostone.<br />
In most localities in the <strong>MRCSP</strong> study area, the uppermost portion<br />
of the Niagaran/Lockport through Onondaga Interval is overlain<br />
by impermeable dark-gray to black shales or carbonates of the<br />
Middle or Upper Devonian. The Middle Devonian Marcellus Formation<br />
caps the interval in the east. A regional unconformity at the<br />
boundary between the Middle and Upper Devonian (the Taghanic<br />
unconformity) separates Upper Devonian shales of the “upper”<br />
Olentangy Formation from similar lithology of the “lower” Olentangy<br />
Formation in Ohio. This contact is variably sharp, particularly<br />
where the unconformity cuts out Middle Devonian strata between<br />
the Onondaga equivalent rocks and the “upper” Olentangy, but in<br />
some cases the contact appears to be gradational. Along the flanks of<br />
the Cincinnati arch, subaerial exposure and erosion at the Taghanic<br />
unconformity progressively truncated rocks from Middle Devonian<br />
(Onondaga) to Ordovician. Subaerial exposure resulted in porosity<br />
development in some areas, and unconformity traps formed where<br />
Upper Devonian black shales were buried the unconformity surface<br />
(Meglen and Noger, 1996).<br />
LITHOLOGY<br />
Most of the strata in the Niagaran/Lockport through Onondaga<br />
Interval are carbonates, variably dolostone and limestone, with<br />
smaller amounts evaporates, and relatively minor amounts of<br />
sandstones and shales. Great thicknesses of evaporates, mostly<br />
anhydrite and halite, occur in the central Michigan basin and the<br />
northern Appalachian basin. Shale is a minor component in this<br />
interval, except in the east, in central Pennsylvania and Maryland,<br />
and northward into New York. Sandstone is important locally (i.e.,<br />
the Newburg sandstone of West Virginia and Ohio, and the Keefer<br />
Sandstone of central Pennsylvania, Maryland, and eastern West Virginia),<br />
although it typically is not very thick. The carbonate rocks<br />
vary extremely in composition, with petrophysical textures ranging<br />
from dense, laminated dolomicrites, to very porous and recrystallized<br />
grainstones. In some cases, these grainstones are dolostones or<br />
dolomitic limestones, whereas in others, they are limestones.<br />
The Lockport is a fine- to medium-crystalline, slightly argillaceous<br />
and fossiliferous dolostone that originated as a carbonate<br />
shelf deposit that contained numerous scattered patch reefs. Ooid<br />
bars, skeletal sand shoals, patch reef bioherms, lagoons, mud banks,<br />
and sabkhas were also associated with this depositional setting<br />
(Noger and others, 1996). Patch reefs consisted of corals, stromatoporoids,<br />
bryozoans, and crinoids as the primary skeletal grains.<br />
The facies change from reef to sand shoal is east to west (Smosna<br />
and others, 1989). In Ohio, the Lockport consists of a lower white<br />
to light-gray, coarsely crystalline, fossiliferous, vuggy dolostone,<br />
whereas the upper part of the formation consists of very light- to<br />
medium-brown, microcrystalline dolostone containing chert locally<br />
(Janssens, 1977).<br />
In Ohio and Michigan, the Salina Group consists of interbedded<br />
dolostone, evaporite, and shale, and is subdivided into seven<br />
units designated A through G in ascending order (Ulteig, 1964;<br />
Clifford, 1973; Janssens, 1977; Mesolella, 1978; Tomastik, 1997)<br />
(Figure A8-2). Recognition of evaporite beds on geophysical logs<br />
allows for regional subsurface correlation of these units. In Ohio,<br />
the Salina Group is present throughout most of the state, but the salt<br />
beds are restricted to the eastern third (Clifford, 1973). Unit A, the<br />
lowermost unit, is typically composed of dolostone with interbedded<br />
anhydrite and thin shale beds. Halite is present within units B,<br />
D, and F, whereas Unit C typically consists of shale. Unit G, the<br />
uppermost unit, is mainly composed of shale, but is capped with<br />
a thick anhydrite deposit that is called the Bertie Dolomite in New<br />
York. In Pennsylvania, the thickest salt beds occur in northwestern<br />
and north-central parts of the state, with bedded salt exceeding 200<br />
feet in units B and D and 400 feet in Unit F. The entire Salina Group<br />
exceeds 1,900 feet in southwestern Pennsylvania, where the rocks<br />
consist mostly of clastics and anhydrite, and greater than 2,000 feet<br />
in northeastern Pennsylvania (Fergusson and Prather, 1968). In<br />
West Virginia, the Salina and its eastern facies equivalent become<br />
thinner to the south and east from a maximum thickness of 800 feet<br />
in the northern panhandle to 300 feet in the southeastern outcrops<br />
(Smosna and Patchen, 1978). Lithologically, halite and anhydrite<br />
deposition were restricted to northwestern West Virginia; the salt<br />
basin is ringed by dolomite and limestone to the south and east.<br />
Four principal lithologies intergrade within the Wabash Formation:<br />
1) calcareous gray, dense to fine grained, and massive, silty dolostone<br />
and dolomitic silty limestone in the lower part of the formation;<br />
2) light colored, mostly finely granular, cherty but otherwise fairly<br />
pure, and slabby bedded limestone, dolomitic limestone, and dolostone<br />
in the upper part of the formation; 3) light tan to dark brown to<br />
greenish and grayish, micritic to fine-grained, generally nonfossiliferous,<br />
color banded, and thinly laminated dolostone and dolomitic<br />
limestone in the upper part of the formation; and 4) light-colored,<br />
granular, massive, vuggy, nearly pure dolostone and limestone with<br />
bluish-gray, carbonate mudstone distributed in bank, reef, reefdetrital,<br />
and biohermal facies throughout much of the formation<br />
(Indiana <strong>Geologic</strong>al Survey, 1997).<br />
In northwestern Pennsylvania and northern Ohio, the Bass Islands<br />
Dolomite consists of between 70 and 150 feet of laminated, dull,<br />
brown to buff to gray, argillaceous, micritic, dolomitic limestone<br />
and calcareous dolostone that commonly contains a pelletal, oolitic,<br />
brecciated texture (Ulteig, 1964; Fergusson and Prather, 1968). In<br />
the Michigan basin, the formation consists of 150 to 600 feet of<br />
dolostone with minor amounts of anhydrite and halite (Catacosinos<br />
and others, 2001).<br />
The Helderberg Formation (or Group) in the Appalachian basin<br />
is a mixed siliciclastic-carbonate sedimentary sequence (Dorobek<br />
and Read, 1986). It consists of four principal lithofacies: 1) light<br />
to medium gray, fine- to coarse-grained, medium to thick bedded,<br />
fossiliferous calcarenites that typically are free of chert; 2) cherty,
96 CHARACTERIZATION OF GEOLOGIC SEQUESTRATION OPPORTUNITIES IN THE <strong>MRCSP</strong> REGION<br />
fossiliferous, silt- and sand-sized grainstones, calcareous shales, and<br />
silty argillites; dark gray to black, medium bedded, cherty, silt-size<br />
grainstones with silty argillites and platy shales; and 4) terrigenous<br />
black shales interbedded with thin-bedded mudstones and calcarenites<br />
(Head, 1969). In south-central Pennsylvania, western Maryland,<br />
and northeastern West Virginia, the upper calcareous facies of the<br />
Helderberg (Licking Creek Limestone grades upward into the Oriskany<br />
Sandstone. Many drillers have difficulty separating the two,<br />
and the formational contact typically is placed at the base of the<br />
lowest arenaceous sequence.<br />
The Huntersville Chert is characterized as “variously . . . dark,<br />
noncacareous shale, carcareous silty shale, calcareous siltstone, argillaceous<br />
and silty or sandy limestone, and a subordinate amount of<br />
glauconitic or conglomeratic quartz sandstone” (Basan and others,<br />
1980, p. 42). The sandy facies contains well-rounded quartz grains<br />
where the Huntersville lies directly on the Oriskany Sandstone. Thin<br />
argillaceous sandstone beds, phosphatic nodules, and glauconite occur<br />
in the basal Huntersville as well, indicating the presence of an<br />
erosional surface on the top of the Oriskany.<br />
The Onondaga Limestone in northern Ohio consists of lightcolored,<br />
micritic to coarse-grained, sparry, fossiliferous limestone<br />
with fairly abundant chert (Janssens, 1997). The color changes to<br />
medium-gray to black to the east. The Onondaga tends to be very<br />
argillaceous in the upper portion in places where the limestone<br />
grades upward into the organic-rich shales of the Marcellus or<br />
“lower” Olentangy formations (Van Tyne, 1996a). In central and<br />
western Ohio, the Columbus Limestone is about 215 feet thick<br />
and composed of gray to bluish-gray, partly crystalline, and cherty<br />
limestone. In the Michigan basin, the Lucas Formation is a siliceous<br />
(cherty) dolostone about 35 feet thick, which makes this formation<br />
especially distinguishable from the Onondaga and Columbus<br />
limestones (Janssens, 1997). The Jeffersonville Limestone of Indiana<br />
is brown to gray, dense to crystalline, thick-bedded, dolomitic<br />
limestone typically less than 50 feet thick (Patton and Dawson, in<br />
Murray, 1955).<br />
DISCUSSION OF DEPTH AND THICKNESS RANGES<br />
Figure A8-2.—Detailed stratigraphic column and geophysical log curves of<br />
the Niagaran thru Onondaga interval from a well in Columbiana County,<br />
eastern Ohio (from Mesolella, 1978).<br />
The Niagaran/Lockport thru Onondaga Interval is relatively shallow<br />
over the arches of the region, but attains greater depths in the<br />
basins (Figure A8-3). The top of the interval is mostly below 2,000<br />
feet in the Michigan basin, whereas the base is below 8,000 feet<br />
in the deepest parts of that basin. In Indiana and western Ohio, the<br />
interval is quite shallow, straddling the Cincinnati arch and cropping<br />
out along either side of the arch. In the Appalachian basin, the top of<br />
the interval ranges from -1,000 feet along the Lake Erie shoreline,<br />
to -7,500 feet in south central Pennsylvania. The base ranges from<br />
-2,000 feet along Lake Erie to more than -10,000 feet in Somerset<br />
County, Pennsylvania (Figure A8-3). In eastern Kentucky several<br />
fields produce from this interval at depths of -2,000 to -2,500 feet,<br />
but most reservoirs, including the Big Sinking field, are shallower,<br />
with depths from -500 to -1,500 feet (Nuttall and others, 2003).<br />
The interval thickness ranges from 250 feet in eastern Kentucky<br />
and northern Indiana to more than 6,000 feet in the central part of<br />
the Michigan basin (Figure A8-4). Within the Appalachian basin,<br />
thickness increases northeastward from about 250 feet in eastern<br />
Kentucky to approximately 3,000 feet in central Pennsylvania and<br />
western Maryland. These dramatic increases in thickness result<br />
mainly from the large accumulations of carbonates and evaporites<br />
in the Salina Group.<br />
DEPOSITIONAL ENVIRONMENTS/<br />
PALEOGEOGRAPHY/TECTONISM<br />
Most of the environments represented in this heterolithic interval<br />
are normal or restricted marine facies. Intervals of evaporite deposition<br />
represent even greater restriction in local areas. The sandstones<br />
represent shallow marine or coastal settings (Smosna and Patchen,<br />
1978). The carbonate rocks, in many cases, are influenced by the<br />
basin-fringing reef belts, with shallow tidal to supratidal deposits<br />
forming behind the reef systems, and deeper subtidal accumulations<br />
forming in the basinward settings. In some settings within the<br />
deeper portions of the basins, the rocks are very fine grained and<br />
rich in shale and clay.
A<br />
APPENDIX A: NIAGARAN/LOCKPORT THROUGH ONONDAGA INTERVAL<br />
97<br />
EXPLANATION<br />
CONTOUR<br />
2500 ft Index contours<br />
500 ft contours<br />
Mean sea elevation (feet)<br />
500<br />
-6500<br />
-2500<br />
0<br />
A T<br />
S I L<br />
O U<br />
U R I<br />
T C R O<br />
O R<br />
A N<br />
P<br />
0<br />
-2500<br />
-5000<br />
I N S U F F I C I E N T D<br />
P R O J E C T<br />
O U T<br />
D O<br />
V I<br />
C R<br />
C<br />
L I<br />
I A N<br />
O P<br />
M I T<br />
-5000<br />
50 25 0 50 100 Miles<br />
³<br />
50 25 0 50 100 150 Kilometers<br />
Figure A8-3.—Structure contour map drawn on top of the Onondaga Limestone.
2000<br />
6000<br />
98 CHARACTERIZATION OF GEOLOGIC SEQUESTRATION OPPORTUNITIES IN THE <strong>MRCSP</strong> REGION<br />
EXPLANATION<br />
CONTOUR<br />
1000 ft Index contours<br />
250 ft contours<br />
Thickness in feet<br />
6000<br />
4000<br />
5000<br />
500<br />
3000<br />
1000<br />
D A<br />
T A<br />
S I L<br />
U R I<br />
A N<br />
2000<br />
N T<br />
O U<br />
T C R O<br />
P<br />
1000<br />
3000<br />
I E<br />
I C<br />
4000<br />
I N S U F F<br />
P R O J E C<br />
O R<br />
O U T<br />
D O<br />
2000<br />
V I<br />
C R<br />
C<br />
T L<br />
I A N<br />
O P<br />
I M I T<br />
50 25 0 50 100 Miles<br />
³<br />
50 25 0 50 100 150 Kilometers<br />
Figure A8-4.—Map showing the thickness of the Niagaran to Onondaga Limestone interval.
APPENDIX A: MIDDLE SILURIAN NIAGARA GROUP REEFS<br />
99<br />
SUITABILITY AS A CO 2<br />
INJECTION TARGET OR SEAL UNIT<br />
The Niagaran/Lockport through Onondaga Interval is a major<br />
confining unit for CO 2 sequestration in the <strong>MRCSP</strong> study area.<br />
Because of the thickness and combination of lithologies, it should<br />
prove to be a very effective seal. The carbonates, in general, have<br />
very low porosity and permeability, except in certain units. Similarly,<br />
the great thicknesses of evaporites within this interval have<br />
low permeabilities that should provide an effective seal against<br />
migration of fluids away from lower intervals (such as the Lower<br />
Silurian Medina Group/”Clinton” Sandstone). However, Silurian<br />
and Middle Devonian dolomitized carbonates represent noteworthy<br />
potential sequestration targets in this interval because of significant<br />
porosity development within these units. Some oil and gas fields<br />
have produced from these dolostones, and some Class II injection<br />
wells utilize them. Sandstones in the Lower and Middle Devonian<br />
(Oriskany and Sylvania) could also be important sequestration targets.<br />
The organic-rich Mandata and Needmore shales might also<br />
have potential for sequestration, but this has yet to be determined.<br />
During the <strong>MRCSP</strong> <strong>Phase</strong> I study, five potential sequestration units<br />
from this overall interval, the Niagaran Reefs, Mandata Shale, Oriskany<br />
Sandstone, Needmore Shale, and Sylvania Sandstone, were<br />
mapped separately, and each is discussed in more detail in other<br />
sections of this report. During the <strong>MRCSP</strong> <strong>Phase</strong> II investigation,<br />
we plan to devote additional study to the Lockport Dolomite and<br />
Bass Islands Dolomite, as both appear to have significant, if local,<br />
sequestration potential.<br />
The Lockport Dolomite has numerous stratigraphic and combination<br />
structural-stratigraphic traps developed in porous patch<br />
reef bioherms or skeletal sand shoals encased in impermeable<br />
argillaceous dolostone (Noger and others, 1996). Local traps also<br />
occur where porosity and permeability pinch out along the flanks<br />
of structures. Porosity development in the Lockport is controlled<br />
primarily by depositional facies and diagenetic history. Patch reef<br />
bioherms and sand shoals have average log-calculated porosities of<br />
8 to 10 percent in producing oil and gas fields, with maximum porosities<br />
as high as 14 percent (Noger and others, 1996). In addition<br />
to moldic, vuggy, interparticle, and intercrystalline porosities, fracture<br />
porosity and permeability enhance production from producing<br />
fields, and should allow for maximum sequestration of miscible CO 2<br />
fluids. Seals for trapping fluids within the formation are provided by<br />
internal impermeable mudstones and the overlying evaporites and<br />
carbonates of the Salina Group.<br />
Caverns within the Salina Group salt units in Michigan and Ohio<br />
may have potential for sequestration of CO 2. Such caverns are currently<br />
used for underground storage of natural gas liquids. In Ohio,<br />
underground storage of hydrocarbons in Salina salt deposits began in<br />
1960. Thirty wells have been permitted for hydrocarbon storage since<br />
1960, but only 11 wells have been used (Tomastik, 2001). Of these<br />
11 wells, only two wells are currently operating. The main products<br />
stored in these wells are butane and propane. There are currently two<br />
active Salina Group salt mines in Cuyahoga and Lake Counties, Ohio<br />
(Figure A8-1) at depths of approximately 2,000 feet. Salt mines in<br />
Michigan and Ohio may also represent some sequestration potential,<br />
although most are not deep enough to achieve supercritical phase.<br />
Approximately 224 salt solution-mining wells have been drilled and<br />
completed in the Salina since the late 1890s in Ohio. Two facilities<br />
with 44 active wells remain open. Depths to the Salina Group<br />
salt beds in these wells range from 1,800 to 3,150 feet (Tomastik,<br />
1997). In West Virginia, there are three solution mining areas: 1) on<br />
the Pleasants/Tyler County line; in southwestern Marshall County;<br />
and 3) in west-central Marshall County (Figure A8-1). Two of these<br />
are currently active (the northern most one in Marshall County is<br />
abandoned). Depths to the Salina range from 6,200 to 6,900 feet in<br />
these wells. One salt-solution well has been drilled in north-central<br />
Pennsylvania with the purpose of using it to store natural gas. However,<br />
solution mining of the salt cavity has not been accomplished to<br />
date because the project is currently tied up in litigation. However,<br />
the great thickness of bedded salt in north-central Pennsylvania, at<br />
depths greater than 7,500 feet, indicates the Salina Group could be a<br />
valuable injection target in this part of the <strong>MRCSP</strong> study area.<br />
The Upper Silurian Bass Islands Dolomite could also be useful<br />
for sequestering CO 2. Reservoir quality typically occurs where the<br />
dolostone is highly fractured, as in the “Bass Islands trend” of New<br />
York and Pennsylvania (Van Tyne, 1996b). Little is known about the<br />
specifics of porosity and permeability, other than gross generalizations<br />
about fracture porosity. One pool in Erie County, Pennsylvania<br />
provides most of the details on the “Bass Islands trend.” Porosity,<br />
as measured on geophysical logs, ranged from 2 to 15 percent,<br />
averaging 10 percent. Occasionally, however, the Bass Islands<br />
has potential reservoir quality outside of such fractured areas, as<br />
provided by anecdotal information. In the early 1980s, a disposal<br />
well in northwestern Pennsylvania was investigated for problems of<br />
leakage in the annulus. The disposal formation was Upper Cambrian<br />
sandstone (Rose Run), but the fluids were migrating uphole into the<br />
Bass Islands Dolomite where they spread out into the surrounding<br />
region through cavernous porosity within the dolostone. Disposal<br />
fluid was found five miles away, leaking through an old, unplugged<br />
well in Lake Erie. It is unfortunate that the Bass Islands in this area<br />
is very shallow (only 1,700 feet in the disposal well). However, investigation<br />
of the Bass Islands Dolomite at depths below 2,500 feet<br />
would prove valuable in looking for potential sequestration targets<br />
within the dolostone.<br />
9. LOWER SILURIAN NIAGARA GROUP REEFS<br />
The Niagara Group (includes Lockport Dolomite) is early Silurian<br />
(Niagaran) in age and characterized by the development of individual<br />
“pinnacle” reefs and reef complexes along two linear trends,<br />
one in the northern part of the Michigan basin, the other along the<br />
southern part of the basin. Overall, the reef belt both contain pinnacle<br />
and barrier reef complexes, is mostly in the lower peninsula<br />
of Michigan but does extend into northeastern-most Illinois and<br />
northernmost Indiana and Ohio. Individual pinnacle reefs and reef<br />
complexes (averaging 50 to 400 acres in areal extent) are numerous,<br />
extending along linear belts approximately 6 to 15-miles wide<br />
in the northern reef belt and up to 20-miles wide in the southern<br />
part of the Michigan basin. Currently, there are approximately 800<br />
pinnacle reefs and reef complexes (fields) identified in the northern<br />
trend with an additional 400 in the southern trend. Productive reef<br />
intervals range from approximately 50 to 700 feet in thickness.<br />
ORIGIN OF NAMES, TYPE SECTION, SIGNIFICANT<br />
EARLIER STUDIES ON THIS INTERVAL<br />
Hall (1840) named the Niagara for exposures in the Niagara Falls,<br />
New York region. There have been numerous studies discussing the<br />
various stratigraphic aspects of the Silurian reefs in the region (for<br />
examples, see Droste and Shaver, 1985; Shaver and Sunderman,<br />
1989; Shaver, 1991, 1996). Likewise, there have been numerous
100 CHARACTERIZATION OF GEOLOGIC SEQUESTRATION OPPORTUNITIES IN THE <strong>MRCSP</strong> REGION<br />
studies on the reservoir aspects of the reefs (for examples, see Gill<br />
and others, 1974; Gill, 1977; Sears and Lucia, 1979, 1980).<br />
NATURE OF LOWER AND UPPER CONTACTS<br />
The lower contact of the Niagara Group is gradational with the<br />
underlying Manistique Group (Figure 5). The Salina Group, a<br />
mixed interval of intercalated carbonates and evaporites overlies the<br />
Niagara Group and provides a regional seal that is highly competent<br />
(Figure A8-2). In the lower portion of the Salina Group, the A-1<br />
evaporite formation overlies the inter-reef Niagara but not the pinnacle<br />
reefs. The A-1 carbonate, A-2 evaporite and the A-2 carbonate<br />
and B salt all overlie both the inter-reef and the pinnacle reefs (Sears<br />
and Lucia, 1979).<br />
LITHOLOGY<br />
The reservoir facies consist primarily of porous and permeable<br />
dolostone, although locally primary limestone has reservoir grade porosity<br />
and permeability. Porosity is best developed in the pinnacle reef<br />
core as well as the immediate off-reef facies (fore-reef, flanking beds)<br />
and is characterized primarily by intercrystalline and vuggy pores.<br />
DISCUSSION OF DEPTH AND THICKNESS RANGES<br />
The pinnacle reefs range from 2,000 feet to more than 6,000<br />
feet deep in the Michigan basin (Figure A9-1), with the majority<br />
of reefs at depths that average approximately 3,500 to 4,500 feet.<br />
Reservoir thickness may be highly variable and ranges from a few<br />
feet to several hundred feet. An isopach map was not created for the<br />
<strong>MRCSP</strong> <strong>Phase</strong> I project due to the small, high-relief reef features<br />
that would not have been adequately illustrated by contours generated<br />
by conventional gridding algorithims at the regional scale of<br />
<strong>MRCSP</strong> mapping.<br />
DEPOSITIONAL ENVIRONMENTS/<br />
PALEOGEOGRAPHY/TECTONISM<br />
The pinnacle reefs are located along a carbonate ramp generally<br />
basinward of a shelf edge barrier reef complex. The reefs are characterized<br />
by a complex interaction of biogenic growth and physicochemical<br />
precipitation of carbonate cements. Common reef-builders<br />
include various forms of stromatoporoids and corals indicative of<br />
normal marine conditions during time of deposition. The reefs and<br />
associated facies are generally subdivided into six readily recognizable<br />
sub-facies (Gill, 1977): 1) biohermal mudmound consisting of<br />
carbonate muds and skeletal components including crinoids and<br />
bryozoans; 2) reef core consisting of a massive framework formed<br />
by stromatoporoids, corals, algae, and a variety of subordinate biotic<br />
elements combined with early submarine cements; 3) reef detritus<br />
made up of detrital fragments of the reef core and deposited along<br />
the flanks of the reef; 4) an inter-reef facies comprised of platform<br />
carbonates; 5) restricted (lagoonal) facies consisting of laminated<br />
and bioturbated, peloidal mudstones, and wackestones; and 6)<br />
supratidal/island facies consisting of algal laminated sediments and<br />
other features of high intertidal to supratidal deposition.<br />
The pinnacle reefs were deposited in a tropical to subtropical latitudinal<br />
belt. Subsequent diagenetic dolomitization has been attributed<br />
to a number of mechanisms, including mixing zone processes,<br />
Kohout convection, hypersaline reflux of brines, evaporative drawdown,<br />
and hydrothermal circulation, although most workers agree<br />
that reflux and hydrothermal processes were probably the main<br />
mechanisms (Sears and Lucia, 1980). The relationship between<br />
basin subsidence and eustatic changes at the time of pinnacle reef<br />
deposition is presently unclear; there are a number of studies investigating<br />
the relative timing of reef growth in response to relative sea<br />
level changes.<br />
SUITABILITY AS A CO 2<br />
INJECTION TARGET OR SEAL UNIT<br />
Niagaran reefs have been prolific oil-and-gas-producers After<br />
their productive life, many are converted to gas storage units due<br />
to their high porosity and permeability characteristics and effective<br />
overlying seals. Despite the fact that reservoir-grade rock is<br />
not regionally continuous, but is found in more localized reefs and<br />
reef complexes, the Niagaran reefs should be considered high-quality<br />
targets where CO 2 can be economically transported to the reef<br />
trends. Porosity values can exceed 35 percent locally but typically<br />
average 8 to 12 percent with the best porosity associated with dolomitized<br />
reef cores and flank facies. The best reservoir rocks are<br />
characterized by well-developed intercrystalline and vuggy porosity<br />
with average permeability values of 3 to 10 md. Permeability<br />
can be significantly higher where fractures intersect matrix porosity.<br />
A high-quality sealing unit is provided by the overlying Salina<br />
Group, characterized by abundant salt and anhydrite intercalated<br />
with relatively thin carbonates. Cumulative oil production through<br />
2004 was 336 million barrels of oil (MMbo) and 2.5 trillion cubic<br />
feet (Tcf) of gas, indicating the high-quality porosity and permeability<br />
available in many reefs. While individual reefs and reef<br />
complexes are localized (averaging 50 to 400 acres), they can reach<br />
up to 2,000 acres in size and have from 150 to 700 feet of vertical<br />
relief . Also, the individual reefs are clustered close together within<br />
trends. Thus, once a pipeline is brought to the trend, CO 2 injection<br />
(and enhanced oil recovery) can proceed from reef-to-reef fairly<br />
inexpensively.<br />
A number of the Niagaran reefs are used for natural gas storage<br />
operations in Michigan (Table A9-1). Such operations illustrate the<br />
integrity of the reservoirs for storage operations. The relatively<br />
small surface footprint of the reef-sand thick reservoir with large<br />
capability for storage allow relatively large volumes of gas to be<br />
cycled with few injection and withdrawal wells.<br />
There is currently a project underway to utilize CO 2 from a gasprocessing<br />
plant for enhanced oil recovery from three pinnacle<br />
reefs along the northern Michigan trend. This work is being performed<br />
with the sole purpose of oil recovery in mind, not optimal<br />
sequestration of CO 2. The existence of the pipeline infrastructure<br />
makes this area a highly attractive prospect for pilot sequestration<br />
studies. Such a study would be favorable from logistical,<br />
geotechnical, and economic standpoints, as much is known or can<br />
be established using available data on reservoir heterogeneity and<br />
compartmentalization.
-3000<br />
APPENDIX A: MIDDLE SILURIAN NIAGARA GROUP REEFS<br />
101<br />
EXPLANATION<br />
Faults<br />
500 ft contours<br />
High : 0<br />
Low : -8600<br />
-8500<br />
-8000<br />
-7500<br />
-7000<br />
-6500<br />
-6000<br />
-5500<br />
-5000<br />
-4500<br />
-4000<br />
-3500<br />
-2500<br />
-2000<br />
-500<br />
-1000<br />
-1500<br />
F A U L T S Y S T E M<br />
B O W L I N G G R E E N<br />
20 10 0 20 40 Miles<br />
20 10 0 20 40 60 Kilometers<br />
³<br />
Figure A9-1.—Generalized structure contour map drawn on the top of the Niagaran Group reefs.
102 CHARACTERIZATION OF GEOLOGIC SEQUESTRATION OPPORTUNITIES IN THE <strong>MRCSP</strong> REGION<br />
Table A9-1.—Summary of data for Niagaran gas storage fi elds in the Michigan basin. Modifi ed from American Gas Association (2001)<br />
Storage Field/ Max.<br />
Reservoir Name<br />
County<br />
Depth<br />
Min. Total Gas Maximum Avgerage Year Year<br />
Depth # Wells (Base + Working) Pressure<br />
State/Province<br />
Thickness Discovered Activated<br />
(ft) (MMcf) (psi)<br />
Central Charlton Otsego, Montmorency 5995 5472 282 9 19000 3445 1975 1982 Michigan<br />
Columbus St. Clair 3105 2669 190 17 19600 1737 1964 1972 Michigan<br />
Cortright Calhoun 3300 3160 140 2 985 1350 1972 1976 Michigan<br />
Eaton Rapids 36 Ingham, Eaton 3815 3659 125 14 16234 1928 1972 1990 Michigan<br />
Four Corners St. Clair 2421 2157 200 3 3780 1080 1966 1972 Michigan<br />
Hessen St. Clair 2757 2475 200 14 16977 1405 1965 1976 Michigan<br />
Ira St. Clair 2416 2120 220 11 6750 1220 1953 1961 Michigan<br />
Lee 11 Field Calhoun 3266 3123 143 1 780 1250 1976 1988 Michigan<br />
Lee 3 Calhoun 3380 3220 75 5 2464 1440 1972 1992 Michigan<br />
Lee 8 Calhoun 3400 3280 120 4 2200 1350 nr 1995 Michigan<br />
Lenox Macomb 2747 2556 200 6 3500 1263 1960 1965 Michigan<br />
Lyon 34 Oakland 3430 3232 200 4 1358 1635 1987 1992 Michigan<br />
Muttonville Macomb 2865 2562 194 17 13414 1575 1966 1975 Michigan<br />
Northville Reef Washtenaw 3158 2922 200 3 1420 1735 1965 1968 Michigan<br />
Partello/ Anderson Calhoun 3250 3140 75 7 4760 800 1959 1971 Michigan<br />
Puttygut St. Clair 2715 2377 200 22 14600 1140 1960 1971 Michigan<br />
Ray Macomb 3219 2905 250 44 64500 1735 1961 1966 Michigan<br />
South Chester 15 Otsego 6579 5914 287 7 19455 3675 1970 1980 Michigan<br />
Swan Creek St. Clair 2442 2241 200 1 650 1067 1967 1972 Michigan<br />
W. Columbus St. Clair 3234 2872 206 18 25900 1784 1967 1973 Michigan<br />
Washington 28 Macomb 3502 3138 198 7 11632 1419 1974 1990 Michigan<br />
Lee 2 Field Calhoun 3374 3374 200 1 806 1440 1974 1981 Michigan<br />
Collins Field St. Clair 2340 2090 107 2 2263 1100 1968 1981 Michigan<br />
Capac St. Clair, Lapeer 4821 4297 10 93 38192 2480 1961 1978 Michigan<br />
Belle River Mills St. Clair 2511 2162 205 24 76120 1475 1961 1965 Michigan<br />
Washington 10 Macomb 3460 3319 305 14 51100 1448 1969 1999 Michigan<br />
Blue Lake 18A Kalkaska 6930 6600 330 14 54119 3994 1977 1993 Michigan<br />
Coldsprings 12 Kalkaska 6790 6584 172 11 28884 3990 1973 1980 Michigan<br />
Coldsprings 31 Kalkaska 6930 6648 158 4 5302 3965 1974 1981 Michigan<br />
Excelsior 6 Kalkaska 6839 6494 250 8 12310 3956 1973 1981 Michigan<br />
Rapid River 35 Kalkaska 6736 6412 233 9 17327 4000 1973 1980 Michigan<br />
TOTAL =<br />
536382
APPENDIX A: LOWER DEVONIAN MANDATA SHALE, LOWER DEVONIAN ORISKANY SANDSTONE<br />
103<br />
10. LOWER DEVONIAN MANDATA SHALE<br />
The early Devonian Mandata Shale is a thin but extensive black<br />
shale interval within the carbonate rocks that are generally termed<br />
the Helderberg Group or Old Port Formation in central Pennsylvania,<br />
Maryland, and eastern West Virginia (Head, 1974) (Figure<br />
5). In central and south-central Pennsylvania, Maryland and West<br />
Virginia, the Mandata Shale overlies the Corriganville Limestone.<br />
The Mandata Shale has a conformable contact with the overlying<br />
Shriver Chert or Licking Creek Limestone (facies equivalents) in<br />
Pennsylvania, Maryland, and West Virginia (Head, 1969, 1974),<br />
although Dorobek and Read (1986) suggested that the Mandata is<br />
laterally equivalent to the Licking Creek in western Maryland.<br />
ORIGIN OF NAMES, TYPE SECTION, SIGNIFICANT<br />
EARLIER STUDIES ON THIS INTERVAL<br />
Swartz (1939) named the Mandata Shale for exposures 0.25 miles<br />
south of Mandata, Perry County, Pennsylvania, on the highway to<br />
Berrysburg.<br />
NATURE OF LOWER AND UPPER CONTACTS<br />
The Mandata Shale has a sharp, conformable contact with the<br />
underlying Corriganville Limestone and grades upsection into the<br />
overlying cherty shales of the Shriver Chert or the Licking Creek<br />
Limestone (Glaser, 2004) (Figure 5).<br />
LITHOLOGY<br />
The Mandata Shale is a dark gray to black, platy to thin-bed-<br />
ded, organic-rich shale. The shale is sparingly fossiliferous and in<br />
western Maryland intertongues with the Licking Creek Limestone<br />
Member of the Helderberg Group (Glaser, 2004).<br />
DISCUSSION OF DEPTH AND THICKNESS RANGES<br />
The thickness of the Mandata Shale ranges from 15 to 30 feet<br />
based on outcrops and three wells in Maryland (Edwards, 1970;<br />
Nutter and others, 1980).<br />
DEPOSITIONAL ENVIRONMENTS/<br />
PALEOGEOGRAPHY/TECTONISM<br />
The Mandata Shale represents an early Devonian deepening<br />
episode that drowned the Helderberg carbonate ramp. The ramp<br />
became sufficiently deep to preclude carbonate deposition. This<br />
deepening continued into and during the deposition of the Shriver<br />
Chert and did not again shallow until the late Gedinnian Stage with<br />
the deposition of the Oriskany Sandstone.<br />
SUITABILITY AS A CO 2<br />
INJECTION TARGET OR SEAL UNIT<br />
In Maryland, there are limited analytical data to address the<br />
Mandata’s suitability as a CO 2 sequestration target. In cooperation<br />
with the Pennsylvania and West Virginia <strong>Geologic</strong>al Surveys, this<br />
issue will be addressed in the <strong>Phase</strong> II of the <strong>MRCSP</strong>.<br />
11. LOWER DEVONIAN ORISKANY SANDSTONE<br />
The Oriskany Sandstone of drillers’ terminology (Figures 5 and<br />
All-1) actually encompasses several discrete formal stratigraphic<br />
units in the Appalachian basin (Heyman, 1977; Harper and Patchen,<br />
1996), including: 1) the type Oriskany Sandstone of New York,<br />
which also occurs in northwestern Pennsylvania and eastern Ohio;<br />
2) the Ridgeley Sandstone of Pennsylvania, Maryland, Virginia and<br />
West Virginia (where it is called Oriskany), which may or may not<br />
be identical to the type Oriskany; 3) the Springvale Sandstone, a<br />
basal sandstone member or sandy facies of the Bois Blanc Formation<br />
in Ontario, northeastern Ohio, and northwestern Pennsylvania<br />
(Oliver, 1967; Heyman, 1977); and 4) the Palmerton Formation, a<br />
sandstone in eastern Pennsylvania that is equivalent to a portion of<br />
the basal Onondaga Limestone (Sevon, 1968). The Palmerton will<br />
not be discussed further herein.<br />
ORIGIN OF NAMES, TYPE SECTION, SIGNIFICANT<br />
EARLIER STUDIES ON THIS INTERVAL<br />
The Oriskany Sandstone was named by Vanuxem (1839) for<br />
its type locality in Oriskany Falls, Oneida County, New York. At<br />
this location, the Oriskany is a white, fossiliferous quartz arenite<br />
(Opritza, 1996; Patchen and Harper, 1996). Most of the studies<br />
done on the formation before 1930 were for purposes of clarifying<br />
the stratigraphic and paleontological relationships of Lower<br />
Devonian and Upper Silurian rocks (for example, see Swartz,<br />
1913). However, since 1930, the Oriskany has become one of the<br />
more important formations for gas exploration in the Appalachian<br />
basin. As a result, the Oriskany has been the subject of numerous<br />
studies related to structure, stratigraphy, petrology, petrophysics,<br />
and other topics. The earliest studies were performed by petroleum<br />
geologists documenting the significant discoveries in south-central<br />
New York and north-central Pennsylvania in the early 1930s<br />
and 1940s (for examples, see Fettke, 1931; Torrey, 1931; Newland<br />
and Hartnagel, 1932; Bradley and Pepper, 1938; Stow, 1938; Van<br />
Petten, 1939). Subsequent studies by Finn (1949), Ebright and<br />
Ingham (1951), Young and Harnberger (1955), Wood (1960),<br />
Seilacher (1968), Heyman (1969), Patchen (1968), Jacobeen and<br />
Kanes (1974a,b), and many others added to the general knowledge<br />
of the formation and provided additional data on the various reservoir<br />
properties. A resurgence of interest in this prolific reservoir in<br />
the late 1970s and the 1980s resulted in what arguably is the most<br />
comprehensive report produced to date on the Oriskany, the exhaustive<br />
study done by Basan and others (1980). The most recent<br />
reports, in the Atlas of Major Appalachian Gas Plays (Roen and<br />
Walker, 1996), provide a summary and a single source of information<br />
garnered from earlier studies.<br />
NATURE OF LOWER AND UPPER CONTACTS<br />
The Oriskany Sandstone represents a major change during Early<br />
Devonian deposition in the Appalachian basin. The predominant<br />
carbonate sedimentation that originated in the late Silurian ceased<br />
or slowed, to be replaced temporarily by predominant clastic deposition.<br />
The Early Devonian ended with a worldwide regression<br />
that resulted in erosion throughout much of North America (the<br />
Wallbridge discontinuity of Wheeler, 1963). This discontinuity oc-
104 CHARACTERIZATION OF GEOLOGIC SEQUESTRATION OPPORTUNITIES IN THE <strong>MRCSP</strong> REGION<br />
curs at the Appalachian basin margins as an unconformity between<br />
the carbonate rocks of the Upper Silurian/lower Devonian and the<br />
Middle Devonian (Figure A11-1). Some authors, such as Wheeler<br />
(1963), described the Oriskany as a basal sandstone deposited on<br />
a basin-wide unconformity. Erosion following Oriskany deposition<br />
near the basin margins might have been more extensive than<br />
pre-Oriskany erosion—there are large areas of the basin where the<br />
Oriskany is thin or absent, for example the “Oriskany no-sand area”<br />
in northwestern Pennsylvania (Figure A11-2 and A11-3). It is also<br />
possible that such areas occur because of lack of deposition on positive<br />
paleotopographic highs. The rocks above the upper unconformity<br />
in eastern Ohio, northwestern Pennsylvania, and western New<br />
York consist of limestones and cherty limestones, often containing<br />
a basal sandstone or siltstone with “glauconite” (actually, a group<br />
of greenish clay minerals of varying composition) that typically<br />
indicate deposition on an erosional surface. This is the Springvale<br />
Sandstone member of the Bois Blanc Formation, the “Oriskany” of<br />
drillers in areas where the true Oriskany is absent.<br />
The concept that the Oriskany is everywhere bounded by unconformities<br />
is very popular, resulting in many studies showing the upper<br />
and lower surfaces of the formation to be disconformable with<br />
adjacent strata across the basin (for example, see Opritza, 1996, fig.<br />
Dop-3). However, based on core data from north-central Pennsylvania<br />
and Greenbrier County, West Virginia, the Oriskany actually lies<br />
conformably on the underlying rocks of the Helderberg throughout<br />
the main portion of the basin south and east of the cratonic margins<br />
(Heyman, 1977; Bruner, 1988). Also, in this area, the Oriskany<br />
conformably underlies black shales and cherts of the Needmore and<br />
Huntersville formations. This supports the concept by Dennison and<br />
Head (1975) of uninterrupted deposition within the central Appalachian<br />
basin throughout Early Devonian time.<br />
LITHOLOGY AND DEPOSITIONAL ENVIRONMENTS<br />
The Oriskany Sandstone typically is a pure, white, medium- to<br />
coarse-grained, monocrystalline quartz sandstone containing wellsorted,<br />
well-rounded, and tightly cemented grains (Fettke, 1931;<br />
Gaddess, 1931; Finn, 1949; Basan and others, 1980; Diecchio,<br />
1985; Foreman and Anderhalt, 1986; Harper and Patchen, 1996).<br />
Quartz and calcite comprise the most common cementing materials<br />
in the formation. In many areas of the basin, the formation contains<br />
such an abundance of calcite, both as framework grains and as cement,<br />
that the rock is classified as an arenaceous limestone.<br />
The sandstone originated in a shallow marine setting fairly early<br />
in Devonian time when one or more emergent landmasses to the<br />
north and southeast were uplifted and eroded (Harper and Patchen,<br />
1996). Although the character of the sand grains in the Oriskany<br />
indicate a mature, multicycled sediment, the specific origin of the<br />
Oriskany sand deposits remains unsettled. Dennison (1961) among<br />
others, suggested the sand originated to the southeast and spread<br />
northwestward across the basin. Stow (1938) determined that,<br />
although the sandstone in the central Appalachians (northeastern<br />
Figure A11-1.—Stratigraphic correlation chart of the Oriskany Sandstone and adjacent strata in the Appalachian<br />
basin (from Flaherty, 1996).
APPENDIX A: LOWER DEVONIAN ORISKANY SANDSTONE<br />
105<br />
N O<br />
T P<br />
R E S E N T<br />
-5000<br />
T<br />
A L L I M I<br />
( S<br />
U B C<br />
R O P )<br />
-2500<br />
-5000<br />
-2500<br />
L I M<br />
0<br />
I T O F M A<br />
P P I N G<br />
O N<br />
E R O S I<br />
-5000<br />
EXPLANATION<br />
faults<br />
2500 ft index contours<br />
500 ft contours<br />
30 15 0 30 60 Miles<br />
³<br />
30 15 0 30 60 90 Kilometers<br />
Value<br />
1000<br />
-8500<br />
Figure A11-2.—Structure contour map drawn on the top of the Oriskany Sandstrone.
106 CHARACTERIZATION OF GEOLOGIC SEQUESTRATION OPPORTUNITIES IN THE <strong>MRCSP</strong> REGION<br />
T<br />
A L L I M I<br />
( S<br />
U B C<br />
R O P )<br />
N<br />
O T P<br />
R E S E N T<br />
200<br />
L I M<br />
100<br />
I T O F M A<br />
P P I N G<br />
O N<br />
100<br />
E R O S I<br />
100<br />
EXPLANATION<br />
faults<br />
100 ft Index contours<br />
30 15 0 30 60 Miles<br />
30 15 0 30 60 90 Kilometers<br />
³<br />
50 ft contours<br />
Thickness in feet<br />
350<br />
0<br />
Figure A11-3.—Map showing the thickness of the Oriskany Sandstone.
APPENDIX A: LOWER DEVONIAN ORISKANY SANDSTONE<br />
107<br />
Pennsylvania to southeastern West Virginia) was derived from older<br />
sedimentary deposits to the southeast, in New York it was derived<br />
directly from crystalline rocks in the Adirondacks. Basan and others<br />
(1980) eventually showed that the Oriskany is very different in different<br />
areas. As a result, they suggested three possible source areas<br />
for the Oriskany: 1) the Adirondacks (as per Stow, 1938); 2) an<br />
emergent landmass on the southeastern margin of the basin; and 3)<br />
an emergent landmass in east-central Pennsylvania or New Jersey.<br />
The relative abundance of polycrystalline quartz in eastern Pennsylvania<br />
exposures, derived from a metamorphic source, provides<br />
evidence for this latter possible provenance.<br />
The depositional environments of the Oriskany are varied, but<br />
always fall within the broad category of shallow marine. Swartz<br />
(1913) proposed a high-energy beachface environment for the<br />
Oriskany in the Valley and Ridge province. Other authors have suggested<br />
nearshore, shallow water (Stow, 1938), tidal ridges and submarine<br />
dunes (Basan and others, 1980), shallow to deeper subtidal<br />
(Barrett and Isaacson, 1977), and marine shelf bar (Welsh, 1984;<br />
Bruner, 1988) environments (Figure A11-4). But, as Basan and others<br />
(1980) pointed out, even within a single outcrop or well location<br />
the Oriskany can represent one or more depositional environments.<br />
(i.e., westward and northward) to where the sandstone pinches out<br />
against overlying and underlying impermeable rocks (typically tight<br />
carbonates or shales), creating a stratigraphic trap (Opritza, 1996).<br />
Brine often is trapped between the actual sandstone pinchout and<br />
the zones or belts of gas production. Where the trapping mechanism<br />
is structural, from central-western Pennsylvania and West Virginia<br />
eastward, structural complexity increases from west to east. To the<br />
west and north, anticlinal structures with rifted cores originated<br />
through detachment in incompetent Silurian salt beds. Salt water<br />
typically occurs in the cores of these anticlines. To the east, multiple,<br />
east-dipping thrust sheets (duplexes), resulted from Alleghanian<br />
tectonic thrusting (Flaherty, 1996; Harper and Patchen, 1996).<br />
Combination traps occur in a narrow band across easternmost Ohio<br />
into western Pennsylvania and western West Virginia where moderate<br />
structures enhance trapping in updip porosity pinchout situations<br />
(Patchen and Harper, 1996). Figure A11-2 (see also Figure 6) shows<br />
the areas of structural complexity within the <strong>MRCSP</strong> study area.<br />
The few faults shown imply far more simplicity and generalization<br />
than actually occurs owing to the scale of the map. Studies of individual<br />
structures and gas fields indicate much more complexity than<br />
can be shown on a map at this scale.<br />
DEPTH AND THICKNESS RANGES<br />
The Oriskany crops out in central New York near its type locality,<br />
as well as within the complex fold belt of central Pennsylvania,<br />
western Maryland, northeastern West Virginia, and western<br />
Virginia. Based on drillers’ records, it ranges from approximately<br />
1,200 feet deep along the shore of Lake Erie in northeastern Ohio<br />
and northwestern Pennsylvania to more than 10,000 feet deep in<br />
Somerset County, Pennsylvania (Figure A11-2). Depths within the<br />
Appalachian Plateau vary greatly as a result of both a general regional<br />
southeastward dip and the occurrence of numerous anticlines<br />
paralleling the regional strike of the Valley and Ridge Province to<br />
the east.<br />
Figure A11-3 illustrates the thickness of the Oriskany Sandstone<br />
throughout the basin. Oriskany thicknesses vary within the Appalachian<br />
Plateau of eastern Ohio, western Pennsylvania, and West<br />
Virginia from 0 to over 300 feet. Adjacent to pinchout areas such<br />
as the “Oriskany no-sand area” in northwestern Pennsylvanian and<br />
along the eastern pinchout in Ohio, the reservoir sandstone typically<br />
averages between 10 and 30 feet thick (Finn, 1949; Abel and Heyman,<br />
1981, Opritza, 1996). At the pinchout, the sandstone forms<br />
a thin wedge between relatively impermeable Lower and Middle<br />
Devonian carbonates and shales. Thicker zones of Oriskany typically<br />
occur in the more structurally complex areas where thrusting<br />
and vertical repetition of beds causes apparent thicknesses much<br />
greater than 60 feet—even as much as 350 feet in western Maryland<br />
(Harper and Patchen, 1996; Patchen and Harper, 1996). The thicknesses<br />
shown in Figure A11-3 are comparable to those previously<br />
published by Diecchio and others (1983) for this unit in the northern<br />
portion of the Appalachian basin.<br />
TRAPS/STRUCTURE<br />
As a natural gas reservoir, the Oriskany is affected by three types<br />
of traps—stratigraphic (i.e., updip permeability pinchout) (Opritza,<br />
1996), structural (Harper and Patchen, 1996), and combination<br />
stratigraphic and structural (Patchen and Harper, 1996). In the areas<br />
of pinchout (Figures A11-2 and A11-3), fluids migrated updip<br />
Figure A11-4.—Interpreted environments of deposition in the Oriskany<br />
Sandstone from a well in Somerset County, Pennsylvania. Diagram based<br />
on gamma-ray log signature and core descriptions (modified from Welsh,<br />
1984).
108 CHARACTERIZATION OF GEOLOGIC SEQUESTRATION OPPORTUNITIES IN THE <strong>MRCSP</strong> REGION<br />
SUITABILITY AS A CO 2<br />
INJECTION TARGET OR SEAL UNIT<br />
The lithology of the Oriskany Sandstone, were that the only<br />
consideration for CO 2 sequestration, could be daunting. Besides the<br />
primary composition of quartz and calcite grains, minor proportions<br />
of pyrite, dolomite, and other minerals have also been observed<br />
(Harper and Patchen, 1996). Authigenic minerals include illite,<br />
chlorite, vermicular kaolinite, “glauconite,” sphalerite, and pyrite<br />
(Martens, 1939; Basan and others, 1980; Foreman and Anderhalt,<br />
1986). Cements vary—the most common are silica and calcite,<br />
but minor pyrite, dolomite, ankerite, “glauconite”, and chalcedony<br />
also occur (Basan and others, 1980). Minor authigenic clays occur<br />
as pore-filling materials, grain coats, and feldspar-alteration<br />
products. Such clays and matrix can occlude porosity and thus<br />
make the sandstone an undesireable target for sequestration. In<br />
south-central Pennsylvania, and into Maryland, Virginia, and West<br />
Virginia, the rock varies greatly in texture and composition, ranging<br />
from extremely fine-grained arenaceous limestone to coarsely conglomeratic<br />
quartz arenite (Swartz, 1913; Cleaves, 1939; Woodward,<br />
1943). Such variations inhibit easy characterization of the Oriskany<br />
for injection potential. In general, the Oriskany exhibits a coarsening-upward<br />
sequence (Patchen and Harper, 1996), but each potential<br />
injection point would have to be individually studied for sequestration<br />
potential.<br />
The Oriskany Sandstone typically is a tight rock unit except in<br />
certain areas affected by fracturing (areas of folding and faulting)<br />
or dissolution of cement (generally near pinchout areas). Porosities<br />
and permeabilities vary widely across the basin, depending on<br />
mineralogy, diagenesis, and amount of fracturing (Harper and<br />
Patchen, 1996). Intergranular porosity consists of both reduced<br />
primary porosity and secondary porosity due to dissolution of carbonate<br />
cements and some grains. While the arenaceous limestones<br />
have porosities less than five percent, zones within the arenites can<br />
have porosities greater than 20 percent where secondary porosity<br />
has been favorable (Basan and others, 1980). Opritza (1996) documented<br />
intergranular porosities of 2 to 19 percent, with averages<br />
of 7 percent, in producing gas fields along the updip permeability<br />
pinchout. In most cases, porosity in the Oriskany averages less than<br />
10 percent. Basan and others (1980) indicated that porosities determined<br />
by petrographic examination tend to be higher than those derived<br />
by evaluation of geophysical logs. Figure A11-5 shows typical<br />
gamma ray and porosity curves for the Oriskany Sandstone in the<br />
basin. The neutron-density crossover observed on the porosity logs<br />
shows a gas effect indicating that this sandstone unit is generally<br />
porous along its entire length.<br />
Fracture porosity, where it is developed, aids greatly in fluid<br />
storage within the Oriskany. Because of their greater ductility, the<br />
quartz arenites tend to have greater fracture densities than the arenaceous<br />
limestones. However, the timing of fracturing is at least as<br />
important as its occurrence. Early fractures generally healed during<br />
diagenesis, whereas late-stage fractures commonly remain open.<br />
Permeabilities in the Oriskany Sandstone range from less than 0.1<br />
to almost 30 md (Harper and Patchen, 1996). Highly fractured rocks<br />
tend to have higher permeabilities, as do rocks in which carbonate<br />
dissolution has occurred. Permeabilities are low where fractures<br />
have been healed by secondary mineralization, or where secondary<br />
dissolution of cements has been minimal. Injection of fluids, therefore,<br />
would be more favorable in areas close to an updip pinchout or<br />
along structures where fractures have not healed.<br />
The Oriskany commonly is considered to be overpressured because<br />
of initial open flow pressures in some areas of the basin as<br />
high as 4,500 psi. However, pressure/depth ratios range from 0.228<br />
to 0.742, averaging 0.441, which is essentially the normal hydrostatic<br />
pressure gradient. Russell (1972) suggested that, on average,<br />
the Oriskany is not an overpressured reservoir, and that overpressuring<br />
is more common in areas of intense deformation. Harper and<br />
Patchen (1996), however, indicate that the more highly deformed<br />
areas, such as south-central Pennsylvania, western Maryland, and<br />
eastern West Virginia, tend to have abnormally underpressured reservoirs.<br />
Pressure-depth ratios in this area range from 0.257 to 0.500<br />
with an average of 0.393. In contrast, pressure-depth ratios in the<br />
“less deformed” areas of western Pennsylvania and south-central<br />
New York range from 0.228 to 0.742, averaging 0.459. The relationship<br />
of degree of deformation to pressure gradient is not readily apparent<br />
but might be due, at least in part, to the ability of the reservoir<br />
to maintain fluids following intense fracturing.<br />
Brines in the Oriskany Sandstone typically have very high salinity<br />
values, often in the 200,000 to 350,000 ppm range, averaging<br />
about 250,000 ppm, and consist of a wealth of element concentrations<br />
(Kelley and others, 1973). The highest values are for chlorine,<br />
followed by sodium and calcium. Smaller but significant concentrations<br />
of magnesium and bromine also commonly occur.<br />
The Oriskany Sandstone has been used for the injection of industrial<br />
wastes in several wells in the basin, and for injection of natural<br />
gas for gas storage purposes in numerous depleted gas fields. One<br />
injection project, a waste disposal well in Pennsylvania, had an injection<br />
rate of about 20 gallons per minute at an intake pressure of<br />
1,400 psi during the initial investigation stage (Pennsylvania <strong>Geologic</strong>al<br />
Survey files ). The Oriskany in this well ranged from 5,250 to<br />
5,426 feet. Average porosity and permeability were 5.2 percent and<br />
2.2 md, respectively. One sample reported both the highest porosity<br />
at 4.59 percent and the highest permeability at 4.2 md. These numbers<br />
are lower than the averages reported by Opritza (1996), Harper<br />
and Patchen (1996), and Patchen and Harper (1996), but those porosities<br />
and permeabilities were for producing gas fields. The numbers<br />
would naturally be lower for areas of non-production (i.e. areas<br />
where the sandstone is tight). In order to increase the injectivity in<br />
the well, the formation was hydraulically fractured using 14,000<br />
gallons of fluid loaded with 8,500 pounds of sand at 24 barrels per<br />
minute and an injection pressure of 3,600 psi. Following fracturing,<br />
the injectivity of the formation increased to 55 gallons per minute<br />
at 1,700 psi. Initial estimates put the amount of liquid disposible in<br />
that one well at 2,555,000 gallons over the course of 50 years. These<br />
data indicate that, even in areas of low porosity and permeability, the<br />
Oriskany can be used for sequestration of fluids as long as hydraulic<br />
fracturing or acidizing is applied prior to injection.<br />
Because areas suitable for CO 2 sequestration are resticted to<br />
depths greater than 2,500 feet, the sequestration potential of the<br />
Oriskany in northeastern Ohio and northwestern Pennsylvania is<br />
limited by shallow depth. In general, the Oriskany lies at sequesterable<br />
depths starting about 15 or 20 miles southeast of the lake shore<br />
(Piotrowski and Krejewski, 1979) (Figure A11-2). East of the Allegheny<br />
front, the intense structural deformation of the Valley and<br />
Ridge Province results in numerous fault-bounded anticlines where<br />
the Oriskany crops out. Yet within the synclines and synclinoria,<br />
multi-tiered duplexes of Oriskany can lie at depths exceeding 8,000<br />
feet, making these areas suitable for sequestration.<br />
In terms of stratigraphic trapping, Harper (1990) found that updip<br />
porosity and permeability loss adjacent to the “Oriskany no-sand<br />
area” in north-central Pennsylvania occurs within one mile of the<br />
sandstone pinchout, but that favorable high porosity and permeability<br />
zones extend much farther into the basin. Opritza (1996) indicated<br />
that the zones of best porosity and permeability (best potential for
APPENDIX A: LOWER DEVONIAN ORISKANY SANDSTONE<br />
109<br />
Figure A11-5.—Geophysical log suite of the Oriskany Sandstone and associated rocks from a typical well in Leidy gas field,<br />
north-central Pennsylvania (from Harper, 1990).<br />
producing hydrocarbons) within the Oriskany lie generally within<br />
50 miles of the actual pinchout (Figures A11-2 and A11-3).<br />
The Oriskany structure map (Figure A11-2) shows the general<br />
locations of the faulted anticlines and other structural complexities<br />
known to occur within the region. In general, there are two major<br />
types of structures.<br />
In the first type, found on the Appalachian plateau, the structures<br />
resulted from thrust faults generated by the flow of incompetent<br />
rocks within the Upper Silurian Salina Group and its correlatives.<br />
At the stratigraphic level of the Oriskany Sandstone, these structures<br />
typically consist of imbricate sheets thrust over seemingly depressed<br />
cores at or near the structural axes (Figure A11-6). The anticlines<br />
commonly exhibit asymmetry resulting from one limb being steeper<br />
than the other. In most of the plateau structures, the southeastern<br />
limbs are shorter and steeper; however, the northwestern limbs are<br />
steeper and commonly overturned in structures nearer the Allegheny<br />
front (Gwinn, 1964). Flexure (subsidiary anticlines and homoclines)<br />
may be present on the thrust sheets as a result of drag. In some portions<br />
of the anticlines, the southeastern splay faults may be absent,<br />
but these are atypical of the structures as a whole. Domes that are<br />
mappable at the surface typically indicate intensification of subsurface<br />
thrusting, whereas saddles represent the boundaries between<br />
adjacent thrust sheets, possibly offset along tear faults within the<br />
zone of deformation.<br />
The second type of structure is typical of the Valley and Ridge<br />
province (the “eastern overthrust belt” of earlier studies), but has<br />
also been encountered on the Appalachian plateau close to the Allegheny<br />
Front. In the subsurface, this type of structure consists of<br />
a series of imbricate thrust sheets branching from a decollement<br />
surface typically based in the incompetent shales of the Upper<br />
Ordovician Martinsburg Formation or its equivalent (Gwinn, 1964;<br />
Jacobeen and Kanes, 1974a,b; Mitra, 1986, 1988) (Figure A11-7).<br />
In contrast, at the surface the structures consist of numerous doublyplunging,<br />
possibly en echelon, folds commonly less than 10 miles<br />
long. The few producing gas fields found on these structures are situated<br />
on thrust-faulted anticlines that generally parallel the regional<br />
structural grain (striking approximately 35 degrees northeast). At<br />
the depth of the Oriskany Sandstone (about 4,500 feet in Bedford<br />
County, Pennsylvania; deepening to about 6,500 feet in Hardy<br />
County, West Virginia), the splay faults are considerably steeper<br />
than they are at the surface, about 60 degrees or more (Wagner, in<br />
Lytle and others, 1966). Wells commonly intersect at least one thrust<br />
fault, and sometimes as many as six. Strata dip at moderate to steep<br />
angles, and early drilling in this play was difficult due to updip drift<br />
of the drill holes. According to Wagner (Lytle and others, 1966, p.<br />
46), gas well drillers followed the lead of water well drillers who<br />
purposely moved their well locations an average of 500 to 700 feet<br />
downdip of the anticipated location at total depth in order to compensate<br />
for this drift of the bore hole.<br />
Seals within Oriskany target areas generally consist of reduced<br />
porosity and permeability within the overlying and underlying rock<br />
sequences, and within the rock sequences adjacent to the reservoir<br />
across faults and fractures. Throughout most of the extent of the<br />
Oriskany Sandstone, the lower trapping mechanism results from
110 CHARACTERIZATION OF GEOLOGIC SEQUESTRATION OPPORTUNITIES IN THE <strong>MRCSP</strong> REGION<br />
Figure A11-6.—Northwest-southeast cross section of Giffin dome<br />
on Chestnut Ridge anticline in Westmoreland County, Pennsylvania<br />
(modified from Gwinn, 1964). Imbricate sheets were thrust over the<br />
depressed core as result of detachment in the Upper Silurian Salina<br />
salt beds.<br />
Figure A11-7.—Block<br />
diagram showing interpreted<br />
three-dimensional<br />
structure of the<br />
Oriskany Sandstone in<br />
the Valley and Ridge<br />
of northeastern West<br />
Virginia (from Harper<br />
and Patchen, 1996).<br />
The cutaway section<br />
aids in visually identifying<br />
separate thrust<br />
sheets and large-scale<br />
recumbent folds.
APPENDIX A: LOWER DEVONIAN ORISKANY SANDSTONE<br />
111<br />
low permeability carbonate rocks of the Helderberg Group, Keyser<br />
Formation, Bass Islands Dolomite, or even the upper carbonates of<br />
the Salina Group (Figure 5 and A11-1).<br />
The upper trapping mechanism varies. In eastern Ohio, northern<br />
Pennsylvania, and New York, the overlying rocks consist of lowpermeability<br />
carbonates of the Onondaga or Bois Blanc Formations.<br />
In the central plateau area of Pennsylvania and West Virginia, it<br />
consists of the Huntersville Chert. The Needmore Shale forms the<br />
cap in central Pennsylvania, Maryland, eastern West Virginia, and<br />
western Virgina (Figure A11-8). The Bois Blanc Formation commonly<br />
contains a basal sandstone, the Springvale Sandstone, that<br />
substitutes for Oriskany where the actual Oriskany Sandstone is<br />
absent, and often is called “Oriskany” by drillers. In those areas, the<br />
Springvale can be as porous and permeable as the Oriskany itself.<br />
The upper seal in these cases consists of the low-permeability carbonates<br />
above the Springvale. The Huntersville Chert grades eastward<br />
from a cherty limestone to a hard, massive, microcrystalline<br />
chert (Flaherty, 1996). The Needmore Shale consists of dark gray<br />
to black calcareous siltstone and shale, noncalcareous shale, and<br />
argillaceous limestone.<br />
Lateral trapping mechanisms consist of sealed faults and fractures,<br />
juxtaposed with impermeable rocks (described above) across<br />
fault planes, and permeability barriers within the sandstone as a<br />
result of non-dissolution of cement or secondary precipitation of<br />
authigenic quartz and other minerals.<br />
The largest single storage problem for sequestration of CO 2 in the<br />
Oriskany is the possibility of seal failure that would allow fluids to<br />
escape from the sequestration reservoir. In fact, Johnson and others<br />
(2004) consider cap rock integrity problems as the single most<br />
important constraint on long-term sequestration in all target storage<br />
sites. The integrity of Oriskany reservoir cap rocks and fracture<br />
seals needs to be evaluated thoroughly for mechanical and, possibly,<br />
chemical alteration potential before any pilot injection begins.<br />
Mechanical seal problems would probably be more likely to<br />
occur in areas where the structural complexity places a porous or<br />
highly fractured rock in juxtaposition (vertical or lateral) with open<br />
fractures or high porosity zones in the sandstone. For example, the<br />
overlying Huntersville Chert is highly brittle and contains many<br />
open fractures along anticlines where it has been bent and flexed.<br />
It is these fractures that make the Huntersville a seductive target<br />
for gas well drilling in the basin (Flaherty, 1996). But these fractures<br />
often extend into the Oriskany, making the Huntersville and<br />
Oriskany a single reservoir in many areas of Pennsylvania and West<br />
Virginia. In such areas, utilization of the Oriskany for CO 2-storage<br />
almost guarantees the fluids will also be injected into the Huntersville.<br />
In such cases, the Huntersville must also be evaluated for seal<br />
integrity. In addition, one or more seals could be ruptured under<br />
high injection pressures (Friedmann and Nummedal, 2003; Johnson<br />
and others, 2004).<br />
Despite the potential setbacks one can envision within this<br />
structurally complex setting, Oriskany gas storage fields have the<br />
capability to store/deliver more natural gas than storage fields in<br />
Figure A11-8.—Map showing the variations in lithology of the rocks overlying the Oriskany Sandstone (modified<br />
from Oliver and others, 1971).
112 CHARACTERIZATION OF GEOLOGIC SEQUESTRATION OPPORTUNITIES IN THE <strong>MRCSP</strong> REGION<br />
Table A11-1.—Summary of data for Oriskany Sandstone gas storage fi elds in the Appalachian basin. Modifi ed from American Gas Association (2001)<br />
Storage Field/ Max.<br />
Reservoir Name<br />
County<br />
Depth<br />
Min. Total Gas Maximum Avgerage Year Year<br />
Depth # Wells (Base + Working) Pressure<br />
State/Province<br />
Thickness Discovered Activated<br />
(ft) (MMcf) (psi)<br />
Accident Garrett 7900 7300 100 75 61978 3050 1953 1966 Maryland<br />
Columbiana Columbiana 3558 nr 6 16 3111 1450 1944 1950 Ohio<br />
Guernsey Guernsey, Coshocton 3580 3114 8 48 7100 1150 1942 1954 Ohio<br />
Artemas “A” Bedford 6095 5643 50 16 14457 2100 1962 1972 Pennsylvania<br />
Artemas “B” Bedford, Allegany 4931 4774 50 4 2147 1900 1963 1972 Pennsylvania<br />
Ellisburg Potter 5382 4889 27 84 98430 2200 1933 1963 Pennsylvania<br />
Greenlick Potter, Clinton 6860 6443 39 46 53220 4240 1955 1961 Pennsylvania<br />
Harrison Potter, Steuben 5243 4702 24 44 34100 2140 1934 1953 Pennsylvania<br />
Hebron Potter 5403 4842 18 48 29280 2200 1931 1953 Pennsylvania<br />
Leidy Clinton, Potter 6609 5605 22 64 102003 4200 1950 1959 Pennsylvania<br />
Meeker Tioga 4307 4135 5 3 5200 1680 1931 1943 Pennsylvania<br />
Palmer Tioga 4320 3987 5 13 16000 1680 1930 1938 Pennsylvania<br />
Sabinsville Tioga 4951 4171 23 41 35618 2130 1935 1951 Pennsylvania<br />
Sharon Potter 4979 4642 17 12 4500 860 1938 1948 Pennsylvania<br />
Summit Erie 2450 2279 20 45 4200 800 1946 1959 Pennsylvania<br />
Tamarack Clinton 7159 6740 40 11 11220 4200 1952 1971 Pennsylvania<br />
Tioga Tioga 4128 3679 24 31 36000 1680 1930 1951 Pennsylvania<br />
Wharton Potter, Cameron 6552 5371 19 71 31668 3600 1933 1963 Pennsylvania<br />
Augusta Hampshire 5749 4806 147 6 6961 2797 1953 1971 West Virginia<br />
Coco “A” Kanawha 6761 4955 20 74 44500 1800 1944 1950 West Virginia<br />
Coco “B” Kanawha 5446 5041 20 20 9700 1800 1944 1951 West Virginia<br />
Coco “C” Kanawha 5556 5094 20 27 17270 1800 1944 1957 West Virginia<br />
Hunt Kanawha 5386 5027 20 19 5839 1200 1947 1951 West Virginia<br />
Little Capon Hampshire 5761 5243 150 6 7451 2804 1965 1971 West Virginia<br />
Ripley Jackson 5184 4777 20 49 25050 1675 1945 1954 West Virginia<br />
Rockport Wirt; Wood 5401 4855 20 25 8160 1800 1948 1953 West Virginia<br />
Blackhawk Beaver 4673 4660 10 7 2655 2000 1936 1969 Pennsylvania<br />
North Summit Fayette 7145 6394 168 22 21851 3000 1937 1991 Pennsylvania<br />
Glady Randolph, Pocahontas 6930 4914 150 49 31200 2050 1954 1964 West Virginia<br />
Terra Alta Preston 6227 4676 150 32 41663 2350 1946 1960 West Virginia<br />
Terra Alta South Preston 6582 4954 150 30 16600 2350 1953 1970 West Virginia<br />
Rager Mtn. Cambria 8045 7680 42 7 20493 3200 1965 1971 Pennsylvania<br />
TOTAL =<br />
809625
APPENDIX A: LOWER DEVONIAN SYLVANIA SANDSTONE<br />
113<br />
any other formations within the northern Appalachian basin (AGA,<br />
2001). At least 32 gas storage fields are found within the Oriskany,<br />
with a combined storage capacity of nearly 1 TCF, and located in<br />
pinchout, stratigraphic, and structural traps (Table A11-1). Many of<br />
these storage fields have been in operation since the 1950s, attesting<br />
to the integrity of the fields and seals.<br />
In all likelihood the Oriskany Sandstone would make a suitable<br />
target for storage of CO 2-miscible fluids, but only after thorough<br />
evaluation of the formation at potential target sites. Such target sites<br />
include: 1) zones of high porosity and high permeability associated<br />
with updip sandstone pinchout, typical of eastern Ohio, and along<br />
the southern and eastern boundaries of the “Oriskany no-sand area”<br />
in northwestern Pennsylvania; 2) areas of highly fractured Oriskany<br />
Sandstone associated with salt solution and migration within<br />
the central depositional area of western Pennsylvania and central<br />
West Virginia; and 3) areas of intensely faulted and multi-tiered<br />
(duplexed) Oriskany Sandstone in the Valley and Ridge of central<br />
Pennsylvania, western Maryland, and eastern West Virginia.<br />
12. LOWER DEVONIAN SYLVANIA SANDSTONE<br />
The Sylvania Sandstone, late Early Devonian in age, is a<br />
quartzose sandstone that grades laterally into sandy limestone<br />
and dolostone in parts of the Michigan basin. The Sylvania is the<br />
basal formation of the Detroit River Group and, along with the<br />
Bois Blanc and Garden Island Formations, overlie the Kaskaskia<br />
unconformity (Figure 5). Gardner (1974) suggests the lower part of<br />
the Sylvania may be in facies relationship with the underlying Bois<br />
Blanc, especially in northern and western regions of the Michigan<br />
basin. However, the relationship of this lower contact is poorly<br />
documented, and the recent revision of the Michigan stratigraphic<br />
column by the Michigan <strong>Geologic</strong>al Survey shows an unconformity<br />
between the Sylvania and Bois Blanc Formations. The upper<br />
part of the Sylvania intertongues with carbonates of the overlying<br />
Amherstburg Formation, another unit in the Detroit River Group.<br />
Although arenaceous units are present at various stratigraphic<br />
positions above the Kaskaskia unconformity in Michigan, as well<br />
as in the Appalachian basin portion of the <strong>MRCSP</strong> study area—for<br />
example the Oriskany Sandstone in Ohio, Pennsylvania, and West<br />
Virginia—use of the name Sylvania Sandstone should be restricted<br />
to the sandstone that occurs at the base of the Detroit River Group in<br />
the Michigan basin (Fisher and others, 1988). In general, details on<br />
the vertical and lateral stratigraphic relationships of the Sylvania, its<br />
internal lithologic variations, and those attributes making it suitable<br />
as a geologic reservoir for CO 2 sequestration, are uncertain for most<br />
of the Michigan basin.<br />
ORIGIN OF NAMES, TYPE SECTION,<br />
SIGNIFICANT EARLIER STUDIES<br />
Orton (1888) applied the name Sylvania Sandstone to exposures,<br />
incorrectly identified as Oriskany by Newberry (1871),<br />
in Sylvania Township, Lucas County, Ohio. Other significant<br />
investigations on the Sylvania include Grabau and Sherzer (1910),<br />
Alty (1933), Carman (1936), and Hatfield and others (1968). Also,<br />
Gardner (1974), as part of a detailed subsurface study, presented<br />
regional isopach and lithofacies maps of the Sylvania Sandstone<br />
in Michigan.<br />
NATURE OF LOWER AND UPPER CONTACTS<br />
The Sylvania Sandstone overlies the Kaskaskia unconformity<br />
in southeastern Michigan above the truncated Silurian-age Bass<br />
Islands Group. The Sylvania is thin, discontinuous, or completely<br />
absent in some areas, especially on the southern and western margins<br />
of the Michigan basin. Typically the Bois Blanc underlies<br />
the Sylvania although the exact stratigraphic relationship between<br />
these two units is unclear. The lateral extent and isopach pattern of<br />
the Sylvania Sandstone (Figure A12-1) and Bois Blanc Formation<br />
suggests a northwest- to southeast-trending shallow marine basin<br />
existed in the area at the time of deposition of the Sylvania (Gardner,<br />
1974). This basin may be related to the trend of the Mid-Michigan<br />
rift (Figure 6). The Sylvania Sandstone is the basal unit of the Detroit<br />
River Group; its upper contact with the overlying Amherstburg<br />
Formation is gradational and intertonguing.<br />
LITHOLOGY<br />
Regional lithologic variations within the Sylvania Sandstone<br />
are known mainly from the analysis of geophysical logs (Gardner,<br />
1974). These analyses suggest the Sylvania Sandstone typically<br />
consists of dolomitic to cherty, fine- to medium-grained, well-sorted<br />
and rounded, quartzose sandstone in central and southeastern lower<br />
Michigan but grades into cherty, sandy carbonate in other regions<br />
of the Michigan basin. Carbonate interbeds, sometimes containing<br />
chert, are common throughout the unit. The Sylvania, in general, is<br />
very porous in outcrops and in materials recovered from shallow<br />
subsurface cores and exploratory drill holes, particularly in southeastern<br />
lower Michigan. Locally, quartz overgrowths and carbonate<br />
cement are present in the unit. Most quartz sand grains of the Sylvania<br />
are frosted and pitted. Marine fossils, mainly brachiopods, are<br />
common in many of the calcareous interbeds. Cross beds and other<br />
current-induced sedimentary structures are common in outcrops but<br />
rarely observed in cores.<br />
DISCUSSION OF DEPTH AND THICKNESS RANGES<br />
The Sylvania Sandstone ranges from just a few feet thick in<br />
northeastern and southwestern areas of the Michigan basin to a maximum<br />
thickness of about 350 feet; the area of maximum thickness<br />
occurs mostly along a northwest- to southeast-trending belt across<br />
the central portion of the basin (Figure A12-1). These thickness<br />
estimates are based on geophysical log picks but are problematic<br />
due to the complex lithologic variations above, below, and within<br />
the geologic interval containing the Sylvania. As previously noted,<br />
the northwest- to southeast-oriented isopach pattern is similar to the<br />
underlying Bois Blanc Formation, suggesting a similar depositional<br />
and structural setting for both units. Moreover, the area of maximum<br />
thickness of the Sylvania closely mimics the eastern margin of the<br />
Mid-Michigan rift, a feature interpreted as a pre-Paleozoic age failed<br />
continental rift. Structural movement resulting from reactivation of<br />
parts of the rift may have influenced depositional trends within the<br />
Sylvania. These structures may have created basin topography/bathymetry<br />
that existed during the transgressive phase of Lower and<br />
Middle Devonian sediments that were deposited on top of the Kaskaskia<br />
unconformity. The Sylvania Sandstone ranges in depth from<br />
in excess of 400 feet above sea level in the southeastern corner of<br />
the state to over 4,400 feet below sea level in the central portion of<br />
the basin (Figure A12-2).
100<br />
114 CHARACTERIZATION OF GEOLOGIC SEQUESTRATION OPPORTUNITIES IN THE <strong>MRCSP</strong> REGION<br />
EXPLANATION<br />
50 ft contours<br />
Thickness in feet<br />
300<br />
0<br />
150<br />
200<br />
300<br />
250<br />
200<br />
150<br />
50<br />
50<br />
50<br />
20 10 0 20 40 Miles<br />
2010 0 20 40 60 Kilometers<br />
³<br />
Figure A12-1.—Map showing the thickness of the Sylvania Sandstone.
-2000<br />
APPENDIX A: LOWER DEVONIAN SYLVANIA SANDSTONE<br />
115<br />
EXPLANATION<br />
200 ft contours<br />
1000 ft Index contours<br />
Mean sea elevation (feet)<br />
-1000<br />
400<br />
-3000<br />
-4400<br />
-4000<br />
-4400<br />
-4000<br />
-3000<br />
-2000<br />
-1000<br />
0<br />
400<br />
20 10 0 20 40 Miles<br />
2010 0 20 40 60 Kilometers<br />
³<br />
Figure A12-2.—Structure contour map drawn on the top of the Sylvania Sandstone.
116 CHARACTERIZATION OF GEOLOGIC SEQUESTRATION OPPORTUNITIES IN THE <strong>MRCSP</strong> REGION<br />
DEPOSITIONAL ENVIRONMENTS/<br />
PALEOGEOGRAPHY/TECTONISM<br />
The Sylvania Sandstone represents the initial transgressive phase<br />
of an extensive Devonian-age carbonate sequence—the Detroit<br />
River Group—that was deposited over the regionally extensive<br />
Kaskaskia unconformity. The rounded and frosted quartz grains,<br />
common in many parts of the Sylvania, are characteristic of sand deposited<br />
in eolian environments or at least sand reworked from older<br />
eolian rocks. However, the presence of marine fossils and interbeds<br />
of sandstone within adjacent carbonates suggest a predominantly,<br />
if not entirely, shallow marine environment. Hatfield and others<br />
(1968) concluded the Sylvania was most likely a beach deposit that<br />
formed during a eustatic transgression.<br />
SUITABILITY AS A CO 2<br />
INJECTION TARGET OR SEAL UNIT<br />
The sandstone-dominated facies of the Sylvania Sandstone, best<br />
developed in central and southeastern lower Michigan, have been<br />
used for Class 2 waste-disposal wells and is also a major source for<br />
brine in industrial-mineral wells for the chemical industry in Midland<br />
County (Fisher and others, 1988). Porosity and horizontal permeability<br />
measurements from 24 sidewall-core samples from the Sylvania,<br />
collected in a well in southeastern lower Michigan, ranged from 1<br />
to 28 percent porosity with an average of 16.6 percent. Permeability<br />
measurements ranged from 0 to 388 md with an average of nearly 100<br />
md. These measurements are consistent with porosity and permeability<br />
characteristics presented herein. The primary doubts concerning<br />
the suitability of the Sylvania for CO 2 injection centers mostly on the<br />
unknown variability of the lithofacies and their distribution throughout<br />
the Michigan basin. Subsurface analysis of general lithofacies<br />
patterns indicates the sandstone-dominated facies in southeastern and<br />
central areas of the Michigan basin are replaced by mainly cherty<br />
carbonate facies in other regions. The chert-dominated lithofacies is<br />
likely to be porous, and also tripolitic, thereby significantly affecting<br />
the injectivity potential of the unit. Thus, a more detailed analysis of<br />
variations of the internal facies and rock properties of the Sylvania<br />
warrant additional investigation in order to further understand the<br />
CO 2 sequestration potential of the unit. In the central portion of the<br />
Michigan basin, the geologically older and potential sequestration<br />
reservoirs of the Mt. Simon and St. Peter Sandstones are very deep<br />
(thus expensive to drill). This great depth may not be advantageous<br />
for the occurrence of zones of high porosity and permeability for<br />
injection of CO 2 within these older units. In contrast, the Sylvania<br />
in much of this same central basin area is fairly thick and occurs at<br />
a moderate depth that may be more favorable for development of<br />
porosity and permeability ample for CO 2 sequestration.<br />
The Amherstburg Formation, a complex succession of evaporites<br />
and carbonates in the Detroit River Group, everywhere overlies the<br />
Sylvania Sandstone. Gardner (1974) suggests the continuity and<br />
integrity of Amherstburg Formation is variable; thus, its ability to<br />
function as a seal for the Sylvania in the Michigan basin is undetermined.<br />
However, overlying the Amherstburg are evaporates of<br />
the Lucas Formation, the Dundee Limestone, the Traverse Group<br />
(shale and limestone), and the Antrim Shale. This combined package<br />
should provide an adequate seal to insure integrity to Sylvania<br />
Sandstone injection reservoirs.<br />
13. LOWER/MIDDLE DEVONIAN NEEDMORE SHALE<br />
The Needmore Shale is present throughout western Maryland,<br />
south-central Pennsylvania, and eastern West Virginia; the upper<br />
part of the Needmore is laterally equivalent to the Onondaga Limestone<br />
in northern Pennsylvania and New York, and to the Huntersville<br />
Chert in western Pennsylvania and West Virginia (Figure 5).<br />
The Needmore Shale is underlain by the Early Devonian Oriskany<br />
Sandstone and overlain by the Middle Devonian Onondaga Limestone,<br />
Huntersville Chert, or Tioga Bentonite, depending upon the<br />
location within the Appalachian basin.<br />
Conodont biostratigraphy indicates that the Needmore Shale is of<br />
Early and earliest Middle Devonian age. Conodonts from the overlying<br />
Tioga Ash Bed suggest that the top of the Needmore is within<br />
the Polygnathus costatus costatus Zone of Middle Devonian age.<br />
(Harris and others, 1994)<br />
ORIGIN OF NAMES, TYPE SECTION, SIGNIFICANT<br />
EARLIER STUDIES ON THIS INTERVAL<br />
The Needmore Shale is named for exposures in southern Fulton<br />
County, Pennsylvania (Willard and Cleaves, 1939). The name was<br />
extended into Maryland, Virginia, and West Virginia by Woodward<br />
(1943). This unit was later assigned as a member of the Romney<br />
Shale (Lesure, 1957) and the Onondaga Formation, but currently is<br />
formational in status.<br />
NATURE OF LOWER AND UPPER CONTACTS<br />
The contact between the Needmore Shale and the underlying<br />
Oriskany Sandstone is sharp and unconformable, representing either<br />
a transgressive surface or a transgressive surface/unconformity<br />
converged (G.R. Baum, personal communication, 2005). The<br />
Needmore Shale grades laterally into the Huntersville Chert and,<br />
upsection, into dark gray, argillaceous limestones of the Onondaga<br />
Limestone. In the absence of the Huntersville Chert and the Onondaga<br />
Limestone facies, there is a 10- to 15-foot interval of coarse,<br />
brown shale mixed with considerable volcanic ash termed the Tioga<br />
Bentonite at the top of the Needmore Shale.<br />
LITHOLOGY<br />
The Needmore Shale is a dense, fissile, dark olive-gray to black,<br />
calcareous shale with dark gray interbeds of thin-bedded and nodular,<br />
fossiliferous, argillaceous limestone. Dark gray volcanic tuffs<br />
and ash beds occur at the top of the formation (Glaser, 2004).<br />
Over most of western Maryland, the upper half of the unit is thickly<br />
laminated shale containing nodules and thin beds of limestone.<br />
Similar shale without limestone makes up the lower portion of the<br />
Needmore Shale, grading at the base to dark fissile non-calcareous<br />
shale. In outcrop, the coarser shale and mudrock disintegrate rapidly<br />
to pale-olive or tan chips or irregular clasts, whereas the black shale<br />
weathers to thin grayish-white plates and papery flakes much like<br />
the Marcellus Shale (Glaser, 2004).<br />
DISCUSSION OF DEPTH AND THICKNESS RANGES<br />
Based on well log picks and published reports for Maryland,<br />
the thickness of the Needmore Shale ranges from 3 to 190 feet<br />
(Edwards, 1970; Nutter and others, 1980). The unit thickens from<br />
northwest to the southeast (Figure A13-1). Depth to the top of<br />
the Needmore varies from a minimum of about 1,000 feet below
25<br />
APPENDIX A: LOWER/MIDDLE DEVONIAN NEEDMORE SHALE<br />
117<br />
EXPLANATION<br />
25 ft contours<br />
Thickness in feet<br />
15<br />
25<br />
25<br />
Pennsylvania<br />
25<br />
Maryland<br />
West Virginia<br />
50<br />
75<br />
100<br />
25<br />
150<br />
125<br />
125<br />
10 5 0 10 20 Miles<br />
³<br />
10 5 0 10 20 30 Kilometers<br />
Figure A13-1.—Map showing the thickness of the Needmore shale.
118 CHARACTERIZATION OF GEOLOGIC SEQUESTRATION OPPORTUNITIES IN THE <strong>MRCSP</strong> REGION<br />
sea level in the southeasternmost tip of Maryland panhandle to<br />
-7,500 feet in the central portion of the panhandle (Figure A13-2).<br />
The depth varies in a series of deep troughs and shallow highs in<br />
northeast-southwest trending bands following the folding of the Appalachian<br />
mountains.<br />
DEPOSITIONAL ENVIRONMENTS/<br />
PALEOGEOGRAPHY/TECTONISM<br />
The Needmore Shale is a marine foreland basin shale formed at a<br />
near-equatorial latitude in the center of the Appalachian basin during<br />
the downwarping associated with the first tectonophase of the<br />
Acadian orogenic episode (VanTyne, 1996).<br />
SUITABILITY AS A CO 2<br />
INJECTION TARGET OR SEAL UNIT<br />
Within the state of Maryland, there are limited analytical data to<br />
address the suitability as a CO 2 sequestration target. In cooperation<br />
with the Pennsylvania and West Virginia <strong>Geologic</strong>al Surveys, this<br />
issue will be addressed in <strong>Phase</strong> II of the <strong>MRCSP</strong>.<br />
EXPLANATION<br />
Value<br />
500 ft contours<br />
-1000<br />
-7500<br />
-6000<br />
Pennsylvania<br />
Maryland<br />
West Virginia<br />
-3500<br />
-7000<br />
-4500<br />
-2000<br />
-6000<br />
10 5 0 10 20 Miles<br />
³<br />
10 5 0 10 20 30 Kilometers<br />
Figure A13-2.—Structure contour map drawn on the top of the Needmore shale.
APPENDIX A: DEVONIAN ORGANIC-RICH SHALES<br />
119<br />
14. DEVONIAN ORGANIC-RICH SHALES<br />
A very complex sequence of mudstones of Middle and Late Devonian<br />
age occurs in both the Appalachian and Michigan basins.<br />
In the western two-thirds of the <strong>MRCSP</strong> study area, these shales<br />
are primarily known as the Ohio, Chagrin, or Antrim Shales. In<br />
the eastern third of the area—the Appalachian basin of Maryland,<br />
Pennsylvania, and West Virginia—the shales have an array of names<br />
such as Millboro, Marcellus, Harrell, Brallier, Genesee, Sonyea, and<br />
Rhinestreet, to name the most important (Figure 5).<br />
The Ohio Shale members with the highest organic content and<br />
the most widespread occurrence in the Appalachian basin are the<br />
Cleveland and Huron Members shales (Figure A14-1). In general<br />
the lower-most portion of the overall Ohio Shale is black organicrich<br />
shale, which grades upward and eastward into dominantly gray,<br />
silty shale in areas of thicker accumulation in the Appalachian basin.<br />
In other areas, broad regional structural arches controlled stratigraphy<br />
resulting in thinner, but overall dominant, black organic-rich<br />
shale. Correlative shales include the New Albany Shale of the Illinois<br />
basin and the Chattanooga Shale of the southern part of the<br />
Appalachian basin.<br />
In the Michigan basin, there are three formal members and one<br />
informal member of the Antrim Shale, the Lachine, Paxton, and<br />
Norwood Members, and an unnamed upper member (Gutschick and<br />
Sandberg, 1991). The Paxton Member is a gray calcareous shale. All<br />
the other units are black shale with varying organic content.<br />
ORIGIN OF NAMES, TYPE SECTION, SIGNIFICANT<br />
EARLIER STUDIES ON THIS INTERVAL<br />
Nomenclature of the shale interval varies widely within the<br />
<strong>MRCSP</strong> study area from north to south and west to east, based<br />
primarily on the recognition of black, carbonaceous units with<br />
generally high gamma-ray response. Stratigraphic studies of Devonian<br />
shales are often based on the occurrence of volcanic ash beds,<br />
siltstones, and Foerstia and Tasmanites (algal megaspores) zones.<br />
Figure A14-1 is a correlation chart of the major Devonian shale<br />
units in the Appalachian basin. Table A14-1 lists the major units,<br />
the original reference, and type section. The reader is also referred<br />
to de Witt, 1993 as a good overview of Devonian shale stratigraphy<br />
for the Appalachian basin. Extensively studies on Devonian shales<br />
have occurred by many workers since in the 1800s; thus, no attempt<br />
was made to trace the various stratigraphic revisions or changes in<br />
unit correlations for this interval in the <strong>MRCSP</strong> region.<br />
Much of the research on the Devonian-age shales of the eastern<br />
United States was performed by the state geological surveys and<br />
directed by the U.S. Department of Energy as part of the Eastern<br />
Gas Shales Project from 1976 to 1981. Also, studies by the U.S.<br />
<strong>Geologic</strong>al Survey and investigations sponsored by the Gas Research<br />
Institute (now Gas Technology Institute) of Chicago, Illinois,<br />
have greatly contributed to the understanding of these Devonian<br />
organic-rich, gas-bearing rocks. A few of the more recent studies of<br />
significances include work by Decker and others (1992), Roen and<br />
Kepferle (1993), Boswell (1996), Milici (1996), and Ryder (1996).<br />
NATURE OF LOWER AND UPPER CONTACTS<br />
Within the Appalachian basin portion of the <strong>MRCSP</strong> study area,<br />
Devonian shales unconformably and conformably overlie carbonates<br />
or shales of Upper Silurian or Lower or Middle Devonian age.<br />
Figure A14-1.—General stratigraphic nomenclature for the Middle and Upper Devonian black shales in the Appalachian basin.<br />
Organic shales are shaded black. F = Foerstia Zone. Black triangles indicate major ash beds. Redrawn from de Witt and others<br />
(1993). See also Roen and Kepferle, 1993, Plate 2, cross section A-A'.
120 CHARACTERIZATION OF GEOLOGIC SEQUESTRATION OPPORTUNITIES IN THE <strong>MRCSP</strong> REGION<br />
Table A14-1.—Nomenclature of primary shale units<br />
Unit<br />
Reference<br />
Antrim Shale<br />
A.C. Lane, 1901, Michigan Mineralogy, vol 3., no. 1, p. 9. Named for<br />
exposures in Antrim County, northwestern Lower Peninsula, Michigan.<br />
Chagrin Shale<br />
C.S. Prosser, 1903, Journal of Geology, vol. 11, p. 521 (replaced the<br />
Erie Shale, underlying the Cleveland Shale and overlying the Huron<br />
Shale. Named for the Chagrin River, Cuyahoga County, Ohio.<br />
Chattanooga Shale C.S. Hayes, 1891, <strong>Geologic</strong>al Society of America Bulletin, vol. 2, p.<br />
143. Named for Chattanooga, Tennessee.<br />
Cleveland Shale Member of the Ohio Shale<br />
J.S. Newberry, 1870, Ohio <strong>Geologic</strong>al Survey <strong>Report</strong> of Progress,<br />
1869, p. 19,21. Named for exposures near Cleveland, Ohio.<br />
Huron Shale Member of the Ohio Shale<br />
J.S. Newberry, 1870, Ohio <strong>Geologic</strong>al Survey <strong>Report</strong> of Progress,<br />
1869, p. 18. Named for exposures on the Huron River, Huron and Erie<br />
Counties, northern Ohio.<br />
Ohio Shale<br />
E.B. Andrews, 1870, Ohio <strong>Geologic</strong>al Survey <strong>Report</strong> of Progress<br />
1869, p. 62. Named for the Ohio River hills in north-central Kentucky<br />
and Ohio.<br />
Dunkirk Shale Member of the Ohio Shale J.M. Clarke, 1903, New York State Museum Handbook 19, p. 24.<br />
Named for exposures on Lake Erie at Dunkirk, Chautauqua County,<br />
New York.<br />
Rhinestreet Shale Member of the West Falls Formation J.M. Clarke, 1903, New York State Museum Handbook 19, p. 23.<br />
Named for exposures along Rhinestreet, north from Naples, Ontario<br />
County, New York.<br />
Middlesex Shale Member of the Sonyea Formation J.M. Clarke, 1903, New York State Museum Handbook 19, p. 23.<br />
Named for abundant exposures in the town of Middlesex, Yates<br />
County, New York.<br />
Geneseo Shale Member of the Genesee Formation G. H. Chadwick, 1920, <strong>Geologic</strong>al Society of America Bulletin, v. 31,<br />
p. 118. Named for exposures in Geneseo, Livingston County, New<br />
York.<br />
Burket Shale Member of the Harrell Shale C. Butts, 1918, American Journal of Science, 4 th ser., v. 46, p. 523,<br />
526. Named for black fi ssile shale exposed at Burket, Blair County,<br />
Pennsylvania.<br />
Marcellus Formation J. Hall, 1839, New York <strong>Geologic</strong>al Survey, 3 rd <strong>Report</strong>, p. 295-296.<br />
Named for exposures at Marcellus, Onondaga County, New York.<br />
The lower contact is typically sharp above carbonates to gradational<br />
above shales, and straightforward on geophysical logs. Minor to<br />
moderate topographic relief was developed on this surface in the<br />
western part of the basin prior to deposition of the shales. The uppermost<br />
Devonian Berea Sandstone and equivalent Bedford Shale<br />
generally conformably overlie the Upper Devonian shales in the<br />
western part of the Appalachian basin. In the eastern portion of the<br />
basin, the shales are overlain by thick sequences of Upper Devonian<br />
sandstones and interbedded shale (Figure 5).<br />
In the Michigan basin, the Antrim Shale gradationally overlies<br />
carbonates of the Middle Devonian-age Traverse Group and is overlain<br />
by the Upper Devonian-age Bedford Shale, Berea Sandstone or<br />
the Ellsworth Shale. The upper contact is highly variable across the<br />
region and typically indistinguishable and arbitrary in the absence<br />
of well-developed black shale. A lateral facies relationship exists between<br />
the upper unnamed member of the Antrim and the Ellsworth<br />
Shale on the western margin of the Michigan basin.<br />
LITHOLOGY<br />
Many of the Devonian shales, such as the Ohio and Antrim, are<br />
black to gray, thinly laminated, fissile, shales and siltstones. The<br />
western and northwestern areas are dominantly black shale, which<br />
grade eastward into gray shale and siltstone, and coarse-grained<br />
clastics of the Catskill delta complex farther east. Hosterman and<br />
Whitlow (1983) report that the shales consist of clay (30 to 75 percent)<br />
and quartz (20 to 50 percent) with varying amounts of pyrite<br />
and calcite being the primary accessory minerals. Clay minerals<br />
are primarily mixed layer clays (illite-smectite and illite-chlorite),<br />
chlorite, and kaolinite. The shale color (and density) varies based<br />
on the organic matter content (bitumen), which ranges from less<br />
than one percent to 27 percent (Zielinski and McIver, 1982). Pyrite<br />
occurs throughout the unit, but tends to be better preserved in the<br />
more organic-rich intervals. Total organic carbon analyses from<br />
nine Ohio Shale cores range from less than one percent to greater<br />
than 15 percent for the Appalachian basin in Ohio (Knapp and<br />
Stith, 1982). The lower portion of the Ohio is well known for largediameter,<br />
iron-rich concretions and for fossilized wood fragments<br />
along the outcrop in Ohio. Calcite often occurs as cementation at<br />
or near boundaries between the more and less organic units. Large<br />
carbonate concretions are also common in the Antrim throughout<br />
the Michigan basin.<br />
Matrix porosity estimated from geophysical logs ranges from 1.5<br />
percent to 11 percent with an average of 4.3 percent, which is typical<br />
for Appalachian basin wells (Boswell, 1996). Recently acquired<br />
sidewall cores from an Ohio Shale well in eastern Kentucky were<br />
analyzed using mercury injection and indicate an average matrix<br />
porosity of 0.9 percent. The highest porosity, 2.4 percent, occurred<br />
in the Lower Huron Member. Permeability from the sidewall cores<br />
averaged 0.5 microdarcys (µd). Total porosity (matrix and fracture)<br />
for the Antrim in Michigan has been reported as nine percent (Hill<br />
and Nelson, 2000).
APPENDIX A: DEVONIAN ORGANIC-RICH SHALES<br />
121<br />
DISCUSSION OF DEPTH AND THICKNESS RANGES<br />
The maximum drilling depths for Devonian shales in the Appalachian<br />
basin occur in West Virginia, Maryland, and Pennsylvania<br />
close to the Allegheny Front. In south-central Pennsylvania,<br />
western Maryland, and northeastern West Virginia, the base of the<br />
shale sequence often exceeds 8,000 or 9,000 feet (Matthews, 1983).<br />
However, in eastern Kentucky, southern and southwestern Ohio,<br />
and western West Virginia where most Devonian shale drilling and<br />
production has taken place, depths are in the 2,000 to 3,000 feet<br />
range (Figure A14-2). In general, the Devonian shales increase in<br />
thickness eastward from the outcrop in Kentucky and Ohio and<br />
southeastward from Lake Erie to the Allegheny Front. Thicknesses<br />
range from zero feet in some areas of central Kentucky (southwestern-most<br />
extent of the <strong>MRCSP</strong> study area) to more than 8,000 feet<br />
in south-central Pennsylvania (Matthews, 1983) (Figure A14-3). In<br />
the Ohio and northern Kentucky region, the unit maintains a relative<br />
consistent eastward increase in thickness from about 200 feet at the<br />
outcrop to more than 3,000 feet.<br />
In the Michigan basin, the Antrim crops out around the margin of<br />
the basin, but is often concealed by overlying glacial deposits. Drilling<br />
depths exceed 3,000 feet in Osceola County, central Michigan.<br />
The Antrim thickness exceeds 650 feet in central and northwestern<br />
lower Michigan (Matthews, 1993).<br />
DEPOSITIONAL ENVIRONMENTS/<br />
PALEOGEOGRAPHY/TECTONISM<br />
The depositional environments of the Devonian shales in the Appalachian<br />
and Michigan basins are considered transgressive basinfill<br />
sequences related to active subsidence and tectonism. The Ohio<br />
Shale depositional sequence was summarized by Potter and others<br />
(1981), Hamilton-Smith (1993), and Boswell (1996), . The shales<br />
were deposited in a shallow to deep foreland basin setting west of<br />
the active Acadian orogenic belt. Rapid transgression following the<br />
Middle Devonian unconformity resulted in sediment covering the<br />
Cincinnati and Findlay arches. The Bellefontaine outlier in western<br />
Ohio is the only remaining evidence for deposition on these structural<br />
highs (Swinford and Slucher, 1995). Controls on the preservation<br />
and distribution of organic matter continue to be debated,<br />
but the organics most likely accumulated under dysoxic to anoxic<br />
marine conditions. During initial basin subsidence, black shales accumulated<br />
under low energy conditions in a euxinic basin across the<br />
region, far from the Acadian orogeny and associated Catskill delta<br />
deposits. As active tectonism diminished, the black shales were replaced<br />
with prograding, gray clastic-rich sediments of the Chagrin/<br />
Brallier facies, distal deposits associated with the Catskill deltaic<br />
sequence. Gray shales and siltstones of the Chagrin and Brallier thin<br />
westward and southwestward, and were deposited by far reaching<br />
turbidity currents from the Catskill delta. Sediment supply from the<br />
Chagrin and Brallier exceeded subsidence of the Appalachian basin,<br />
thus effectively eliminating the anoxic environments required for<br />
black shale deposition.<br />
The Michigan basin formed in multiple stages throughout the<br />
Paleozoic Era, but originated in an extensional regime during Late<br />
Precambrian rifting. Faulting, fracture development, growth of<br />
anticlinal structures, and regional basin subsidence occurred periodically<br />
throughout the Paleozoic, especially during major orogenic<br />
events on the eastern margin of the continent (Howell and van der<br />
Pluijm, 1999). In late Devonian through early Mississippian time,<br />
the fault-bounded Precambrian rift basin was reactivated during the<br />
Alleghanian orogeny causing a period of thermal subsidence yielding<br />
a classic sag basin (Catacosinos and others, 1990).<br />
Gamma-ray log response is key to stratigraphic analysis of the<br />
Devonian shales. Figure A14-4 illustrates the variation of gammaray<br />
tool response within the Devonian shale of the Big Sandy gas<br />
field, eastern Kentucky. Gray shales exhibit a gamma-ray response<br />
of 200 or more API units. In the more organic-rich black shales, the<br />
gamma-ray response exceeds 280 API units and may exceed 600 API<br />
units. Organic carbon content of the shale has been correlated to the<br />
uranium content (Potter and others, 1981). Schmoker (1993) demonstrated<br />
the relationship between log response and organic content.<br />
SUITABILITY AS A CO 2<br />
INJECTION TARGET OR SEAL UNIT<br />
The suitability of the Devonian shales for CO 2 injection and sequestration<br />
has not been demonstrated, but should be considered in<br />
areas where the geologic controls are well known and predictable.<br />
The following examples support this hypothesis. It is most commonly<br />
assumed that the very low permeability (in the microdarcy range)<br />
makes shales more generally appropriate as a sealing unit. However,<br />
in the San Juan basin, CO 2 injection has been successfully demonstrated<br />
in coals, another organic-rich, low permeability, continuous,<br />
fractured reservoir. The similar behavior of gas production from the<br />
Devonian shales as compared to CBM indicates they may also serve<br />
as sequestration targets. Natural fracturing plays an important role<br />
in development of the shales as both a gas producing reservoir and<br />
a possible sequestration target. Methane adsorbed on organic matter<br />
and clay mineral surfaces (Hamilton-Smith, 1993) desorbs as reservoir<br />
pressure declines, thus theoretically creating potential new adsorption<br />
sites. Matrix porosity and organic matter content ultimately<br />
control the total volume of gas trapped in the shale. Permeability<br />
controls the diffusion rate of desorbed methane through that matrix.<br />
It is in the fracture system that flow measured in darcies dominates,<br />
facilitating the production of natural gas. In general, production in<br />
more highly fractured areas exhibits a relatively rapid decline as free<br />
gas in the fracture system is depleted, followed by an often decadeslong<br />
period of steady production controlled by the rate of methane<br />
desorption and diffusion through the fracture system. In areas with a<br />
less extensive fracture network, production often increases to reach<br />
a plateau of steady production analogous to CBM production history.<br />
Current research by Nuttall and others (2005) demonstrates a<br />
CO 2 adsorption capacity averaging 42.9 standard cubic feet per ton<br />
(scf/t) of shale (at expected reservoir pressures of 400 psi). Results<br />
from experiments to test the diffusion rate of CO 2 through the shale<br />
and any associated displacement of methane are currently being<br />
interpreted. Research to model shale gas production histories and<br />
investigate CO 2 injection is also needed.<br />
Available reservoir pressure and temperature data indicates that<br />
CO 2 can be injected as a gas in these organic-rich reservoirs. It is<br />
expected that the fractured black shale intervals will trap CO 2 adsorbed<br />
onto the surfaces of organic matter and clay minerals. The<br />
gray shale intervals, relatively lacking in organic matter and less<br />
fractured, are more likely to serve as permeability barriers or reservoir<br />
seals. To evaluate the opportunity for an effective reservoir<br />
seal, those areas where the shale is either very thick or at drilling<br />
depths of at least 1,000 feet need to be assessed. In those areas,<br />
where the shale is often gas productive, overlying Mississippian and<br />
Pennsylvanian shales and other impermeable units are anticipated to<br />
provide secondary sealing capacity.<br />
The Devonian shales are expected to be most suitable as a sequestration<br />
target where they are sufficiently deep, thick, organicrich,<br />
and fractured; that is, in the best shale gas producing areas.
N<br />
E<br />
122 CHARACTERIZATION OF GEOLOGIC SEQUESTRATION OPPORTUNITIES IN THE <strong>MRCSP</strong> REGION<br />
EXPLANATION<br />
1000 ft Index contours<br />
0<br />
250 ft contours<br />
Faults<br />
Devonian Shales Outcrops<br />
Mean sea elevation (feet)<br />
1750<br />
-3000<br />
-1000<br />
0<br />
D<br />
A T A<br />
T<br />
C I<br />
P R O J E C<br />
F I<br />
0<br />
-1000<br />
I N S U F<br />
T L<br />
I M I<br />
-1000<br />
0<br />
1000<br />
T<br />
-2000<br />
50 25 0 50 100 Miles<br />
50 25 0 50 100 150 Kilometers<br />
³<br />
Figure A14-2.—Structure contour map drawn on the top of the Devonian shales.
APPENDIX A: DEVONIAN ORGANIC-RICH SHALES<br />
123<br />
EXPLANATION<br />
200<br />
400<br />
Faults<br />
Appalachian basin<br />
1000 ft Index contours<br />
250 ft contours<br />
Michigan basin<br />
200 ft Index contours<br />
40 ft contours<br />
Devonian Shales Outcrop<br />
Thickness in feet<br />
4750<br />
200<br />
0<br />
2000<br />
1000<br />
3000<br />
T<br />
D A<br />
A<br />
P R O J E C<br />
T L<br />
C I E N T<br />
I M I<br />
T<br />
I N S U F F I<br />
50 25 0 50 100 Miles<br />
50 25 0 50 100 150 Kilometers<br />
³<br />
Figure A14-3.—Map showing the thickness of the Devonian shales.
124 CHARACTERIZATION OF GEOLOGIC SEQUESTRATION OPPORTUNITIES IN THE <strong>MRCSP</strong> REGION<br />
In the Appalachian basin, the primary gas producing area extends<br />
from eastern Kentucky, across central West Virginia, into eastern<br />
Ohio and through northwestern Pennsylvania (Figure A14-5). In<br />
the Michigan basin, Antrim Shale production is most prolific in an<br />
eight-county area across northern lower Michigan (Figure A14-5).<br />
The Devonian shale interval should also prove to be a most effective<br />
seal for sequestering CO 2 in stratigraphically lower reservoirs.<br />
Their great thickness and low permeability will inhibit movement<br />
upwards through the shale, especially in non-fractured areas. In addition,<br />
the ability of organic-rich shales to adsorb CO 2, as discussed<br />
above, may be a seal benefit by “soaking up” any CO 2 that may<br />
migrate from other reservoirs.<br />
Figure A14-4.—Type log from the Big Sandy gas field in eastern Kentucky<br />
illustrating the alternating black (high gamma-ray, greater than 280 API<br />
units) and gray (low gamma-ray) shales.
APPENDIX A: DEVONIAN ORGANIC-RICH SHALES<br />
125<br />
EXPLANATION<br />
Gas Fields<br />
Oil Fields<br />
P R O J<br />
E C T<br />
L I<br />
M I T<br />
50 25 0 50 100 150 Miles<br />
50 25 0 50 100 150 200 Kilometers<br />
³<br />
Figure A14-5.—Map showing gas fields in the Devonian shale interval.
126 CHARACTERIZATION OF GEOLOGIC SEQUESTRATION OPPORTUNITIES IN THE <strong>MRCSP</strong> REGION<br />
15. PENNSYLVANIAN COAL BEDS IN THE APPALACHIAN BASIN<br />
Coal beds of late Carboniferous-age occur in the Appalachian<br />
basin portion of the <strong>MRCSP</strong> study area. The Appalachian basin,<br />
one of the largest Pennsylvanian-age coal-producing regions in the<br />
world, currently contains the second, third, and fourth leading coalproducing<br />
states in the United States—West Virginia, Kentucky,<br />
and Pennsylvania, respectively (EIA, 2005). The greater northern<br />
Appalachian basin contains a series of smaller, anthracite-bearing<br />
synclinal basins in eastern Pennsylvania, but these areas are not<br />
included in this report.<br />
STRATIGRAPHY<br />
Coal beds considered potential targets for geologic CO 2 sequestration<br />
occur in the Pennsylvanian Subsystem of the Appalachian<br />
basin and range from early to late Pennsylvanian in age (Figure 5).<br />
Within the <strong>MRCSP</strong> study area, portions of two sub-basins or depocenters<br />
of Pennsylvanian-age occur, the northern Appalachian and<br />
central Appalachian basins (Figure A15-1). The boundary between<br />
these two sub-basins is approximately the southern limit of the outcrop<br />
belt of the Conemaugh Group (Figure 5; see also Figure A15-1)<br />
preserved in the Appalachian basin; this boundary also delineates<br />
the division between the northern and southern coal fields of West<br />
Virginia. Regional lithologic variations between the northern and<br />
central Appalachian basins result in a variety of stratigraphic terms<br />
applied within individual states of the partnership in order to divide<br />
and define this large stratigraphic interval.<br />
Pennsylvanian-age rocks in Ohio, Pennsylvania, Maryland, and<br />
the northern coal fields of West Virginia are divided, in ascending<br />
stratigraphic order, into the Pottsville, Allegheny, Conemaugh, and<br />
Monongahela Groups (Figure 5). In the southern coal field of West<br />
Virginia, changes in lithologic attributes and preservation of thicker<br />
Lower and Middle Pennsylvanian strata result in the introduction of<br />
the terms Pocahontas, New River, and Kanawha Formations. The<br />
Kanawha and the upper part of the New River Formations are considered<br />
lateral equivalents to the Pottsville Group. The lower part of<br />
the New River and all of the Pocahontas are restricted to the southern<br />
coal fields of West Virginia; also, the Pocahontas Formation is<br />
older than, and does not correlate to, any known Pennsylvanian-age<br />
rocks in other <strong>MRCSP</strong> states in the Appalachian basin.<br />
In Kentucky, the stratigraphic interval equivalent to the Pottsville<br />
and Allegheny Groups and the New River and Kanawha Formations<br />
is known as the Breathitt Group. Chesnut (1992) proposed<br />
a regional stratigraphic nomenclature for the central Appalachian<br />
basin that divides the Breathitt Group into eight coal-bearing and<br />
four quartzose-sandstone dominated formations; however, to date,<br />
this nomenclature has been formalized only in Kentucky.<br />
The Pennsylvanian- and Permian-age Dunkard Group, a unit<br />
containing a few mostly thin coals of limited extent, overlies the<br />
Monongahela Group in portions of Pennsylvania, Ohio, and West<br />
Virginia. However, this unit lacks coal beds of adequate thickness<br />
and/or depths for CO 2 sequestration consideration.<br />
ORIGIN OF NAMES, TYPE SECTIONS,<br />
SIGNIFICANT STUDIES<br />
Rice and others (1994) summarize much of the stratigraphic nomenclature<br />
used for coal-bearing rocks in the study area. Type or<br />
reference sections are located where each unit was named.<br />
Pottsville Group—Named for exposures at Pottsville Gap, Pennsylvania.<br />
Allegheny Group—Named for exposures in the Allegheny River<br />
valley of Pennsylvania.<br />
Conemaugh Group—Named for exposures along the Conemaugh<br />
River, Pennsylvania.<br />
Monongahela Group—Named for exposures along the Monongahela<br />
River, Pennsylvania.<br />
Breathitt Group—Named for exposures in Breathitt County, Kentucky.<br />
Kanawha Formation—Named for exposures along the Kanawha<br />
River, West Virginia.<br />
New River Formation—Named for exposures in New River Gorge,<br />
West Virginia.<br />
Pocahontas Formation—Named for exposures at Pocahontas, Virginia.<br />
<strong>Geologic</strong> investigations of Pennsylvanian-age rocks have occurred<br />
in the Appalachian basin since the 1830s. By the late 19 th<br />
century, the economic significance of the coals in this interval stimulated<br />
a wide array of regional and local studies on the economics,<br />
stratigraphy, depositional history, and various other geologic disciplines<br />
that continues today. Hence, a multitude of investigations on<br />
specific attributes of Pennsylvanian-age rocks, as well as regional<br />
summaries within each <strong>MRCSP</strong> state, have been presented in federal<br />
and state geological survey publications. Moreover, numerous<br />
special papers, field trip guidebooks, trade journal articles, and miscellaneous<br />
reports by various geological societies, organizations,<br />
and academia have, over the past 50 years or so, been published on<br />
the region. A few notable examples of these types of publications include<br />
U.S. <strong>Geologic</strong>al Survey Professional Papers 853 (McKee and<br />
Crosby, 1975) and 1110-A-L (for example, see Collins, 1979), West<br />
Virginia <strong>Geologic</strong>al Survey Volume 22 (Cross and Schemel, 1956),<br />
Kentucky <strong>Geologic</strong>al Survey Series XI Bulletin 3 (Chesnut, 1992),<br />
a collection of papers by the Carolina Coal Group (Ferm and Horne,<br />
1979), and numerous regional guidebooks prepared for the meetings<br />
of the 9 th International Congress of Carboniferous Stratigraphy and<br />
Geology, the 28 th International <strong>Geologic</strong>al Congress, and the 1961,<br />
1981, and 1992 <strong>Geologic</strong>al Society of America national meetings.<br />
Additional references on the specific geologic framework within<br />
each <strong>MRCSP</strong> state can be obtained from the geological surveys of<br />
individual partnership states.<br />
Thickness and chemical data on specific coal beds are available<br />
through the National Coal Resource Database system (NCRDS) of<br />
the U.S. <strong>Geologic</strong>al Survey or from each state geological survey.<br />
The U.S. <strong>Geologic</strong>al Survey also has published a series of regional<br />
coal maps and databases for several of the economically significant<br />
coal beds in the region (Appalachian Basin Resource Assessment<br />
Team, 2002). In addition, maps of most known, abandoned, underground<br />
coal-mines are available from either federal or state agencies<br />
for several of the partnership states.<br />
NATURE OF LOWER AND UPPER CONTACTS<br />
A significant geologic disconformity occurs in the Appalachian<br />
basin between the top of the Mississippian Subsystem and the base<br />
of the Pennsylvanian Subsystem in all but southern West Virginia;<br />
there, continuous deposition occurred and Mississippian rocks
( (<br />
( (<br />
APPENDIX A: PENNSYLVANIAN COAL BEDS IN THE APPALACHIAN BASIN<br />
127<br />
EXPLANATION<br />
( ( Thrust Fault<br />
Pennsylvanian Units<br />
N O R T H E R N<br />
B<br />
"Dunkard Basin"<br />
A P PALACHIAN BASIN<br />
C E NT RA L A PPALACHIAN BASIN<br />
S T R U C T U R A<br />
L F R O N T L I N E<br />
A<br />
"Pocahontas"<br />
Basin<br />
(<br />
( ( (<br />
PINE MOUNTAIN<br />
THRUST FAULT<br />
30 15 0 30 60 Miles<br />
30 15 0 30 60 90 Kilometers<br />
³<br />
Figure A15-1.—Map showing extent of coal-bearing formations in <strong>MRCSP</strong> region of Appalachian basin and the division and location of the northern and<br />
central Appalachian sub-basins. Locations of cross sections shown in Figure A15-2 denoted by lines A and B.
128 CHARACTERIZATION OF GEOLOGIC SEQUESTRATION OPPORTUNITIES IN THE <strong>MRCSP</strong> REGION<br />
grade upward into Pennsylvanian-age strata (Arkle and others,<br />
1979; Collins, 1979; Edmunds and others, 1979; Rice and others,<br />
1979; Chesnut, 1992; Greb and others, 2004). No coals of economic<br />
importance are found below this disconformity. The amount of erosion<br />
on the Mississippian surface prior to deposition of Pennsylvanian-age<br />
strata increases to the west and northwestward; also, the<br />
age of basal Pennsylvanian strata becomes progressively younger in<br />
this direction. In general, the difference in age between uppermost<br />
Mississippian and lowermost Pennsylvanian strata preserved in the<br />
Appalachian basin increases northwestward in the <strong>MRCSP</strong> study<br />
area. The top of the coal-bearing interval is the present-day land<br />
surface throughout the Appalachian basin.<br />
LITHOLOGY<br />
The distribution of coal beds is not uniform throughout Pennsylvanian-age<br />
rocks in the <strong>MRCSP</strong> study area. In the central Appalachian<br />
basin, a considerable number of thick and areally extensive<br />
coals occur in Lower and Middle Pennsylvanian rocks of the Pocahontas,<br />
New River, and Kanawha Formations and their updip equivalents<br />
in the Breathitt Group (Middle Pennsylvanian coals tend to be<br />
the most widespread). In the northern Appalachian basin, the most<br />
widespread coal beds occur in the Middle and Upper Pennsylvanian<br />
Allegheny and Monongahela Groups, respectively. One of these<br />
coals, the Pittsburgh, which occurs at the base of the Monongahela<br />
Group, is one of the most widespread coal beds in the world and is<br />
also the most frequently mined coal in the Appalachian basin.<br />
Lower and Middle Pennsylvanian units consist mainly of sandstones,<br />
siltstones, and gray and black shales, and contain regionally<br />
significant economic beds of coal, and locally economic beds of<br />
clay and limestone. Upper Pennsylvanian rocks of the Conemaugh<br />
and Monongehela Groups consist mainly of sandstones, siltstones,<br />
shales, mudstones, and limestones. Compared to Middle Pennsylvanian<br />
strata, the Upper Pennsylvanian contains greater percentages<br />
of limestone and mudstones and an abundance of green- and redcolored<br />
rocks. Also, regionally significant economic coal beds occur<br />
only in the Monongahela Group.<br />
In general, Pennsylvanian-age lithologies grade vertically and<br />
laterally into each other across short distances, although some coal<br />
beds, carbonates, and marine shales are useful marker horizons that<br />
can be correlated within each of the sub-basins (Chesnut, 1992).<br />
Increases in the overall thickness of the geologic section and splitting<br />
of coal beds into coal zones toward the basin axis, plus the<br />
lateral truncation of coal-bearing strata by thick, quartzose sandstones<br />
complicate Lower Pennsylvanian stratigraphy in the central<br />
Appalachian basin of Kentucky and southern West Virginia (Figure<br />
5) (Arkle and others, 1979; Donaldson and others, 1985; Chesnut,<br />
1992; Greb and others, 2002a, 2004). Noting the occurrence of these<br />
thick quartzose sandstones is a critical factor when determining the<br />
lowest depth that coal can be found, or the base of the Pennsylvanian<br />
section, from geophysical logs.<br />
DEPTH, THICKNESS, AND STRUCTURE OF<br />
PENNSYLVANIAN ROCKS<br />
Pennsylvanian strata exhibit two depocenters in the <strong>MRCSP</strong><br />
study area: 1) the axis of the northern Appalachian (Dunkard) basin<br />
in southwestern Pennsylvania, Ohio, and northern West Virginia;<br />
and 2) the axis of the central Appalachian (Pocahontas) basin in<br />
southern West Virginia and southeastern Kentucky (and adjacent<br />
southwest Virginia outside of the <strong>MRCSP</strong> study area) (Arkle, 1974)<br />
(see also Figure A15-1). In the northern Appalachian basin, coalbearing<br />
rocks may extend to depths that are around 1,800 feet below<br />
the present-day surface.. In the southern part of the central Appalachian<br />
basin, coal-bearing strata may reach depths of 3,000 feet<br />
beneath the surface; however, thick quartzose sandstones replace<br />
much of the coal-bearing strata in the lower third of the interval.<br />
Thus, only 1,600 feet of coal-bearing strata may be below drainage<br />
(the level of the lowest stream in an area).<br />
Pennsylvanian-age rocks containing coal beds reach their greatest<br />
depth (relative to sea level) in the axis of the northern Appalachian<br />
(Dunkard) basin —a northeast-southwest trending synclinorium<br />
formed mainly by Alleghanian orogenic tectonism, whose central<br />
part extends from about Jackson County, West Virginia, northeastward<br />
into Green County, Pennsylvania (Figure A15-1). In general,<br />
the base of the Pennsylvanian slowly rises away from this structural<br />
axis (in all directions) until basal Pennsylvanian strata occur at the<br />
surface. Although the Pennsylvanian section is thickest in the Pocahontas<br />
basin region, the structural configuration of the basin causes<br />
these older units to rise in structural altitude and crop out along the<br />
southern basin margin (Figure A15-2).<br />
These thickness trends are the result of three main factors: 1) erosional<br />
relief on the top of the Mississippian, 2) location of the source<br />
area for most Pennsylvanian-age sediments, and 3) location of depocenters<br />
of the Appalachian basin during Late Paleozoic time.<br />
DEPOSITIONAL ENVIRONMENTS/<br />
PALEOGEOGRAPHY/TECTONISM<br />
During the early Carboniferous, the Appalachian basin was located<br />
about 20 degrees south latitude and was part of the paleocontinent<br />
Laurentia. By the late Carboniferous, this region had migrated<br />
northward and was mostly in the equatorial region (Blakey, 2005).<br />
This northward migration of Laurentia through the paleolatitudes,<br />
the continental collision of Gondwana (Africa and South America<br />
portion) into the southern part of Laurentia, forming the Appalachian<br />
mountains, and eustatic responses to continental glaciation<br />
events in the southern hemisphere, controlled the types and preservation<br />
of sediments deposited in the Appalachian basin during the<br />
Pennsylvanian (Cecil and others, 1985; Donaldson and other, 1985;<br />
Cecil and Edgar, 1994). Most Lower and Middle Pennsylvanian<br />
coal beds formed as extensive peat accumulations in waterlogged,<br />
coastal-deltaic environments that were centered mostly in the southern<br />
and central portions of the central Appalachian basin (Martino,<br />
1996a; Greb and others, 2002a,b, 2004). Coals in the southern portion<br />
of the central Appalachian basin are mainly low- to mediumvolatile<br />
bituminous with low-sulfur contents, whereas those in the<br />
central portion are typically high-volatile bituminous containing<br />
low- to moderate-sulfur values (Arkle, 1974). In contrast, most of<br />
the preserved Upper Pennsylvanian coal beds formed in continental<br />
fluvial, paludal, and limnic environments on an extensive alluvial<br />
plain above a depocenter in the northern Appalachian basin (Donaldson,<br />
1974; Ferm, 1974; Arkle and others, 1979; Collins, 1979;<br />
Edmunds and others, 1979; Donaldson and others, 1985; Martino,<br />
1996b). Typically, Upper Pennsylvanian coals of the northern Appalachian<br />
basin are high-volatile bituminous in rank with high-sulfur<br />
contents (Arkle, 1974).<br />
SUITABILITY AS A CO 2<br />
INJECTION TARGET OR SEAL UNIT<br />
In general, subsurface coal beds typically contain natural gas,<br />
called coalbed methane (CBM)). A high percentage of this gas is<br />
adsorbed naturally on to the surface of the coal. Current methods for
APPENDIX A: PENNSYLVANIAN COAL BEDS IN THE APPALACHIAN BASIN<br />
129<br />
<br />
<br />
<br />
<br />
<br />
<br />
<br />
<br />
<br />
<br />
<br />
<br />
<br />
<br />
<br />
<br />
<br />
<br />
Figure A15-2.— Schematic cross sections across portions of the Appalachian basin showing<br />
major stratigraphic divisions and position of quartzose sandstones: A) Ohio to West Virginia;<br />
B) Kentucky. Red line is schematic representation of 500-foot minimum-depth buffer and its<br />
relationship to regional stratigraphy.<br />
<br />
<br />
<br />
<br />
recovering CBM involve depressurizing the reservoir by removal of<br />
natural interstitial water from the coal. Methane molecules on the<br />
surface of the coal are then freed as gas. An alternative approach for<br />
methane recovery is to inject CO 2 into the coal bed in order to enhance<br />
methane removal after dewatering has occurred. Experiments<br />
indicate that coal beds have an affinity to adsorb approximately<br />
twice as many CO 2 molecules compared to the number of methane<br />
molecules currently contained in the reservoir. Thus, considering<br />
the differences in molecular weights, the potential exists to displace<br />
and recover about one ton of CBM for every five tons of CO 2 stored<br />
within a coal bed. CO 2 recovery of CBM has been demonstrated<br />
in limited field tests (see White and others, 2005). Because of this<br />
adsorption ability of coals, geologic sequestration of CO 2 into coal<br />
beds is the only circumstance where CO 2 might be considered for<br />
injection at shallow depths, above or within proximity to an underground<br />
source of drinking water.<br />
Numerous coal beds in the Appalachian basin historically are<br />
recognized as having gas contents high enough to create a hazard<br />
during underground mining operations. In the last decade, significant<br />
CBM production has occurred in some of these historic ‘gassy’<br />
coals, particularly from the Pocahontas Formation in southern West<br />
Virginia and western Virginia (which is just south of the <strong>MRCSP</strong><br />
boundary) (Adams, 1984; Lyons, 1998; Nolde and Spears, 1998).<br />
CBM is locally produced from at least 24 pools in Pennsylvania<br />
(Markowski, 1998), and historic and modern CBM fields occur also<br />
in the northern portion of West Virginia (Avary, 2004). Furthermore,<br />
Lyons (1998) reports CBM production in eastern Kentucky, and in<br />
Ohio, historic CBM production occurred as early as 1924 (Riley and<br />
others, 2004). Although interest in CBM production and exploration<br />
is growing in the basin, vast areas remain untested—as well as their<br />
CO 2 sequestration potential—and much of the existing data vital in<br />
understanding CBM systems are not publicly available.<br />
Identification of “unminable” coal beds that may serve as geologic<br />
sinks for CO 2 sequestration in the Appalachian region is a<br />
goal of DOE’s sequestration research and is a major component<br />
of the <strong>MRCSP</strong> project. There are, however, many technical and<br />
political issues that need to be evaluated to determine at what depth<br />
and thickness any of these coal beds would be considered truly<br />
unminable, and thereby available for CO 2 sequestration. Although<br />
these considerations have yet to be resolved and may vary between<br />
states, as an initial evaluation, <strong>MRCSP</strong> states compiled data on the<br />
total net coal thickness that might be available for CO 2 sequestration.<br />
Technical and political criteria would have to be subtracted<br />
from this data set for enhanced site-specific evaluations.<br />
For this study, data were compiled for coals inferred to be more<br />
than one foot thick and greater than 500 feet below the surface, and<br />
then used to construct a regional net-coal isopach map (Figure A15-<br />
3). Currently, the U.S. Mine Safety and Health Administration considers<br />
400 feet to be the depth that fracturing can generally influence<br />
underground mining; thus, a 500 foot depth restriction for defining<br />
coals beneath the level of surface fracturing for potential sequestration<br />
is deemed appropriate. Likewise, a depth of 500 feet is well<br />
beneath the minimum 299 feet depth suggested for optimal methane<br />
potential in parts of the northern Appalachian basin (Rice and Finn,<br />
1996), and near the optimal minimal depth of 600 feet suggested by<br />
Markowski (1998).<br />
The issue of depth of coal beneath the surface is complicated<br />
across the <strong>MRCSP</strong> study area by the deeply incised topography in<br />
the mountainous parts of the coal fields. In these regions, mostly<br />
southern West Virginia and southeastern Kentucky, several thousand<br />
feet of topographic surface relief can exist. Most coal mining in<br />
these areas is done near the surface or by drift mines extending hori-
( (<br />
10<br />
130 CHARACTERIZATION OF GEOLOGIC SEQUESTRATION OPPORTUNITIES IN THE <strong>MRCSP</strong> REGION<br />
EXPLANATION<br />
( ( Thrust Fault<br />
5 ft contours<br />
15<br />
Pennsylvanian Units<br />
Thickness in feet<br />
30<br />
0<br />
5<br />
0<br />
5<br />
20<br />
10<br />
5<br />
25<br />
30<br />
25<br />
! !!!<br />
20<br />
!!<br />
!<br />
!<br />
!<br />
!<br />
! !<br />
!<br />
!<br />
S T R U C T U R A<br />
L F R O N T L I N E<br />
5<br />
(<br />
( ( (<br />
( ( (<br />
PINE MOUNTAIN<br />
THRUST FAULT<br />
30 15 0 30 60 Miles<br />
30 15 0 30 60 90 Kilometers<br />
³<br />
Figure A15-3.—Map showing the net thickness of Pennsylvanian coals that are at least 500-feet deep and one-foot or greater in thickness.
APPENDIX A: PENNSYLVANIAN COAL BEDS IN THE MICHIGAN BASIN<br />
131<br />
zontally into the sides of hills. Although portions of these mines can<br />
reach depths of more than 2,000 feet beneath the surface, most are<br />
still above drainage, or above the level of the lowest streams in the<br />
area. For sequestration purposes, it may be important to delineate<br />
those coal beds that are below the lowest level of streams (called<br />
“below drainage”) to ensure the sequestered CO 2 gas will not leak to<br />
the surface through fractures or updip along bedding partings.<br />
Coal thickness data in each state were obtained mainly from deep<br />
diamond-drill core holes and density logs from oil and gas exploration<br />
wells on file at each state survey. Oil and gas data are particularly<br />
useful for the deeper parts of the basin, although only a fraction<br />
of the wells drilled have density logs through the Pennsylvanian<br />
strata because, in general, coal-bearing strata are cased-off prior to<br />
logging. The manner in which thickness data was compiled in each<br />
state varied also because the topography, geology, mining history,<br />
and available data were wide-ranging across the region. Data from<br />
Maryland, Ohio, Pennsylvania, and West Virginia represent coal<br />
beds more than 500 feet beneath the present-day land surface. In<br />
eastern Ohio, this may also be close to the below-drainage depth<br />
because of minimal- to moderate-topographic relief in this area. In<br />
northern West Virginia, many of the oil and gas wells used were<br />
cased off to depths of more than 500 feet; so much of the thickness<br />
represented may also be below drainage. In Kentucky, data were<br />
only compiled for coal beds more than one-foot thick and more than<br />
500 feet below drainage. Coal beds in Maryland occur only in two<br />
synclinal basins preserved (one isolated; see Figure A15-3) near the<br />
eastern edge of the Appalachian basin proper. Thus, coal thickness<br />
data are shown as individual data point values not connected to the<br />
main contoured net-coal map for the Appalachian basin.<br />
No data were compiled for southern West Virginia because that is<br />
an area of active mining, and it was felt the area should be restricted<br />
from consideration for sequestration in that state at this time. If<br />
these criteria were used also in Kentucky, no sequestration potential<br />
would exist in that state because areas of thickest coal at depth are<br />
also areas of mining at or near the surface. Likewise, parts of the<br />
thick, cumulative coal thickness in Ohio and Pennsylvania are areas<br />
of current near-surface mining. Hence, considering these multifaceted<br />
elements related to CO 2 sequestration into coal beds, further<br />
analysis, public discussion, and additional data collection and mapping<br />
will be required in <strong>Phase</strong> II of the <strong>MRCSP</strong> project.<br />
16. PENNSYLVANIAN COAL BEDS IN THE MICHIGAN BASIN<br />
The Pennsylvanian Saginaw Formation is a coal-bearing interval<br />
that is restricted to the central part of the Michigan basin due<br />
to erosional truncation. Along with other Pennsylvanian strata in<br />
Michigan, the Saginaw is isolated from correlative coal-bearing<br />
strata in the Appalachian basin portion of the <strong>MRCSP</strong> study area. In<br />
general, the Saginaw Formation is equivalent to Lower and Middle<br />
Pennsylvanian (e.g., Pottsville and Allegheny formations) strata in<br />
adjacent basins.<br />
Although commercial coal production occurred in the Pennsylvanian<br />
“Coal Measures” of the central Michigan basin in the late<br />
1800s and early 1900s (maximum production of over two million<br />
short tons in 1907), all coal beds in the basin are now considered<br />
noneconomic (Ells, 1979). Total current reserves are estimated at<br />
126.5 short tons (Kalliokowski and Welch, 1976) in individual coal<br />
beds typically less than three feet thick and laterally discontinuous<br />
on a scale of hundreds to thousands of lateral feet (Kelly, 1936).<br />
Complete sections of Pennsylvanian rocks in Michigan do not exist<br />
as outcrops or in known diamond drill-hole cores. Stratigraphic<br />
relationships are mostly inferred from subsurface geophysical logs,<br />
well cuttings, drillers’ reports, and rare cores collected during drilling<br />
of oil, gas, and water wells (Vugrinovich, 1984). Small-scale,<br />
spatial,lateral and vertical lithologic variability characterizes Pennsylvanian<br />
strata in Michigan. Various stratigraphic nomenclature<br />
has been proposed for these strata; however, no scheme is universally<br />
accepted due to the paucity of data, lack of lateral continuity of<br />
most units, and complex facies relationships.<br />
Biostratigraphic data are limited for the Saginaw Formation. Age<br />
ranges for the unit indicate a late Morrowan (Early Pennsylvanian)<br />
through late Desmoinesian (Middle Pennsylvanian) age, with the<br />
majority of the Saginaw being Morrowan age (Arnold, 1949; Wanless<br />
and Shideler, 1975; Vugrinovich, 1984). However, recent palynological<br />
analysis indicates an Early Pennsylvanian, Atokan age for<br />
upper portions of the Saginaw (R.M. Ravn, pers. comm., 2005).<br />
The predominantly arenaceous facies of the Parma Sandstone is<br />
considered the basal formation of the Pennsylvanian Subsystem in<br />
the Michigan basin, although some workers included the Parma as<br />
the basal portion of the Saginaw Formation (Ells, 1979). Strata of<br />
the Saginaw Formation proper consist of heterolithic sandstones,<br />
shales, coals, and limestones with a regionally prominent limestone<br />
unit, the Verne Limestone Member, separating pre- and post-Verne<br />
cycles (Kelly, 1936). The overlying Grand River Formation is a<br />
laterally discontinuous, predominantly fine- to coarse-grained sandstone<br />
unit (Kelly, 1936).<br />
Wanless and Shideler (1975) subdivided the Pennsylvanian strata<br />
of the Michigan basin, in ascending order, into a sand-dominated<br />
basal “A” unit, a predominantly fine-grained shale, siltstone, sandstone,<br />
limestone, and coal-bearing “B” unit, and a predominantly<br />
sandy “C” unit, even though substantial lithologic variability occurs<br />
laterally in each of these units. Vugrinovich (1984) conducted an<br />
extensive subsurface investigation in a ten-county area of the central<br />
Michigan basin, and proposed an informal revision of Wanless and<br />
Shideler’s nomenclature. Recently, a regional hydrogeologic study<br />
by Westjohn and Weaver (1998) concluded that the “assignment of<br />
sandstones or other Pennsylvanian rocks to either the Saginaw Formation<br />
or the Grand River Formation is difficult, if not impossible,<br />
because there are no lithologic differences or stratigraphic horizons<br />
that mark a change from one formation to the other.”<br />
ORIGIN OF NAMES, TYPE SECTION, SIGNIFICANT<br />
EARLIER STUDIES ON THIS INTERVAL<br />
Lane (1902) named the Saginaw Formation for a series of Pennsylvanian-age<br />
sandstones, shales, coals, and limestones observed<br />
in drill holes for coal exploration in the central Michigan basin.<br />
Kelly (1936) provided more detailed descriptions of the Saginaw<br />
from very limited outcrop exposures along the Grand River in<br />
Eaton County, from coal mine shafts and pits in the Saginaw Valley,<br />
and from other areas of the central Michigan basin as well as.<br />
Kelly interpreted the complex lateral and vertical facies changes<br />
as indicators of small-scale spatial variations in local depositional<br />
environments that ranged from fresh water to brackish and marine,<br />
and concluded also that portions of the Saginaw were deposited as<br />
cyclothems. Ells and others (1964) and Ells (1979) presented the<br />
most accepted stratigraphic terminology and stratigraphic relationships<br />
for Pennsylvanian units. Shideler (1969) and Wanless and<br />
Shideler (1975) studied the stratigraphy, sedimentology, and paleo-
132 CHARACTERIZATION OF GEOLOGIC SEQUESTRATION OPPORTUNITIES IN THE <strong>MRCSP</strong> REGION<br />
geography of Pennsylvanian strata in Michigan, and established a<br />
southwestward paleo-sediment transport direction of predominantly<br />
fluvial to deltaic sediments. In a detailed study of subsurface data,<br />
Vugrinovich (1984) established lithostratigraphy, structure, and isopach<br />
thickness relationships, and interpreted depositional environments<br />
for Pennsylvanian strata in the central basin area. Recently,<br />
Westjohn and Weaver (1998) characterized the areal distribution<br />
and lithology of the Saginaw aquifer and confining units (composite<br />
Saginaw and Grand River Formations) on the basis of an extensive<br />
subsurface study of well logs.<br />
NATURE OF LOWER AND UPPER CONTACTS<br />
General stratigraphic relationships in the Michigan basin, based<br />
on subsurface studies, indicate a major unconformity (the base<br />
Absaroka unconformity) underlies Pennsylvanian-age rocks in<br />
most areas of the basin, and that another unconformity of probable<br />
composite origin occurs at the top of the Pennsylvanian section<br />
(Ells, 1979). However, Westjohn and Weaver (1998) and Vugrinovich<br />
(1984) suggested that the sandstone-dominated lithofacies<br />
at the base of the Pennsylvanian section (the Parma Sandstone of<br />
some workers) may interfinger and constitute facies equivalents of<br />
the Mississippian-age Bayport Limestone in the central Michigan<br />
basin, thus obscuring this regional unconformity contact in places.<br />
Jurassic rocks overlie portions of the Pennsylvanian section (mostly<br />
in the western basin area); however, lithofacies in the Jurassic “red<br />
beds” section appear similar to the highly variable lithofacies of the<br />
underlying Pennsylvanian, making the pick between these formations<br />
problematic in places.<br />
LITHOLOGY AND COAL THICKNESS RELATIONSHIPS<br />
The description of the lithologic variability in the Saginaw Formation<br />
is based on current stratigraphic schemes used in Michigan<br />
(see above discussion). The lithology of the entire Pennsylvanian<br />
section is best considered here because this is the interval mapped<br />
for this project. Wanless and Shideler (1975) described a gross lithologic<br />
subdivision for the Pennsylvanian section in Michigan.<br />
“Unit A” (Parma Sandstone and lower portions of the Saginaw<br />
Formation of other workers) consists of up to 550 feet of mainly<br />
clastics with minor amounts of coals, limestones, and evaporites.<br />
The coal occurs in beds generally less than three feet thick, but locally,<br />
beds as thick as eight feet thick are reported (Vugrinovich,<br />
1984). Total net coal thickness is typically less than seven feet in<br />
this interval.<br />
“Unit A” is overlain by “Unit B” (Wanless and Shideler, 1975),<br />
an interval of fine-grained clastics with predominantly dark carbonaceous<br />
mudstone, minor coal, and limestone (Upper Saginaw<br />
Formation and Verne Limestone Member of other workers). Coal is<br />
present mainly in the eastern part of the basin in this interval (Wanless<br />
and Shideler, 1975). This unit is interpreted as the updip portion<br />
of a prograding fluvial deltaic succession with paleosediment<br />
transport to the southwest. “Unit B” ranges from zero to185 feet in<br />
thickness and has an antithetic thickness relationship to the underlying<br />
“Unit A” and the overlying “Unit C.” Coal beds are generally<br />
less than three feet in thickness with a composite thickness of less<br />
than seven feet.<br />
“Unit C” (Wanless and Shideler, 1975; Grand River Formation of<br />
others) is a predominantly coarse-grained clastics unit with lesser<br />
amounts of mudstones, limestones, gypsums, and minor coals. The<br />
coal is irregularly distributed and is generally less than three feet in<br />
composite thickness in this unit.<br />
DISCUSSION OF DEPTH AND THICKNESS RANGES<br />
Extensive truncation and deformation of the Pennsylvanian<br />
bedrock surface (subcrop) occurred prior to and during Pleistocene<br />
glaciation in many areas of the Michigan basin. Thus, the Saginaw<br />
rocks lie at relatively shallow depths directly below the Pleistocene<br />
deposits (maximum depth of 310 feet above sea level to a high of<br />
880 feet above sea level—Figure A16-1). Although thickness relationships<br />
of the Saginaw/Pennsylvanian section are strongly controlled<br />
by the basin-centered subcrop surface, it is also influenced<br />
by primary depositional controls resulting from the facies relationships<br />
and intra-formational unconformities, with resultant complex<br />
isopach relationships formed in probable stacked fluvial-deltaic depocenters<br />
(Ells, 1979). The Saginaw, in general, ranges in thickness<br />
from zero at the subcrop to more than 650 feet thick in the central<br />
Michigan basin (Figures A16-1 and A16-2). Considering the lithologic<br />
complexity of the rocks, a lack of consistency in stratigraphic<br />
nomenclature, and the lack of core and outcrop data, the formation<br />
tops and isopach thicknesses used for the Saginaw Formation in this<br />
study (Figure A16-2) most likely represent a composite thickness of<br />
the Pennsylvanian strata in the basin.<br />
Maximum composite coal bed thickness for the entire Pennsylvanian<br />
section is probably less than 12 to15 feet. This thickness may<br />
be present only in places in the southern and eastern portions of the<br />
study area. A maximum of five percent coal in the entire Pennsylvanian<br />
section is a conservative estimate.<br />
DEPOSITIONAL ENVIRONMENTS/<br />
PALEOGEOGRAPHY/TECTONISM<br />
The Pennsylvanian strata of Michigan were deposited during a<br />
period of generally southwestward sediment transport in non-marine,<br />
marginal-marine, and open-marine environments. Progradational<br />
fluvial and deltaic depositional systems produced variable<br />
lithofacies and thicknesses of sediments that periodically contained<br />
marine incursions represented by laterally persistent marine limestone<br />
and shale units. Pre-Pennsylvanian paleotopography was<br />
rather irregular due to moderate pre-Pennsylvanian tectonic warping,<br />
which is best illustrated by the relief on the Howell anticline, a<br />
major structural feature in the area. This structure is represented by<br />
a reentrant in the structure and isopach maps in the southeast corner<br />
of the subcrop area (Figures A16-1 and A16-2). The thickness of the<br />
Saginaw ranges from approximately 44 feet to more than 380 feet<br />
over a distance of approximately ten miles in this area (Wanless and<br />
Shideler, 1975). With time, these topographic undulations become<br />
obscured by infilling sediments, thus indicating a general tectonic<br />
quiescence that persisted during the remainder of Pennsylvanian<br />
time. Facies and isopach thickness relationships were apparently<br />
influenced by eustatic fluctuations that resulted in transgressive and<br />
regressive stratigraphic relationships.<br />
SUITABILITY AS A CO 2<br />
INJECTION TARGET OR SEAL UNIT<br />
The Saginaw Formation and other Pennsylvanian strata in the<br />
Michigan basin are of interest to the <strong>MRCSP</strong> because the unminable<br />
coal beds and, possibly, the organic-rich shales may be sequestration<br />
targets, even though most are at shallow depths (less than 1000 feet) in<br />
the Michigan basin. The maximum thickness of the Pennsylvanian section<br />
mapped is between 600 and 700 feet but less than five percent of<br />
this thickness consists of coal. Maximum coal thickness reported in any<br />
one section is probably less than 12 to15 feet (Vugrinovich, 1984).
APPENDIX A: PENNSYLVANIAN COAL BEDS IN THE MICHIGAN BASIN<br />
133<br />
EXPLANATION<br />
30 ft contours<br />
Mean sea elevation (feet)<br />
880<br />
310<br />
550<br />
490<br />
430<br />
430<br />
550<br />
670<br />
790<br />
880<br />
20 10 0 20 40 Miles<br />
20 10 0 20 40 60 Kilometers<br />
³<br />
Figure A16-1.—Structure contour map drawn on the top of the Saginaw Formation.
200<br />
134 CHARACTERIZATION OF GEOLOGIC SEQUESTRATION OPPORTUNITIES IN THE <strong>MRCSP</strong> REGION<br />
EXPLANATION<br />
200 ft Index contours<br />
40 ft contours<br />
Thickness in feet<br />
560<br />
80<br />
200<br />
200<br />
400<br />
200<br />
400<br />
20 10 0 20 40 Miles<br />
20 10 0 20 40 60 Kilometers<br />
³<br />
Figure A16-2.—Map showing the thickness of the Saginaw Coal.
APPENDIX A: LOWER CRETACEOUS WASTE GATE FORMATION<br />
135<br />
Much of the stratigraphy and lateral extent of the Saginaw Formation<br />
and other Pennsylvanian-age rocks in Michigan is poorly<br />
known because the majority of the data available on this interval<br />
consists of limited drill-hole logs and records. However, down-hole,<br />
log-based studies of thickness and distribution trends of coals in the<br />
Pennsylvanian may be feasible using available log data, gamma-ray,<br />
resistivity, neutron-porosity, and density logs (Vugrinovich, 1984).<br />
However, these studies are restricted mostly to the deeper portions<br />
of the central Michigan basin (Figure A16-1). Other feasible sequestration<br />
targets within Pennsylvanian rocks could include organicrich,<br />
carbonaceous shale, a significant but, as yet, unquantified<br />
reservoir for CO 2 sequestration.<br />
17. LOWER CRETACEOUS WASTE GATE FORMATION<br />
The Waste Gate Formation of the Potomac Group (Delaware,<br />
Maryland, New Jersey, and Virginia) is a stratigraphic unit that<br />
includes a correlative sequence of subsurface strata underlying<br />
the eastern Delaware-Maryland-Virginia (“Delmarva”) Peninsula<br />
that are significantly different in age, lithology, and petrophysics<br />
from the Patuxent Formation. In the type area, the Potomac Group<br />
is divided into formations but, in many places, the formations are<br />
less distinct lithologically, and one or more formations, or even the<br />
entire group, is treated as an undivided unit. The Waste Gate beds<br />
were previously considered part of the Lower Cretaceous Potomac<br />
Group (undivided) or the lower part of the Patuxent Formation. A<br />
diagram showing the stratigraphy as proposed by Hansen (1984) is<br />
provided as Figure A17-1.<br />
The Potomac Group is a largely non-marine fluvial-deltaic complex<br />
of interbedded sandstones and mudrocks that generally dips<br />
and thickens eastward toward the Atlantic Ocean. While the Waste<br />
Gate Formation is limited to the subsurface primarily under the Delmarva<br />
Peninsula, the younger units of the Potomac Group crop out<br />
updip, west of the Chesapeake Bay and in the northernmost part of<br />
the Delmarva Peninsula (Figure A17-2). The Potomac Group pinches<br />
out altogether at the Fall Line or Fall Zone, which is the boundary<br />
between the Piedmont Province and the Coastal Plain Province,<br />
and across which rivers from the upland (Piedmont) region drop as<br />
rapids or falls to the Coastal Plain (Figure A17-3).<br />
Hansen (1982, 1984) reported that basal beds (i.e., Waste Gate<br />
Formation) decrease in thickness in an up-dip direction, northwestward<br />
toward the Baltimore-Washington corridor, and that the upper<br />
part of this sequence is marked by an unconformity. This places the<br />
Late Cretaceous Magothy Formation on top of the Potomac Group<br />
(Figure A17-1).<br />
The Waste Gate Formation is fairly limited in extent. Hansen<br />
(1984) indicateed that the Waste Gate occurs beneath the southeastern<br />
part of the Delmarva Peninsula, including the southeastern portion<br />
of Maryland’s eastern shore and the northern part of Virginia’s<br />
eastern shore. The unit probably underlies part of southeastern Delaware,<br />
and possibly may extend at least as far north as the southern<br />
tip of New Jersey.<br />
Hansen has also indicated that, offshore of New Jersey, there<br />
are partially coeval units, including some non-marine, feldspathic<br />
sandstones and shales as well as limestones, calcareous shales, and<br />
limy sandstones. The relationship between these units in offshore<br />
wells and the Waste Gate (as identified in onshore wells) is not fully<br />
Figure A17-1.—Stratigraphy of the Potomac Group beneath the eastern Delmarva Peninsula (from Hansen,<br />
1984).
136 CHARACTERIZATION OF GEOLOGIC SEQUESTRATION OPPORTUNITIES IN THE <strong>MRCSP</strong> REGION<br />
Figure A17-2.—Outcrop belt of the Potomac Group and the Magothy Formation (from Glaser, 1969).<br />
known, but Hansen (1984) suggests that these offshore units may<br />
represent lower deltaic distributory facies and marine shelf or deltafront<br />
facies, whereas the Waste Gate beds underlying the Delmarva<br />
Peninsula may represent upper deltaic fluvial facies.<br />
The Waste Gate Formation is dated Berriasian to Hauterivian()<br />
because it contains pre-Zone I palynomorphs apparently older than<br />
the mid-Barremian to early Albian assemblages characteristic of the<br />
overlying Patuxent Formation (Doyle, 1982; Hansen, 1982, 1984).<br />
ORIGIN OF NAMES, TYPE SECTION, SIGNIFICANT<br />
EARLIER STUDIES ON THIS INTERVAL<br />
The Waste Gate Formation was originally proposed and defined<br />
in an open-file report by Hansen (1982) and subsequently formally<br />
named in an information circular by Hansen (1984). The type section<br />
was actually designated from the Ohio Oil Company L. G.<br />
Hammond No. 1 well (Maryland <strong>Geologic</strong>al Survey well number
APPENDIX A: LOWER CRETACEOUS WASTE GATE FORMATION<br />
137<br />
Figure A17-3.—Diagram showing the Fall Zone, the Salisbury Embayment<br />
and other tectonic features of the middle Atlantic area (from Hansen, 1978).<br />
Wi-Cg 37) at a depth interval of 4,745 to 5,360 feet. The well was<br />
drilled in Maryland about 22 miles west of the Atlantic coast, about<br />
8.5 miles south of the Delaware state line, and slightly west of a<br />
place referred to as “Waste Gate”. Waste Gate appears to be an<br />
informal name for an area around the intersection of Waste Gate<br />
Road and Route 350 that is in the vicinity of Waste Gate Creek. The<br />
well was drilled in 1944; core descriptions and electric logs were<br />
published by Anderson and others (1948).<br />
NATURE OF LOWER AND UPPER CONTACTS<br />
Hansen (1982) defined the Waste Gate Formation on the basis<br />
of significant differences in age, lithology and petrophysics from<br />
the overlying Patuxent Formation and Arundel Formations. In the<br />
type well, the top of the Waste Gate occurs at a depth of 4,745 feet.<br />
At this depth, the electric log shows a general increase in resistance<br />
associated with sandier intervals (Anderson, 1948, figs. 10 and 20),<br />
and an increase in garnet content (Anderson, 1948, fig. 3). Anderson<br />
(1948, p. 71) noted “the sands below the 4,750 foot level are all<br />
soft, partially consolidated, and poorly sorted and doubtless possess<br />
a relatively high permeability.” However, Anderson (1948) did not<br />
recognize the Waste Gate as a separate unit, instead including these<br />
sediments in the Patuxent Formation.<br />
The Waste Gate is characterized as an overlapped subsurface sequence<br />
of interbedded sandstones and shales; however, the nature<br />
of the upper contact of the Waste Gate Formation is not clearly<br />
defined. Various diagrams in Hansen (1984) seem to emphasize<br />
the undetermined nature of the contact by showing it as a questionable<br />
unconformity or possibly a conformable contact. Due largely<br />
to the paucity of data, it is not clear if significant time is missing at<br />
the contact or how the nature of the contact may vary at different<br />
locations.<br />
Hansen (1982, 1984) reported that palynology data indicate the<br />
sediments from the Waste Gate Formation are “pre-palynozone I of<br />
Brenner (1963),” largely, if not wholly, Berriasian to Hauterivian()<br />
in age, and thus older than the overlying Patuxent Formation (Berrimanian<br />
and younger). However, Hansen did note that, in one well,<br />
an angiosperm type common in the Palynozone I, associated with<br />
the younger (overlying) Patuxent-Arundel Formations (undivided),<br />
was reported in the upper part of an interval assigned to the Waste<br />
Gate, thus leaving open the possibility of upper beds of the Waste<br />
Gate possibly being as young as early Barremian. Therefore, it is<br />
possible that little or no time separates the Waste Gate from the<br />
overlying Patuxent Formation.<br />
In Maryland, the Waste Gate has been penetrated in only four<br />
wells (referred to as Hammond No. 1, Bethards No. 1, DOE Crisfield,<br />
and Esso No. 1), and even fewer penetrate into the underlying<br />
basement rocks. In general, in the vicinity of the Hammond No.<br />
1 well, and to the east of this well, Cretaceous units are underlain<br />
by rocks of Jurassic() or Triassic() age (Anderson and others,<br />
1948; Hansen, 1982). To the west, the Waste Gate Formation is<br />
presumably underlain by older, pre-Mesozoic basement metamorphic<br />
rocks. In the Hammond No. 1 well, there are approximately<br />
135 feet of what are referred to as Triassic() rocks by Anderson<br />
and others (1948) and Jurassic() by Hansen (1982). The top of<br />
the sequence is a hard, indurated quartz conglomerate containing<br />
some white feldspars and lime cement. Below the conglomerate<br />
are hard, reddish-brown and apple-green shales, sandy shales, and<br />
sandstones. In the Bethards No. 1 well, there are approximately 585<br />
feet of Triassic()/Jurassic() rocks (assigned to the Newark series)<br />
characterized by sandstones, sandy shales, and shales with a basal<br />
conglomerate (Anderson and others, 1948).<br />
Anderson and others (1948) indicate that, at the Hammond No. 1<br />
well, the top of the pre-Mesozoic basement contact is characterized<br />
by “rotten schistose rock containing mica, chlorite, and feldspar and<br />
cut by small veins of pegmatite in which the feldspars are almost<br />
entirely decomposed.” This weathered zone was estimated to be<br />
approximately 31 feet thick and underlain by either a biotite-rich<br />
quartzite or a mica gneiss and cut by veins of pegmatite. At the<br />
Bethards No. 1 well, pre-Mesozoic basement rock appears to be<br />
characterized by dark greenish-black gabbros containing joints occasionally<br />
filled with carbonate).<br />
LITHOLOGY<br />
Hansen (1984) described the Waste Gate lithology as follows:<br />
The Waste Gate Formation consists largely of an unconsolidated<br />
to moderately lithified sequence of interbedded light gray to white<br />
arkosic to feldspathic sandstones and drab to occasionally mottled,<br />
silty shales (or clays), often fi nely laminated with carbonaceous<br />
material. Anderson (1948, p. 14) reports that the sandstones<br />
(sands) are relatively poorly sorted, ranging from fi ne to very<br />
coarse-grained with an occasional pebbly bed. The feldspars are<br />
often strongly kaolinized, resulting in a pervasive, clayey matrix<br />
suffi ciently binding to form friable sandstones in place. The more<br />
indurated sandstones are associated with occasional occurrences<br />
of calcareous cement. Core descriptions provided by Anderson and<br />
others (1948, p. 408-412) indicate that about 27 percent of the arenaceous<br />
footage is suffi ciently lithified to be called “sandstone,”
138 CHARACTERIZATION OF GEOLOGIC SEQUESTRATION OPPORTUNITIES IN THE <strong>MRCSP</strong> REGION<br />
a figure perhaps representative of the Waste Gate Formation elsewhere<br />
in Maryland.<br />
Hansen (1984) noted in the Hammond No. 1 well, the formation<br />
is “about 70 percent sandstone (sand); however each unit is relatively<br />
thin and rarely exceeds 100 feet in thickness. In Maryland,<br />
carbonaceous laminae and calcareous sandstones are present in the<br />
Waste Gate, but no coaly seams or limestones have been found.”<br />
Hansen (1982) noted rare occurrences of acritarch cysts found<br />
within the Waste Gate Formation in the Bethards No. 1 well. A more<br />
detailed discussion of the palynology can be found in Doyle (1982)<br />
and Hansen (1982).<br />
Sandstone porosities estimated from geophysical logs generally<br />
range from 19 to 27 percent (Hansen 1982). Based on aquifer tests<br />
of a well in Crisfield, Maryland, transmissivities of 340 to 430<br />
gallons/day/foot and hydraulic conductivities of 4 to 5 gallons/day/<br />
square foot were recorded (Hansen, 1984). Based on limited test<br />
data, Hansen (1984) suggested that the Waste Gate sandstones are<br />
likely to have relatively low permeabilities in comparison to other<br />
Coastal Plain aquifers, perhaps on the order of 15 to 150 md.<br />
It should be noted that younger units in the Potomac Group include<br />
aquifers that are an important source of fresh water supply, particularly<br />
in areas west of the Chesapeake Bay in Maryland and in some<br />
communities on the Delmarva Peninsula. However, under much of<br />
the Delmarva Peninsula, the deep Potomac units, including the Waste<br />
Gate Formation, are saturated with salty water ranging from slightly<br />
brackish to brines with salinities greater than seawater.<br />
DISCUSSION OF DEPTH AND THICKNESS RANGES<br />
The top of the Waste Gate Formation ranges from a depth of<br />
about 3,500 feet at its up-dip limit to 5,670 feet near the coast (Hansen,<br />
1984) (Figure A17-4). The Waste Gate Formation is estimated<br />
to range in thickness from zero feet thick at its up-dip pinchout to<br />
about 1,515 feet thick near the Delmarva coast (Hansen, 1984) (Figure<br />
A17-5). Hansen (1984) indicate that the Waste Gate Formation<br />
thins relatively rapidly by onlap under the Delamarva Peninsula.<br />
The location of the up-dip edge of the unit is poorly defined because<br />
of a lack of data, but the pinchout line is estimated to trend roughly<br />
northeast-southwest through the middle of the Delmarva Peninsula,<br />
based the unit’s absence in the few wells in the western part of the<br />
Peninsula that penetrate to pre-Mesozoic basement.<br />
DEPOSITIONAL ENVIRONMENTS/<br />
PALEOGEOGRAPHY/TECTONISM<br />
In early Cretaceous time, Potomac Group sedimentation began<br />
to occur as the Piedmont and Blue Ridge provinces were uplifted.<br />
These sediments were deposited eastward in a broad, open basin<br />
(Glaser, 1969). This basin is referred to as the Salisbury Embayment<br />
(formerly referred to as the Chesapeake-Delaware Embayment)<br />
(Figure A17-3). Glaser (1969, p. 74) also indicated that deposition<br />
probably “ began near or somewhat beyond the present coast line”<br />
and then “…apparently migrated slowly westward toward the present<br />
day outcrop belt” (Figure A17-2). According to Glaser (1969)<br />
by the time Patuxent Formation sediments were being deposited,<br />
the Early Cretaceous fall line or basin margin was located, perhaps,<br />
only a few miles inland from the present outcrop margin.<br />
It should also be noted that the gradient of the surface of the pre-<br />
Mesozoic basement appears to vary, apparently increasing from<br />
west/northwest to east on the Delmarva Peninsula. The apparent dip<br />
of the basement surface between a well on the western side of the<br />
Delmarva Peninsula (at Cambridge, Maryland) and the Hammond<br />
well (central Delmarva Peninsula) is on the order of 64 feet per mile,<br />
whereas the apparent dip between the Hammond well and Bethards<br />
well on the eastern edge of the Delmarva Peninsula is roughly 150<br />
feet per mile. Given the paucity of wells that penetrate into pre-<br />
Mesozoic basement rocks in the Delmarva Peninsula, the nature of<br />
the basement surface is not fully characterized (e.g., the extent to<br />
which there is local relief) and it is not clear if this apparent change<br />
in surface gradient between the two wells may be the result of pre-<br />
Mesozoic erosion (e.g., a canyon), warping, a structural feature, or<br />
some combination of the three. Hansen (1978) noted that the change<br />
in gradient that occurs within about 10 to 15 miles of the coast, that<br />
is, between the Hammond No. 1 and Bethards No. 1 wells, suggests<br />
the presence of a tectonic hinge zone that might define the shoreward<br />
edge of the Baltimore Canyon Trough (Figure A17-3).<br />
Rare occurrences of marine or brackish-water fossils have been<br />
noted within the Waste Gate Formation (Hansen, 1984) but, overall,<br />
the majority of evidence suggests the formations originated<br />
in a high-energy, alluvial setting dominated by fluvial channel facies<br />
proximal to the early Cretaceous Fall Line. Hansen (1984)<br />
noted that self-potential (SP) log signatures of the sandstones have a<br />
blocky aspect, suggestive of braided or stacked sand-channel deposition,<br />
rather than the well-defined, fining-upward cycles generally<br />
ascribed to deposition by meandering streams. This suggests deposition<br />
in a high-energy alluvial complex. In addition, Doyle (1982)<br />
reported that samples from the Waste Gate Formation suggest deposition<br />
in a humid tropical climatesuch as would be found in the<br />
southern Laurasian continent during the Early Cretaceous.<br />
SUITABILITY AS A CO 2<br />
INJECTION TARGET OR SEAL UNIT<br />
Porosities of the Waste Gate sandstone, as estimated from compensated<br />
formation density logs and s electric logs, range from 19<br />
to 27 percent (Hansen, 1982, tab. 4). In general, porosity decreases<br />
with increasing depth (Table A17-1). In the shallowest (3,900 to<br />
4,225 feet) of five wells penetrating the Waste Gate in Maryland,<br />
direct pumping tests yielded sandstone permeabilities in the range<br />
of 75 to 120 md; the Schlumberger method yielded similar results<br />
of 63 to 122 md. In general, permeability decreases with increasing<br />
depth, falling in the range of 16 to 122 md (Table A17-1).<br />
Chemical analyses of the formation waters from two Waste Gate<br />
aquifers revealed brines with chloride concentrations of 42,000<br />
mg/l, and salinity (equivalent NaCl concentration) estimates from<br />
electric log data ranged from roughly 25,000 to 94,000 ppm (Hansen,<br />
1982, ttabs.. 5 and 6). Salinity increases with depth and are a<br />
calcium/sodium chloride type. These waters are at normal hydrostatic<br />
pressure and exhibit very lethargic to stagnant flow systems<br />
(Hansen, 1984) (Table A17-1).<br />
Hansen (1982, 1984) evaluated the Waste Gate Formation for potential<br />
for extraction of chemical commodities such as commercial<br />
brines, extraction of geothermal heat, and disposal of hazardous/liquid<br />
waste. Perhaps most pertinent to considerations for CO 2 injection<br />
is the hazardous/liquid waste evaluation.<br />
Hansen (1984, p. 18) notes:<br />
The fl uvial-deltaic Waste Gate Formation is not ideal for well<br />
injection because of its complex sand stratigraphy. Individual aquifers<br />
and confining beds are only locally correlative. The geometry of<br />
each sand body is complex. With sparse well control, it is impossible<br />
to predict unequivocally whether a potential reservoir is laterally<br />
connected with an adjacent sand or whether it wedges out within a
APPENDIX A: LOWER CRETACEOUS WASTE GATE FORMATION<br />
139<br />
EXPLANATION<br />
M A R Y L A N D<br />
500 ft contours<br />
Mean sea elevation (feet)<br />
-3500<br />
-5500<br />
U T<br />
H E S O<br />
-4000<br />
-4500<br />
-5000<br />
-5500<br />
U N I T P I N C<br />
20 10 0 20 40 Miles<br />
³<br />
20 10 0 20 40 Kilometers<br />
Figure A17-4.—Structure contour map drawn on the top of the Waste Gate Sandstone.
140 CHARACTERIZATION OF GEOLOGIC SEQUESTRATION OPPORTUNITIES IN THE <strong>MRCSP</strong> REGION<br />
EXPLANATION<br />
500 ft Index contours<br />
M A R Y L A N D<br />
100 ft contours<br />
Thickness in feet<br />
1500<br />
0<br />
O U T<br />
C H E S<br />
U N I T P I N<br />
0<br />
500<br />
1000<br />
1500<br />
20 10 0 20 40 Miles<br />
25 12.5 0 25 50 Kilometers<br />
³<br />
Figure A17-5.—Map showing the thickness of the Waste Gate Sandstone.
APPENDIX A: LOWER CRETACEOUS WASTE GATE FORMATION<br />
141<br />
Table A17-1.—Summary of depth, thickness, porosity, permeability and salinity<br />
of the Waste Gate Formation (adapted from Hansen, 1982)<br />
Well Name<br />
Depth (ft.)<br />
Thickness<br />
(ft.)<br />
Estimated Estimated Salinity<br />
Sandstone Permeability (equivalent NaCl)<br />
Porosity (%) (millidarcies) (parts per million)<br />
DOE Crisfi eld Airport 3,900-4,225 325 24-27 1 75-120 3 33,700 5<br />
63-122 4 72,000-80,000 6<br />
J & J Taylor 4,975-5,915 940 21-24 1 29-63 4 24,700 5<br />
91,300 6<br />
Ohio Hammond 4,745-5,360 615 23-27 2 49-122 4 50,400 5<br />
53,700 6<br />
Socony-Mobil Bethards 5,020-6,565 1,545 19-24 2 16-63 4 70,200 5<br />
97,400 6<br />
Esso Ocean City 5,670-7,180 510 19-24 2 16-63 4 73,800 5<br />
94,300 6<br />
1<br />
Compensated formation density log method<br />
2<br />
Short normal electric log method<br />
3<br />
Pumping test<br />
4<br />
Schlumberger formula<br />
5<br />
Self-Potential method<br />
6<br />
Resistivity method<br />
clayey confining bed. As a consequence, the isolation of an individual<br />
sand can never be assured. In practical terms the waste disposal<br />
reservoir should be viewed as including not only the injection zone,<br />
but one or two adjacent sands as well. Because the Waste Gate Formation<br />
is hydrologically isolated from the shallow fresh-water fl ow<br />
system, this contingency should not preclude waste injection unless<br />
local conjunctive use of the Waste Gate is anticipated.<br />
By restricting injecting pressures to 0.64 psi/ft, the minimum<br />
pressure gradient at which hydraulic fracturing theoretically occurs,<br />
Hansen (1982) has estimated that a 75-foot thick Waste Gate<br />
sand could be expected to accept a waste stream of 30 to 115 gpm<br />
for fl uids ranging in viscosity between 1 to 2.2 centipoises. Pretreatment<br />
of the waste prior to injection may be required to prevent<br />
deterioration of formation permeability due to precipitate reactions<br />
between waste water and the formation water and matrix. For example,<br />
certain types of acidic wastes may react with the feldspathic<br />
aquifer material . . . producing clays that might reduce aquifer permeability<br />
near the disposal well. At the very least entrained gasses<br />
and suspended solids must be removed from the wastewater prior<br />
to injection.<br />
Hansen (1984, p. 20) concluded that the hydrogeologic setting<br />
of the Waste Gate Formation is suitable for liquid waste disposal.<br />
Transmissivity and storage properties should be sufficient to accept<br />
wastewater in economic volumes within prescribed injection pressures.<br />
Thirty to 115 gallons per minute of liquid waste could be injected<br />
into typical Waste Gate sandstone without fracturing the rock<br />
or its confining beds. By increasing the number of sandstone beds<br />
within the injection target, larger volumes of liquid waste should be<br />
able to be injected with no adverse affects.
142 CHARACTERIZATION OF GEOLOGIC SEQUESTRATION OPPORTUNITIES IN THE <strong>MRCSP</strong> REGION<br />
REFERENCES CITED<br />
Abel, K.D., and Heyman, Louis, 1981, The Oriskany Sandstone in the<br />
subsurface of Pennsylvania. Pennsylvania <strong>Geologic</strong>al Survey, 4th ser.,<br />
Mineral Resource <strong>Report</strong> 81, 9 p.<br />
Adams, M.A., 1984, <strong>Geologic</strong> overview, coal resources, and potential methane<br />
recovery from coalbeds of the central Appalachian Basin—Maryland,<br />
West Virginia, Virginia, Kentucky, and Tennessee, in Rightmire, C.T.,<br />
Eddy, G.E., and Kirr, J.N., eds., Coalbed methane resources of the United<br />
States: American Association of Petroleum Geologists, Studies in Geology,<br />
v. 17, p. 45-72.<br />
Alexander, S.S., Cakir, R., Doden, A.G., Gold, D.P., and Root, S.I., in press,<br />
Basement depth and related geospatial database for Pennsylvania: Pennsylvania<br />
<strong>Geologic</strong>al Survey.<br />
Alty, S.W., 1933, <strong>Report</strong> of an investigation of Sylvania rocks in oil wells of<br />
the Michigan Basin: Michigan Academy of Science, Arts, Letters, Papers,<br />
v. 18, p. 289-300.<br />
American Gas Association, 2001, Underground storage of natural gas in the<br />
United States and Canada: 2001, pp. 80-86.<br />
Anderson, J.L. and others, 1948, Cretaceous and Tertiary subsurface geology:<br />
Maryland Department of Geology, Mines, and Water Resources<br />
Bulletin 2, 456 p.<br />
Anderson, W.H., 1991, Mineralization and hydrocarbon emplacement in<br />
the Cambrian-Ordovician Mascot Dolomite of the Knox Group in southcentral<br />
Kentucky. Kentucky <strong>Geologic</strong>al Survey <strong>Report</strong> of Investigation<br />
4, 31 p.<br />
Appalachian Basin Resource Assessment Team, 2002, 2000 resource assessment<br />
of selected coal beds and zones in the northern and central Appalachian<br />
basin coal regions: U.S. <strong>Geologic</strong>al Survey Professional Paper<br />
1625-C, CD-ROM.<br />
Arkle, T., 1974, Stratigraphy of the Pennsylvanian and Permian Systems of<br />
the central Appalachians: <strong>Geologic</strong>al Society of America Special Paper<br />
148, p. 5-45.<br />
Arkle, T., Beissel, D.R., Larese, R.E., and 7 others, 1979, The Mississippian<br />
and Pennsylvanian (Carboniferous) Systems in the United States—West<br />
Virginia and Maryland: U.S. <strong>Geologic</strong>al Survey Professional Paper 1110-<br />
D, 35 p.<br />
Arnold, C.A., 1949, Fossil flora of the Michigan coal basin: Contributions<br />
fro m the Museum of Paleontology, University of Michigan, p. 131-269.<br />
Ashburner, C.A., 1888, Petroleum and natural gas in New York State. American<br />
Institute of Mining Engineers Transactions, v. 16, p. 906-959.<br />
Avary, K. L., 1996, The Lower Silurian Tuscarora Sandstone fractured<br />
anticlinal play, in Roen, J. B., and Walker, B. J., eds., The atlas of major<br />
Appalachian gas plays. West Virginia <strong>Geologic</strong>al and Economic Survey,<br />
Publication V 25, p. 151-155.<br />
Avary, K.L., 2004, Recent coal bed methane activity in West Virginia:<br />
American Association of Petroleum Geologists 33 rd annual Eastern Section<br />
meeting Program with Abstracts, Columbus, Ohio, p. 56.<br />
Baranoski, M.T., 2002, Structure contour map on the Precambrian unconformity<br />
surface in Ohio and related basement features: Ohio Division of<br />
<strong>Geologic</strong>al Survey Map PG-23, scale 1:500,000, (18 p. text).<br />
Baranoski, M.T., in preparation, Subsurface Correlation and Lithostratigraphy<br />
of the Cambrian Mount Simon Sandstone, Eau Claire Formation, and<br />
Conasauga Group in Ohio: Ohio Division of <strong>Geologic</strong>al Survey.<br />
Baranoski, M.T., Riley, R.A, and Wolfe, M.E., 1996, Cambrian-Ordovician<br />
Knox Group unconformity play, in J.B. Roen and B.J. Walker, eds., The<br />
atlas of major Appalachian gas plays: West Virginia <strong>Geologic</strong>al and Economic<br />
Survey Publication V 25, p. 181-187.<br />
Barnes, D.A., Harrison, W.B. and Shaw, T.H., 1996, Lower-Middle Ordovician<br />
lithofacies and interregional correlation, Michigan basin, U.S.A.,<br />
in Witzke, B.J., Ludvigson, G.A. and Day, J. eds., Paleozoic Sequence<br />
Stratigraphy: Views from the North American Craton: Boulder, Colorado,<br />
<strong>Geologic</strong>al Society of America Special Paper 306, p. 35-54.<br />
Barnes, D.A., Lundgren, C.E. and Longman, M.W., 1992, Sedimentology<br />
and Diagenesis of the St. Peter Sandstone, Central Michigan Basin,<br />
United States: American Association of Petroleum Geologist Bulletin, v.<br />
76, no. 10, p. 1507-1532.<br />
Barrett, S.F., and Isaacson, P.E., 1977, Faunal assemblages developed in a<br />
coarse clastic sequence, in Gray, Jane, Boucot, A. J., and Berry, W. B.,<br />
eds., Communities of the past: Dowden, Hutchinson & Ross, Stroudsburg,<br />
PA., p. 165-183.<br />
Basan, P.B., Kissling, D.L., Hemsley, K.D., Kersey, D.G., Dow, W.G.,<br />
Chaiffetz, M.S., Isaacson, P., Barrett, S., and Carne, L., 1980, <strong>Geologic</strong>al<br />
study and reservoir evaluation of Early Devonian formations of the Appalachians:<br />
Robertson Research (U.S.) Inc., 263 p.<br />
Beardsley, R.W. and Cable, M.S., 1983, Overview of the evolution of the<br />
Appalachian Basin: Northeastern Geology, v. 5, nos. 3 and 4, p. 137.<br />
Becker, L.E., Hreha, A.J., and Dawson, T.A., 1978, Pre-Knox (Cambrian)<br />
stratigraphy in Indiana: Indiana Department of Natural Resources, <strong>Geologic</strong>al<br />
Survey, Bulletin 57, 72 p.<br />
Benson, R. N., Jordan, R. R., and Spoljaric, N., 1985, <strong>Geologic</strong>al studies<br />
of Cretaceous and Tertiary section, test well Je32-04, central Delaware:<br />
Delaware <strong>Geologic</strong>al Survey Bulletin 17, 69 p.<br />
Bentall, Ray, and Collins, J. B., 1945, Subsurface stratigraphy and structure<br />
of the pre-Trenton Ordovician and the Upper Cambrian rocks of central<br />
Tennessee. Tennessee Division of Geology, Oil and Gas Investigation<br />
Preliminary Chart 4, 2 sheets, scale 1:1,000,000.<br />
Berg, T.M., 1981, Subsurface stratigraphy, in Berg, T.M., Crowl, G.H., Edmunds,<br />
W.E., Luce, P.B., Sevon, W.D., Wilshusen, J.P., Woodrow, D.L.,<br />
and Pohn, H.A. (leaders), Geology of Tioga and Bradford counties, Pennsylvania:<br />
Guidebook for the Annual Field Conference of Pennsylvania<br />
Geologists, no. 46, p. 5-9.<br />
Berg, T.M., McInerney, M. K., Way, J. H., and MacLachlan, D. B., 1986,<br />
Stratigraphic correlation chart of Pennsylvania, revised. Pennsylvania<br />
<strong>Geologic</strong>al Survey, 4 th series, General Geology <strong>Report</strong> 75.<br />
Bergstrom, S.M., and Mitchell, C.E., 1992, The Ordovician Utica Shale in<br />
the eastern midcontinent region: Age, lithofacies, and regional relationships:<br />
Oklahoma <strong>Geologic</strong>al Survey Bulletin 145, p. 67-89.<br />
Berkey, C.P., 1897, Geology of the Saint Croix Dalles: American Geologist,<br />
v. 20, p. 345-383.<br />
Bickford, M.E., Van Schmus, W.R., and Zietz, Isidore, 1986, Proterozoic<br />
history of the Midcontinent region of North America: Geology, v. 14, p.<br />
492-496.<br />
Blakey, R., 2005, .<br />
Boswell, R., 1996, Upper Devonian black shales, in J.B. Roen, and B.J.<br />
Walker, eds., The atlas of major Appalachian gas plays: West Virginia<br />
<strong>Geologic</strong>al and Economic Survey Publication V-25, p. 93-99.<br />
Bradley, W. H., and Pepper, J. F., 1938, <strong>Geologic</strong> structure and occurrence of<br />
gas in part of southwestern New York: Part 1. Structure and gas possibilities<br />
of the Oriskany Sandstone in Steuben, Yates, and parts of the adjacent<br />
counties: U.S. <strong>Geologic</strong>al Survey Bulletin 899-A, 68 p.<br />
Brenner, G. J., 1963, The spores and pollen of the Potomac Group: Maryland<br />
Department of Geology, Mines and Water Resources Bulletin 27, 215 p.<br />
Brett, C. E., and Caudill, F. R., eds, 2004, <strong>Geologic</strong> overview of the Trenton<br />
Group at West Canada Creek, New York. .<br />
Brett, C.E., Tepper, D.H., Goodman, W.M., LoDuca, S.T., and Eckert, B.,<br />
1995, Revised stratigraphy and correlations of the Niagaran Provincial<br />
Series (Medina, Clinton, and Lockport Groups) in the type area of western<br />
New York. U.S. <strong>Geologic</strong>al Survey Bulletin 2086, 66 p.<br />
Brezinski, D.K., 1991, Lithostratigraphy of the Lower Cambrian Tomstown<br />
Formation [abs.] <strong>Geologic</strong>al Society of America, Abstracts with Programs,<br />
v. 3, p. 10.<br />
Bricker, D.M., Milstein, R.L., and Reszka, C.R., 1983, Selected studies<br />
of Cambro-Ordovician sediments within the Michigan Basin: Michigan<br />
Department of Natural Resources, <strong>Geologic</strong>al Survey Division, <strong>Report</strong> of<br />
Investigations 26, 54 p.<br />
Brown, L., Jensen, L., Oliver, J., Kaufman, S., and Steiner, D., 1982, Rift<br />
structure beneath the Michigan Basin from COCORP profiling: Geology,<br />
v. 10, p. 645-649.<br />
Brown, P.M., Miller, J.A., and Swain, F.M., 1972, Structural and stratigraphic<br />
framework, and spatial distribution of permeability of the Atlantic<br />
coastal plain, North Carolina to New York: U.S. <strong>Geologic</strong>al Survey,<br />
Professional Paper 796, 79 p.<br />
Bruner, K.R., 1988, Sedimentary facies of the Lower Devonian Oriskany
APPENDIX A: REFERENCES CITED<br />
143<br />
Sandstone, Greenbrier County, West Virginia, in Smosna, R., organizer, A<br />
walk through the Paleozoic of the Appalachian basin: American Association<br />
of Petroleum Geologists, Eastern Section Meeting, Core Workshop,<br />
Charleston, WV, p. 38-47.<br />
Bruner, K.R., and Smosna, Richard, 2002, Cherty sponge reefs in the Devonian<br />
Onondaga Limestone: Newly discovered gas reservoir in Pennsylvania.<br />
Northeastern Geology and Environmental Sciences, v. 24, p.<br />
185-191.<br />
Buschbach, T.C., 1984, New Madrid seismotectonic study: activities during<br />
fiscal year 1982: U.S. Nuclear Regulatory Commission <strong>Report</strong> NUREG/<br />
CR-3768, 166p.<br />
Butts, Charles, 1918, <strong>Geologic</strong> section of Blair and Huntington Counties<br />
central Pennsylvania; American Journal of Science, v. 46, p. 523-537.<br />
Butts, Charles, 1940, Geology of the Appalachian Valley in Virginia; Part 1:<br />
Virginia <strong>Geologic</strong>al Survey Bulletin, no. 52, 568 p.<br />
Calvin, Samuel, 1906, Geology of Winneshiek County: Iowa <strong>Geologic</strong>al<br />
Survey Annual <strong>Report</strong>, v. 16, p. 37-146.<br />
Calvert, W.L., 1974, Sub-Trenton structure of Ohio, with views on isopach<br />
maps and stratigraphic sections as basis for structural myths in Ohio, Illinois,<br />
New York, Pennsylvania, West Virginia, and Michigan: American<br />
Association of Petroleum Geologists, Bulletin, v. 58, p. 957-972.<br />
Campbell, M.R., 1894, Description of the Estillville sheet, Kentucky-<br />
Virginia-Tennessee: U.S. <strong>Geologic</strong>al Survey <strong>Geologic</strong> Atlas, Folio 12.<br />
Campbell, M. R. 1898, Richmond folio: U.S. <strong>Geologic</strong>al Survey Atlas 46.<br />
Cardwell, D.H., 1977, West Virginia gas development in Tuscarora and<br />
deeper formations (with structural maps contoured on the top of Ordovician<br />
and Precambrian), West Virginia <strong>Geologic</strong>al and Economic Survey,<br />
Mineral Resources Series MRS-8, 34p.<br />
Carman, J.E., 1936, Sylvania Sandstone of northwestern Ohio: <strong>Geologic</strong>al<br />
Society of America Bulletin v. 47, p. 253-266.<br />
Castle, J.W., 1998, Regional sedimentology and stratal surfaces of a Lower<br />
Silurian clastic wedge in the Appalachian foreland basin: Journal of Sedimentary<br />
Research, v. 68, no. 6, p. 1201-1211.<br />
Catacosinos, P.A., 1973, Cambrian lithostratigraphy of Michigan Basin:<br />
American Association of Petroleum Geologists, Bulletin, v. 57, p. 2404-<br />
2418.<br />
Catacosinos, P.A., and Daniels, P.A., Jr., 1991, Stratigraphy of middle<br />
Proterozoic to Middle Ordovician formations of the Michigan Basin, in<br />
Catacosinos, P.A., and Daniels, P.A., Jr. (eds.), Early Sedimentary Evolution<br />
of the Michigan Basin: <strong>Geologic</strong>al Society of America Special Paper<br />
256, p. 53-71.<br />
Catacosinos, P.A., Harrison III, W.B., and Daniels, P.A., Jr., 1990, Structure,<br />
Stratigraphy, and Petroleum Geology of the Michigan Basin in Leighton,<br />
M.W., Kolata, D.R., Oltz, D.F., and Eidel, J.J., Interior Cratonic Basins:<br />
American Association of Petroleum Geologists Memoir 51, p. 561-601.<br />
Catacosinos, P.A., Westjohn, D.B., Harrison, W.B., III, Wollensak, M.S.,<br />
and Reynolds, R.F., 2001, Stratigraphic lexicon for Michigan. Michigan<br />
<strong>Geologic</strong>al Survey Division and Michigan Basin <strong>Geologic</strong>al Society Bulletin<br />
8, 56 p.<br />
Cecil, C.B., and Edgar, N.T., eds., 1994, Predictive stratigraphic analysis—<br />
Concept and application: U.S. <strong>Geologic</strong>al Survey Bulletin 2110, 72 p.<br />
Cecil, C.B., Stanton, R.W., Neuzil, S.G., Dulong, F.T., Ruppert, C.F., and<br />
Pierce, B.S., 1985, Paleoclimate controls on Late Paleozoic sedimentation<br />
and peat formation in the central Appalachian basin (U.S.A.): International<br />
Journal of Coal Geology, v. 5, p. 195-230.<br />
Chesnut, Jr., D.R., 1992, Stratigraphic and structural framework of the Carboniferous<br />
rocks of the central Appalachian basin in Kentucky: Kentucky<br />
<strong>Geologic</strong>al Survey Bulletin 3, 42 p.<br />
Cleaves, A.B., 1939, Oriskany Group, in Willard, B., Swartz, F.M., and<br />
Cleaves, A.B., The Devonian of Pennsylvania: Pennsylvania <strong>Geologic</strong>al<br />
Survey, 4th ser., General Geology <strong>Report</strong> 19, p. 92-130.<br />
Clifford, M. J., 1973, Silurian rock salt of Ohio: Ohio Division of <strong>Geologic</strong>al<br />
Survey <strong>Report</strong> of Investigations 90, 42 p.<br />
Clifford, M. J., 1975, Subsurface liquid-waste injection in Ohio: Ohio Division<br />
of <strong>Geologic</strong>al Survey Information Circular 43, 27 p.<br />
Cohee, G. V., 1948, Cambrian and Ordovician rocks in Michigan basin and<br />
adjoining areas: American Association of Petroleum Geologists Bulletin,<br />
v. 32, p. 1417-1448.<br />
Cole, G.A., Drozd, R.J., Sedivy, R.A., and Halpern, H.I., 1987, Organic<br />
geochemistry and oil-source correlations, Paleozoic of Ohio: American<br />
Association of Petroleum Geologists Bulletin, v. 71, p. 788-809.<br />
Collins, H.R., 1979, The Mississippian and Pennsylvanian (Carboniferous)<br />
Systems in the United States—Ohio: U.S. <strong>Geologic</strong>al Survey Professional<br />
Paper 1110-E: 26 p.<br />
Collinson, C., Sargent, M.L. and Jennings, J.R., 1988, Illinois Basin Region,<br />
in Sloss, L.L. ed., Sedimentary cover—North American Craton; U.S.:<br />
<strong>Geologic</strong>al Society of America, The Geology of North America, v. D-2,<br />
p. 383-426.<br />
Conrad, J.M., 1987, Stratigraphy, structure, and hydrocarbon production of<br />
the Silurian Lockport Dolomite in eastern Kentucky and Wayne County,<br />
West Virginia: West Virginia University, Morgantown, M.S. thesis, 129 p.<br />
Conrad, T.A., 1837, First annual report on the geological survey of the third<br />
district of the State of New York: New York <strong>Geologic</strong>al Survey, 1 st Annual<br />
<strong>Report</strong>, p. 155-186.<br />
Coogan, A.H. and Lesser, Gustavo, 1991, Structural and paleotopographic<br />
mapping-Keys to high productivity Cambrian Rose Run wells in eastern<br />
Ohio [abs.}, in Exploration strategies in the Appalachian basin: 22nd Annual<br />
Appalachian Petroleum Geology Symposium, Morgantown, WV,<br />
I.C. White Memorial Fund Pub. 3, p. 19-20.<br />
Cotter, E., 1982, Tuscarora Formation of Pennsylvania: Society of Economic<br />
Paleontologists and Mineralogists, Eastern Section, Field Trip<br />
Guidebook, 105 p.<br />
Cotter, E., 1983, Shelf, paralic, and fluvial environments and eustatic<br />
sea-level fluctuations in the origin of the Tuscarora Formation (Lower<br />
Silurian) of central Pennsylvania: Journal of Sedimentary Petrology, v.<br />
53, p. 25-49.<br />
Cressman, E. R., 1973, Lithostratigraphy and depositional environments of<br />
the Lexington Limestone (Ordovician) of central Kentucky: U.S. <strong>Geologic</strong>al<br />
Survey Professional Paper 768, 61 p.<br />
Cressman, E. R., and Peterson, W. L., 2001, Ordovician System, in Contributions<br />
to the geology of Kentucky .<br />
Cross, A.T., and Schemel, M.P., 1956, Geology and economic resources of<br />
the Ohio River Valley in West Virginia: West Virginia <strong>Geologic</strong>al Survey,<br />
v. 22, 149 p.<br />
Culotta, R.C., Pratt, T., and Oliver, J., 1990, A tale of two sutures: COCORP<br />
deep seismic surveys of the Grenville Province in the eastern U.S. Midcontinent:<br />
Geology, v. 18, p. 646-649.<br />
Cushing, E.M., Kantrowitz, I.H., and Taylor, K.R., 1973, Water resources<br />
of the Delmarva Peninsula: U.S. <strong>Geologic</strong>al Survey, Professional Paper<br />
822, 58 p.<br />
Dana, J. D., 1863, Manual of Geology, 1 st ed: Theodore Bliss and Company,<br />
Philadelphia, 800 p.<br />
Daniels, P.A., Jr.,1982, Upper Precambrian sedimentary rocks: Oronto<br />
Group, Michigan-Wisconsin, in Wold, R.J., and Hinze, W.J., eds., Tectonic<br />
history of the Lake Superior Basin: <strong>Geologic</strong>al Society of America<br />
Memoir 156, p. 107-133.<br />
Darton, N.H., 1896, Franklin folio: U. S. <strong>Geologic</strong>al Survey, Folio 32.<br />
Darton, N.H., and Taff, J.A., 1896, Piedmont folio: U. S. <strong>Geologic</strong>al Survey,<br />
Folio 28.<br />
Dean, S, and Baranoski, M, 2002a, Ohio Precambrian-1: A look at western<br />
Ohio’s Precambrian tectonic setting: Oil and Gas Journal, July 22, 2002, 6 p.<br />
Dean, S, and Baranoski, M, 2002b, Ohio Precambrian-2: Deeper study of<br />
Precambrian warranted in western Ohio: Oil and Gas Journal, July 29,<br />
2002, p. 37-40.<br />
Decker, D., Coates, J.M.P., and Wicks, D., 1992, Stratigraphy, Gas Occurrence,<br />
Formation Evaluation and Fracture <strong>Characterization</strong> of the Antrim<br />
Shale, Michigan Basin: Gas Research Institute Topical <strong>Report</strong> GRI-92/<br />
0258.1, 306 p.<br />
Dellwig, L.F., and Evans, Robert, 1969, Depositional processes in Salina salt<br />
of Michigan, Ohio, and New York: American Association of Petroleum<br />
Geologists Bulletin, v. 53, p. 949-956.<br />
Demicco, R.V., 1983, Wavy and lenticular-bedded carbonate ribbon rocks<br />
of the Upper Cambrian Conococheague limestone, central Appalachians:<br />
Journal of Sedimentary Petrology, v. 53, p. 1121-1132.<br />
Demicco, R.V., 1985, Platform and off-platform carbonates of the Upper<br />
Cambrian of western Maryland, U.S.A.: Sedimentology, v. 32, p. 1-22.<br />
Denison, R.E., Lidiak, E.G., Bickford, M.E., and Kisvarsanyi, E.G., 1984,
144 CHARACTERIZATION OF GEOLOGIC SEQUESTRATION OPPORTUNITIES IN THE <strong>MRCSP</strong> REGION<br />
Geology and geochronology of Precambrian rocks in the Central Interior<br />
Region of the United States: U. S. <strong>Geologic</strong>al Survey Professional Paper<br />
1241-C, 20 p.<br />
Dennison, J. M., 1961, Stratigraphy of the Onesquethaw Stage of Devonian<br />
in West Virginia and bordering states: West Virginia <strong>Geologic</strong>al and Economic<br />
Survey, Bulletin 22, 87 p.<br />
Dennison, J.M., and Head, J.W., 1975, Sea level variations interpreted from<br />
the Appalachian basin Silurian and Devonian: American Journal of Science,<br />
v. 275, p. 1089-1120.<br />
de Witt, W., Jr., Roen, J.B., and Wallace, L.G. 1993, Stratigraphy of Devonian<br />
Black Shales and Associated Rocks in the Appalachian Basin, in J.<br />
B. Roen, and R. C. Kepferle, eds., Petroleum geology of the Devonian<br />
and Mississippian black shale of Eastern North America, U. S. <strong>Geologic</strong>al<br />
Survey Bulletin 1909, U.S. Government Printing Office, p. B1-B57.<br />
Dickas, A.B., 1986, Comparative Precambrian stratigraphy and structure<br />
along the Mid-Continent Rift: American Association of Petroleum Geologists,<br />
v. 70, p. 225-238.<br />
Diecchio, R.J., 1985, Regional controls of gas accumulation in Oriskany<br />
Sandstone, central Appalachian basin: American Association of Petroleum<br />
Geologists Bulletin, v. 69, p. 722-732.<br />
Diecchio, R.J., Jones, S.E., and Dennison, J.M., 1983, Oriskany Sandstone—Regional<br />
stratigraphic relationships and production trends: West<br />
Virginia <strong>Geologic</strong>al and Economic Survey, Map WV-17.<br />
Dietz, R.S., 1972, Geosynclines, mountains, and continent building: Scientific<br />
American, v. 226, no. 3, p. 30-38.<br />
Donaldson, A.C., 1974, Pennsylvanian sedimentation of central Appalachians,<br />
in Briggs, G. ed., Carboniferous of the southeastern United States:<br />
<strong>Geologic</strong>al Society of America Special Paper 148, p. 47-78.<br />
Donaldson, A.C., Renton, J.J., and Presley, M.W., 1985, Pennsylvanian deposystems<br />
and paleoclimates of the Appalachians: International Journal<br />
of Coal Geology, v. 5, p. 167-193.<br />
Dorobek, S. L., and Read, J. F., 1986, Sedimentology and basin evolution of<br />
the Siluro-Devonian Helderberg Group, central Appalachians: Journal of<br />
Sedimentary Petrology, v. 56, p. 601-613.<br />
Dorsch, Joachim, Bambach, R.K., and Driese, S.G., 1994, Basin-rebound<br />
origin for the “Tuscarora unconformity” in southwestern Virginia and its<br />
bearing on the nature of the Taconic Orogeny: American Journal of Science,<br />
v. 294, p. 237-255.<br />
Dott, R.H., and Batten, R.L, 1976, Evolution of the Earth: McGraw-Hill<br />
Book Co., New York, 2d ed., 504 p.<br />
Dott, R.H. Jr., and Byers, C.W., 1981, SEPM Research Conference on modern<br />
shelf and ancient cratonic sedimentation—the orthoquartzite suite<br />
revisited: Journal of Sedimentary Petrology, v. 51, p. 330-346.<br />
Doyle, J.A., 1982, Palynology of continental Cretaceous sediments, Crisfield<br />
geothermal test well, eastern Maryland in Waste Gate Formation, Part<br />
Two: Maryland <strong>Geologic</strong>al Survey Open-File <strong>Report</strong>, p. 51-87.<br />
Drahovzal, J.A., 1997, Proterozoic sequences and their implications for<br />
Precambrian and Cambrian geologic evolution of western Kentucky:<br />
Evidence from seismic-reflection data: Seismological Research Letters,<br />
v. 68, no. 4, p. 553-566.<br />
Drahovzal, J.A. and Harris, D.C., 2004, Potential Reservoirs for <strong>Geologic</strong><br />
Sequestration in the East Continent Rift Basin: .<br />
Drahovzal, J.A., Harris, D.C., Wickstrom, L.H., Walker, Dan, Baranoski,<br />
M.T., Keith, B. D., and Furer, L.C., 1992, The East Continent Rift Basin:<br />
A new discovery: Kentucky <strong>Geologic</strong>al Survey, Ser. 11, Special Publication<br />
18, 25 p.<br />
Drahovzal, J.A., and Noger, M.C., 1995, Preliminary map of the structure<br />
of the Precambrian surface in eastern Kentucky: Kentucky <strong>Geologic</strong>al<br />
Survey, ser. 11, Map and Chart Series 8, 9 p.<br />
Drahovzal, J.A., and White, T.M., 2002, The tectonic development of the<br />
Rome Trough: A new model and its exploration implications: 2002 Eastern<br />
Section American Association of Petroleum Geologists, 31st Annual<br />
Meeting, abstracts of talks and posters, p. 14.<br />
Dressel, P.E., 1985, The geochemistry of oilfield brines from western Pennsylvania:<br />
Pennsylvania State University, M.S. thesis, 168 p.<br />
Driese, S.G., Byers, C.W., and Dott, R.H., Jr., 1981, Tidal deposition of the<br />
basal Upper Cambrian Mt. Simon Formation in Wisconsin: Journal of<br />
Sedimentary Petrology, V. 51, p. 367-381.<br />
Droste, J.B., & Shaver, R.H., 1985, Comparative Stratigraphic Framework<br />
for Silurian Reefs—Michigan Basin to Surrounding Platforms: Ordovician<br />
and Silurian Rocks of the Michigan Basin and its Margins, 73-93.<br />
Ebright, J.R., and Ingham, A.I., 1951, Geology of the Leidy gas field and<br />
adjacent areas, Clinton County, Pennsylvania: Pennsylvania <strong>Geologic</strong>al<br />
Survey, 4th ser., Mineral Resource <strong>Report</strong> 34, 35 p.<br />
Edmunds, W.E., Berg, T.M., Sevon, W.D., Piotrowski, R.C., Heyman, L.,<br />
and Rickard, L.V., 1979, The Mississippian and Pennsylvanian (Carboniferous)<br />
Systems in the United States—Pennsylvania and New York: U.S.<br />
<strong>Geologic</strong>al Survey Professional Paper 1110-B, 33 p.<br />
Edwards, Jonathan, Jr., 1970, Deep Wells of Maryland: Maryland <strong>Geologic</strong>al<br />
Survey, Basic Data <strong>Report</strong> 5, 161.<br />
Ehlers, G. M., 1945, Stratigraphy of the surface formations of the Mackinac<br />
Straits region, in Landes, K. K., Ehlers, G. M., and Stanley, G. M., Geology<br />
of the Mackinack Straits region and sub-surface geology of northern<br />
Southern Peninsula: Michigan Department of Conservation, <strong>Geologic</strong>al<br />
Survey Division, Publication 44, <strong>Geologic</strong>al Series 37, Chapter II, p.<br />
19-120.<br />
Ells, G.D., 1979,The Mississippian and Pennsylvanian (Carboniferous)<br />
Systems in the United States—Michigan: U.S. <strong>Geologic</strong>al Survey Professional<br />
Paper 1110-J, 17 p.<br />
Ells, G.D., Kelly, R.W., Hardenberg, H.J., Johnson, L.D., and Sorensen,<br />
H.O., 1964, Stratigraphic succession in Michigan, Paleozoic through<br />
Recent, Chart1: Michigan <strong>Geologic</strong>al Survey Division.<br />
Elton, W.E., and Haney, D.C., 1974, Petrology and stratigraphy of the upper<br />
Conasauga Group (Late Cambrian) in northeast Tennessee [abs.]: <strong>Geologic</strong>al<br />
Society of America Abstracts with Programs, v. 6, p. 351-352.<br />
Emmons, E., 1838, <strong>Report</strong> of the second geological district of the State of<br />
New York: New York <strong>Geologic</strong>al Survey Annual <strong>Report</strong>, no. 2, p. 185-<br />
252.<br />
Emmons, Ebenezer, 1842, Geology of New York; Part II, Comprising the<br />
survey of the second geological district: W. and A. White and J. Visscher,<br />
Albany, New York, 437 p.<br />
Energy Information Administration, 2005, Coal production and coalbed<br />
thickness by major coalbeds and mine types, 2003: Washington, D.C.,<br />
U.S. Department of Energy, 2003 Annual Coal <strong>Report</strong>, .<br />
Enterline, D.S., 1991, Depositional environments of the Cambro-Ordovician<br />
Rose Run formation in N.E. Ohio and equivalent, Gatesburg Formation in<br />
N.W. Pennsylvania: University of Akron , M.S. thesis, 163 p.<br />
Fergusson, W.B., and Prather, B.A., 1968, Salt deposits in the Salina Group<br />
in Pennsylvania: Pennsylvania <strong>Geologic</strong>al Survey, 4 th ser., Mineral Resource<br />
<strong>Report</strong> 58, 41 p.<br />
Ferm, J.C., 1974, Carboniferous environmental models and their significance,<br />
in Briggs, G. ed., Carboniferous of the southeastern United States:<br />
<strong>Geologic</strong>al Society of America Special Paper 148, p. 79-95.<br />
Ferm, J.C., and Horne, J.C., eds., 1979, Carboniferous depositional environments<br />
in the Appalachian region: Carolina Coal Group, University of<br />
South Carolina, Columbia, 760 p.<br />
Fettke, C.R., 1931, Physical characteristics of the Oriskany Sandstone and<br />
subsurface studies in the Tioga gas field, Pennsylvania: Pennsylvania<br />
<strong>Geologic</strong>al Survey, 4th ser., Progress <strong>Report</strong> 102-B, p. 1-9.<br />
Fettke, C.R., 1948, Subsurface Trenton And Sub-Trenton Rocks in Ohio,<br />
New York, Pennsylvania, and West Virginia: American Association of<br />
Petroleum Geologists Bulletin, v. 32, p.1457-1492.<br />
Field, R.M., 1919, The Middle Ordovician of central and south central Pennsylvania:<br />
American Journal of Science, 4 th ser., v. 48, p. 403-428.<br />
Finn, F.H., 1949, Geology and occurrence of natural gas in Oriskany Sandstone<br />
in Pennsylvania and New York: American Association of Petroleum<br />
Geologists Bulletin, v. 33, p. 303-335.<br />
Fisher, J.H., Barratt, M.W., Droste, J.B., and Shaver, R.H., 1988, Michigan<br />
Basin, in L.L. Sloss, ed., Sedimentary Cover-North American Craton:<br />
U.S.: <strong>Geologic</strong>al Society of America, The Geology of North America, v.<br />
D-2, p.361-382.<br />
Flaherty, K.J., 1996, Fractured Middle Devonian Huntersville Chert and<br />
Lower Devonian Oriskany Sandstone, in Roen, J. B., and Walker, B. J.,<br />
eds., The atlas of major Appalachian gas plays. West Virginia <strong>Geologic</strong>al<br />
and Economic Survey, Publication V-25, p. 103-108.<br />
Floto, B.A., 1955, The possible presence of buried Niagaran reefs in Ohio
APPENDIX A: REFERENCES CITED<br />
145<br />
and their relationship to the Newburg oil and gas zone: Ohio Division of<br />
<strong>Geologic</strong>al Survey <strong>Report</strong> of Investigation 24, 18 p.<br />
Foreman, J.L., and Anderhalt, Robert, 1986, Petrology and diagenesis of<br />
carbonate phases in the Lower Devonian Ridgeley Sandstone (Oriskany<br />
Group), southwestern Pennsylvania: Compass, v. 64, no. 1, p. 39-47.<br />
Freeman, L.B., 1949, Regional aspects of Cambrian and Ordovician subsurface<br />
stratigraphy in Kentucky: American Association of Petroleum<br />
Geologists Bulletin, v. 22, p. 1655-1681.<br />
Freeman, L.B., 1953, Regional subsurface stratigraphy of the Cambrian and<br />
Ordovician in Kentucky and vicinity: Kentucky <strong>Geologic</strong>al Survey, ser.<br />
9, Bulletin 12, 352 p.<br />
Friedmann, S.J., and Nummedal, D., 2003, Reassessing the geological risks<br />
of seals failure for saline aquifers and EOR projects: 2 nd Annual Carbon<br />
Sequestration Conference, DOE/NETL, Alexandria, VA.<br />
Gaddess, Jack, 1931, Deep sands development in Tioga County, Pennsylvania:<br />
American Association of Petroleum Geologists Bulletin, v. 15, p.<br />
925-937.<br />
Gardner, W.C., 1974, Middle Devonian stratigraphy and depositional environments<br />
in the Michigan basin: Michigan Basin <strong>Geologic</strong>al Society<br />
Special Paper 1, 138 p.<br />
Geiger, H.R., and Keith, A., 1891, The structure of the Blue Ridge near<br />
Harper’s Ferry: <strong>Geologic</strong>al Society of America Bulletin, v. 2, p. 155-164.<br />
Gill, D., 1977, The Belle River Mills Gas Field: Productive Niagaran Reefs<br />
Encased by Sabkha Deposits, Michigan Basin: Michigan Basin <strong>Geologic</strong>al<br />
Society, Special Papers No. 2.<br />
Gill, D., Mesolella, K.J., Robinson, J.D., McCormick, L.M., & Ormiston,<br />
A.R., 1974, Cyclic deposition of Silurian carbonates and evaporites in<br />
Michigan Basin discussion and reply: American Association of Petroleum<br />
Geologists Bulletin, 59(3), 535-542.<br />
Gill, H.E., Seabar, P.R., Vecchioli, J., and Anderson, H.R., 1963, Evaluation<br />
of geologic and hydrologic data from the test-drilling program at Island<br />
Beach State Park, N. J.: New Jersey Department of Conservation and<br />
Economic Development, Water Resources Circular 12, 25 p.<br />
Ginsburg, R.N., 1982, Actualistic depositional models for the Great American<br />
Bank (Cambro-Ordovician) (abs.): International Association of Sedimentologists,<br />
11th International Congress on Sedimentology, Abstracts,<br />
Hamilton, Ontario, p. 114.<br />
Glaser, J.D., 2004, <strong>Geologic</strong> map of the Hancock, Big Pool, and Cherry<br />
Run quadrangles, Washington County, Maryland: Maryland <strong>Geologic</strong>al<br />
Survey, Digital <strong>Geologic</strong> Map Series, scale 1:24,000.<br />
Glaser, J.D., 1969, Petrology and origin of Potomac and Magothy (Cretaceous)<br />
sediments, middle Atlantic Coastal Plain: Maryland <strong>Geologic</strong>al<br />
Survey <strong>Report</strong> of Investigations No. 11, 101 p.<br />
Glaser, J.D. and Brezinski, D.K., 2004, <strong>Geologic</strong> map of the Lonaconing<br />
quadrangle, Allegany and Garrett Counties, Maryland: Maryland <strong>Geologic</strong>al<br />
Survey, Digital geologic map series, scale 1:24,000.<br />
Glumac, B., and Walker, K.E., 2000, Carbonate deposition and sequence<br />
stratigraphy of the terminal Cambrian grand cycle in the southern Appalachians,<br />
U.S.A.: Journal of Sedimentary Research, v. 70, p. 952-963.<br />
Glumac, B., and Walker, K.E., 2002, Effects of grand-cycle cessation on the<br />
diagenesis of Upper Cambrian carbonate deposits in the Southern Appalachians,<br />
U.S.A.: Journal of Sedimentary Research, v. 72, p. 570-586.<br />
Goa, D., Shumaker, R.C., and Wilson, T.H., 2000, Along-axis segmentation<br />
and growth history of the Rome Trough in the central Appalachian Basin:<br />
American Association of Petroleum Geologists Bulletin, v. 84, p. 75-99.<br />
Gooding, P.J., 1992, Unconformity at the top of the Knox Group (Cambrian<br />
and Ordovician) in the subsurface of south central Kentucky, Kentucky<br />
<strong>Geologic</strong>al Survey, Thesis Series 4, 40 p.<br />
Grabau, A.W., 1908, A revised classification of North American Siluric System:<br />
Science, v. 27, p. 622-623.<br />
Grabau, A.W., 1909, Physical and faunal evolution of North America during<br />
Ordovicic, Siluric, and early Devonic time: Journal of Geology, v. 17, p.<br />
209-252.<br />
Grabau, A.W., and Sherzer, W.H., 1910, The Monroe Formation of southern<br />
Michigan and adjoining regions: Michigan <strong>Geologic</strong>al and Biological<br />
Survey, Pub. 2, Geol. Series 1, 248 p.<br />
Greb, S.F., Chesnut, D.R., Jr., and Eble, C.F., 2004, Temporal changes in<br />
coal-bearing depositional sequences (Lower and Middle Pennsylvanian)<br />
of the central Appalachian basin, U.S.A., in Pashin, J.C. and Gastaldo, R.<br />
eds., Coal-bearing strata: sequence stratigraphy, paleoclimate, and tectonics<br />
of coal-bearing strata: American Association of Petroleum Geologists,<br />
Studies in Geology 51, p. 89-120.<br />
Greb, S.F., Eble, C.F., and Chesnut, D.R., Jr., 2002a, Comparison of the<br />
Eastern and Western Kentucky Coal Fields, U.S.A—Why are coal distribution<br />
patterns and sulfur contents so different in these coal fields:<br />
International Journal of Coal Geology, v. 50, p. 89-118.<br />
Greb, S.F., Eble, C.F., Hower, J.C., and Andrews, W.M., 2002b, Multiplebench<br />
architecture and interpretations of original mire phases in Middle<br />
Pennsylvanian coal seams—Examples from the Eastern Kentucky Coal<br />
Field: International Journal of Coal Geology, v. 49, p. 147-175.<br />
Green, A.G., Milkereit, B., Davidson, A., Spenser, C., Hutchinson, D.R.,<br />
Cannon, W.F., Lee, M.W., Agena, W.F., Behrendt, J.C., and Hinze, W.J.,<br />
1988, Crustal structure of the Grenville front and adjacent terranes: Geology,<br />
v. 16, p. 788-792.<br />
Green, J.C., 1982, Geology of the Keweenawan extrusive rocks, in Wold,<br />
R.J., and Hinze, W.J., eds., Tectonic history of the Lake Superior Basin:<br />
<strong>Geologic</strong>al Society of America Memoir 156, p. 47-56.<br />
Gupta, Neeraj, 1993, <strong>Geologic</strong> and Fluid-Density Controls on the Hydrodynamics<br />
of the Mt. Simon Sandstone and Overlying Units in Ohio and<br />
Surrounding States: Ohio State University, Ph.D. dissertation, 266 p.<br />
Gutschick, R.C. and Sandberg, C.A., 1991, Upper Devonian biostratigraphy<br />
of Michigan Basin, in Catacosinos., P.A. and Daniels, P. A., Jr., eds.,<br />
Early Sedimentary Evolution of the Michigan Basin: <strong>Geologic</strong>al Society<br />
of America Special Paper 256, p. 155-179.<br />
Gwinn, V.E., 1964, Thin-skinned tectonics in the Plateau and northwestern<br />
Valley and Ridge Provinces of the central Appalachians: <strong>Geologic</strong>al Society<br />
of America Bulletin, v. 75, p. 863-900.<br />
Haddox, C.A., and Dott, R.H., Jr., 1990, Cambrian shoreline deposits in<br />
Northern Michigan: Journal of Sedimentary Petrology, v. 60, p. 697-716.<br />
Hagadorn, J.W., Dott, R.H., Jr., and Damrow, D., 2002, Stranded on a Late<br />
Cambrian shoreline: medusa from central Wisconsin: <strong>Geologic</strong>al Society<br />
of America, v 30, p. 147-150.<br />
Hall, J., 1839, Third annual report of the fourth geological district of the<br />
State of New York: New York <strong>Geologic</strong>al Survey, Annual <strong>Report</strong>, vol.3,<br />
pp. 287-339.<br />
Hamilton-Smith, T., 1993, Gas exploration in the Devonian Shales of Kentucky:<br />
Kentucky <strong>Geologic</strong>al Survey, Series 11, Bulletin 4, 31 p.<br />
Hamilton-Smith, T., Nuttall, B.C., Gooding, P.J., Walker, Dan, and Drahovzal,<br />
J.A., 1990, High-volume oil discovery in Clinton county, Kentucky: Kentucky<br />
<strong>Geologic</strong>al Survey, ser.11, Information Circular 33, 13 p.<br />
Hansen, H.J., 1968, Geophysical log cross-section network of the Cretaceous<br />
sediments of southern Maryland: Maryland <strong>Geologic</strong>al Survey<br />
<strong>Report</strong> of Investigation No. 7, 33 p.<br />
Hansen, H.J., 1969, Depositional environments of subsurface Potomac<br />
Group in southern Maryland: American Association of Petroleum Geologists<br />
Bulletin, v. 53, p. 1923-1937.<br />
Hansen, H.J., 1982, Hydrogeologic framework and potential utilization of<br />
the brine aquifers of the Waste Gate Formation, a new unit of the Potomac<br />
Group underlying the Delmarva Peninsula in Waste Gate Formation, Part<br />
One: Maryland <strong>Geologic</strong>al Survey Open-File <strong>Report</strong>, p. 1-50.<br />
Hansen, H.J., 1984, Hydrogeologic characteristics of the Waste Gate Formation,<br />
a new subsurface unit of the Potomac Group underlying the eastern<br />
Delmarva Peninsula: Maryland <strong>Geologic</strong>al Survey Information Circular<br />
39, 22 p.<br />
Hardie, L.A., 1986, Ancient carbonate tidal-flat deposits, in Hardie, L.A.,<br />
and Shinn, E.A., Carbonate Depositional Environments, Modern and<br />
Ancient, Part 3: Tidal Flats: Colorado School of Mines Quarterly, v. 81,<br />
no. 1, p. 37-57.<br />
Harper, J.A., 1989, Effects of recurrent tectonic patterns on the occurrence<br />
and development of oil and gas resources in western Pennsylvania: Northeastern<br />
Geology, v. 11, p. 225-245.<br />
Harper, J.A.,1990, Leidy gas field, Clinton and Potter Counties, Pennsylvania:<br />
American Association of Petroleum Geologists, Treatise of Petroleum<br />
Geology, Atlas of Oil and Gas Fields, Structural Traps I, Tectonic<br />
Fold Traps, p. 157-190.<br />
Harper, J.A., 1991, Preliminary assessment of the stratigraphy and structure<br />
of the Cambro-Ordovician carbonate sequence in western Pennsylvania,<br />
in Exploration strategies in the Appalachian basin: 22nd Annual Appa-
146 CHARACTERIZATION OF GEOLOGIC SEQUESTRATION OPPORTUNITIES IN THE <strong>MRCSP</strong> REGION<br />
lachian Petroleum Geology Symposium, Morgantown, WV, I.C. White<br />
Memorial Fund Pub. 3, p. 30-32.<br />
Harper, J.A., and Patchen, D.G., 1996, Lower Devonian Oriskany Sandstone<br />
structural play, in Roen, J. B., and Walker, B. J., eds., The atlas of major<br />
Appalachian gas plays: West Virginia <strong>Geologic</strong>al and Economic Survey,<br />
Publication V-25, p. 109-117.<br />
Harris, A.G., Stamm, N.R., Weary, D.J., Repetski, J.E., Stamm, R.G. and<br />
Parker, R.A., 1994, Conodont color alteration index (CAI) map and conodont-based<br />
age determinations for the Winchester 30’ x 60’ quadrangle<br />
and adjacent area, Virginia, West Virginia, and Maryland: U.S. <strong>Geologic</strong>al<br />
Survey Miscellaneous Field Studies Map, MF-2239, 40 p., 1 sheet, scale<br />
1:100,000.<br />
Harris, D.C., and Baranoski, M.T., 1996, Cambrian pre-Knox group play, in<br />
Roen, J.B., and Walker, B.J., eds., The Atlas of Major Appalachian Gas<br />
Plays: West Virginia <strong>Geologic</strong>al Survey, Publication V-25, p. 188-192.<br />
Harris, D.C., Hickman, J.B., Baranoski, M.T., Drahovzal, J.A., Avary, K.L,<br />
and Nuttall, B.C., 2004, Rome Trough Consortium final report and data<br />
distribution: Kentucky <strong>Geologic</strong>al Survey, ser. 12, Open File <strong>Report</strong> 04-<br />
06, 1 CDROM.<br />
Harris, L. D., 1975, Oil and gas data from the Lower Ordovician and Cambrian<br />
rocks of the Appalachian basin: U. S. <strong>Geologic</strong>al Survey Miscellaneous<br />
Investigations Series Map I-917 D.<br />
Harris, L. D., 1978, The eastern interior aulacogen and its relationship to<br />
Devonian shale gas production: Preprints, Second Eastern Gas Shales<br />
Symposium, U. S. Department of Energy, Morgantown Energy Technology<br />
Center, METC/SP-78/6, v. 1, p. 55-72.<br />
Hatfield, C.B., Rohrbacher, T.J., and Floyd, J.C., 1968, Directional properties,<br />
paleoslope, and source of the Sylvania Sandstone (Middle Devonian)<br />
of southeastern Michigan and northwestern Ohio: Journal of Sedimentary<br />
Petrology, v. 38, n. 1, p. 224-228.<br />
Hayes, C.W., 1891, The overthrust faults of the southern Appalachians, with<br />
discussion by C.D. Walcott, W.M. Davis, and Bailey Willis: <strong>Geologic</strong>al<br />
Society of America Bulletin, v. 2, p. 141-154.<br />
Hayes, C.W., Davis, W.M., Walcott, C.D., and Willis, B., 1891, The overthrust<br />
faults of the southern Appalachians: <strong>Geologic</strong>al Society of America<br />
Bulletin, v. 2, p. 143-144-148.<br />
Haynes, J.T., 1991, Stratigraphy of the Waynesboro Formation (Lower and<br />
Middle Cambrian) near Buchanan, Botetourt County, Virginia: Virginia<br />
Division of Mineral Resources Publication 116, 22 p.<br />
Head, J.W., III, 1969, An integrated model of carbonate depositional basin<br />
evolution, late Cayugan (Upper Silurian) and Helderbergian (Lower<br />
Devonian) of the central Appalachians: Brown University, Ph.D. dissertation,<br />
390 p.<br />
Head, J.W., 1974, Correlation and paleogeography of upper part of Helderberg<br />
Group (Lower Devonian) of central Appalachians: American Association<br />
of Petroleum Geologists Bulletin, v. 58, p. 247-259.<br />
Henderson, G.J., and Timm, C.M., 1985, Ordovician stratigraphic hydrocarbon<br />
entrapment potential of Appalachia: Oil and Gas Journal, v. 83, no.<br />
17, p. 118-125.<br />
Hettinger, R.D., 2001, Subsurface correlations and sequence stratigraphic<br />
interpretations of Lower Silurian strata in the Appalachian basin of northeast<br />
Ohio, southwest New York, and northwest Pennsylvania: United<br />
States <strong>Geologic</strong>al Survey <strong>Geologic</strong> Investigations Series I-274.<br />
Heyman, Louis, 1969, Geology of the Elk Run gas pool, Jefferson County,<br />
Pennsylvania: Pennsylvania <strong>Geologic</strong>al Survey, 4th ser., Mineral Resource<br />
<strong>Report</strong> 59, 18 p.<br />
Heyman, L., 1977, Tully (Middle Devonian) to Queenston (Upper Ordovician)<br />
correlations in the subsurface of western Pennsylvania: Pennsylvania<br />
<strong>Geologic</strong>al Survey, 4th ser., Mineral Resource <strong>Report</strong> 73, 16 p.<br />
Hill, D.G. and Nelson, C.R., 2000, Gas Productive Fractured Shales: An<br />
Overview and Update: GAS TIPS, Summer, 2000, Gas Research Institute,<br />
Chicago, p. 4-13.<br />
Hinze, W.J., Allen, D.J., Braile, L.W., and Mariano, John., 1997 The Midcontinent<br />
Rift System: A major Proterozoic continental rift, in Ojakangas,<br />
R.W., Dickas, A.B., and Green, J.C., eds., Middle Proterozoic to Cambrian<br />
rifting, Central North America: <strong>Geologic</strong>al Society of America,<br />
Special Paper 312, p.<br />
Hinze, W.J., Kellogg, R.L., and Merritt, D.W., 1971, Gravity and aeromagnetic<br />
anomaly maps of the southern peninsula of Michigan: <strong>Geologic</strong>al<br />
Survey Division, Michigan Department of Natural Resources, <strong>Report</strong> of<br />
Investigation, 14, 15 p.<br />
Hinze, W.J., Kellogg, R.L., and O’Hara, N.W., 1975, Geophysical studies of<br />
basement geology of southern peninsula of Michigan: American Association<br />
of Petroleum Geologists Bulletin, v. 59, p. 1562-1584.<br />
Hoppe, W.J., Montgomery, E.W., and Van Schmus, W.R., 1983, Age and<br />
significance of Precambrian basement samples from northern Illinois and<br />
adjacent states: Journal of Geophysical Research, v. 88, p. 7270-7286.<br />
Horowitz, D.H., 1965, Petrology of the Upper Ordovician and Lower Silurian<br />
rocks in the central Appalachians: Pennsylvania State University,<br />
Ph.D. dissertation, 221 p.<br />
Hosterman, J.W., and Whitlow, S.I., 1983, Clay mineralogy of Devonian<br />
Shales in the Appalachian Basin: Washington, D.C., United States <strong>Geologic</strong>al<br />
Survey Professional Paper 1298, 31 p.<br />
Hovorka, S.D., Romero, M.L. , Warne, A.G., Ambrose, W.A., Tremblay,<br />
T.A., Treviño, R.H. and Sasson, Douglas, 2000, Sequestration of<br />
greenhouse gases in Brine Formations: .<br />
Howell, P.D., and van der Pluijm, B.A., 1999, Structural sequences and<br />
styles of subsidence in the Michigan basin: <strong>Geologic</strong>al Society of America<br />
Bulletin, v. 111, p. 974-991.<br />
Humphreys, M., and Watson, A.E., 1996, Middle Ordovician St. Peter<br />
Sandstone, in Roen, J.B., and Walker, B.J., eds., The Atlas of Major Appalachian<br />
Gas Plays: West Virginia <strong>Geologic</strong>al Survey, Publication V-25,<br />
p. 177-180.<br />
Hussey, R.C., 1926, The Richmond Formation of Michigan: Michigan<br />
University, Museum of Geology, Contributions (Ann Arbor), v. 2, no.<br />
8, p.113-187.<br />
Indiana <strong>Geologic</strong>al Survey, 1997, Wabash Formation, Niagaran and Cayugan<br />
Series, Silurian System: .<br />
Inners, J.D., 1975, The stratigraphy and paleontology of the Onesquethaw<br />
State in Pennsylvania and adjacent states: University of Massachusetts,<br />
Ph.D. dissertation.<br />
Jacobeen, Frank, and Kanes, W.H., 1974a, Structure of Broadtop synclinorium<br />
and its implications for Appalachian structural style: American Association<br />
of Petroleum Geologists Bulletin, v. 58, p. 362-375.<br />
Jacobeen, Frank, and Kanes, W.H., 1974b, Structure of Broadtop synclinorium,<br />
Wills Mountain anticlinorium, and Allegheny frontal zone: American<br />
Association of Petroleum Geologists Bulletin, v. 59, p. 1136-1150.<br />
Jacobi, R.D., 1981, Peripheral bulge—A causal mechanism for the Lower/<br />
Middle Ordovician unconformity along the western margin of the Northern<br />
Appalachians: Earth and Planetary Science Letters, v. 56, p. 245-251.<br />
Jacobi, R.D., Loewenstein, Stuart, Smith, Gerald, Fountain, John, Lugert,<br />
Courtney, and Martin, John, 2004, Iapetan opening/rome trough-related<br />
faults and their reactivation history in New York State: American Association<br />
of Petroleum Geologists, Eastern Section, 2004 Annual Meeting,<br />
Columbus, Ohio, Abstracts, .<br />
Janssens, Arie, 1973 Stratigraphy of Cambrian and Lower Ordovician rocks<br />
in Ohio: Ohio Division of <strong>Geologic</strong>al Survey, Bulletin 64, 197 p.<br />
Janssens, Arie, 1977, Silurian rocks in the subsurface of northwestern Ohio:<br />
Ohio Division of <strong>Geologic</strong>al Survey <strong>Report</strong> of Investigation 100, 96 p.<br />
Janssens, Arie, 1997, Stratigraphy of post-Salina “Big Lime” (Silurian-<br />
Devonian) in northeast Ohio with emphasis on distribution of sandstone:<br />
A progress report. Ohio <strong>Geologic</strong>al Society Fifth Annual Technical Symposium,<br />
Akron, OH, p. 27-37.<br />
Johnson, J.W., Nitao, J.J., and Morris, J.P., in press, 2004, Reactive transport<br />
modeling of cap rock integrity during natural and engineered CO 2 storage,<br />
in Thomas, David, and Benson, Sally, eds., Carbon Dioxide Capture for<br />
Storage in Deep <strong>Geologic</strong> Formations - Results From The CO2 Capture<br />
Project: Volume 2, <strong>Geologic</strong> Storage of Carbon Dioxide with Monitoring<br />
and Verification, Elsevier, New York.<br />
Kalliokowski, J., and Welch, E.J., 1976, Magnitude and quality of Michigan’s<br />
coal reserves: U.S. Bureau of Mines Open File <strong>Report</strong>, OFR-102-76.<br />
Kasabach, H.F., and Scudder, R.J., 1961, Deep wells of the New Jersey<br />
coastal plain: New Jersey <strong>Geologic</strong>al Survey <strong>Report</strong> GSR 3, 62 p.<br />
Kauffman, M.E., 1999, Eocambrian, Cambrian, and transition to Ordovician,<br />
in Shultz, C.H., ed., Geology of Pennsylvanian: Pennsylvania Geo-
APPENDIX A: REFERENCES CITED<br />
147<br />
logical Survey and Pittsburgh <strong>Geologic</strong>al Society, Special Publication 1,<br />
p. 59-73.<br />
Kay, G.M., 1944, Middle Ordovician of central Pennsylvania: Journal of<br />
Geology, v. 52, p. 1-23, 97-116.<br />
Keith, A., 1895, Description of the Knoxville [quadrangle] sheet: U.S. <strong>Geologic</strong>al<br />
Survey, <strong>Geologic</strong> Atlas, Folio 16, 6 p.<br />
Keith, A., 1896, Description of the Morristown [quadrangle] sheet, Tennessee:<br />
U.S. <strong>Geologic</strong>al Survey, <strong>Geologic</strong> Atlas, Folio 27, 7 p.<br />
Keith, A., 1903, Description of the Cranberry [quadrangle], North Carolina-<br />
Tennessee: U.S. <strong>Geologic</strong>al Survey, <strong>Geologic</strong> Atlas, Folio 90, 9 p.<br />
Keith, B.D., and Wickstrom, L.H., 1993, Trenton Limestone—The karst that<br />
wasn’t there, or was it, in Fritz, R. D., Wilson, J. L., and Yurewicz, D.<br />
A., eds., Paleokarst related hydrocarbon reservoirs: Society of Economic<br />
Paleontologists and Mineralogists, Workshop 18, p. 167-179.<br />
Keller, G.R., Lidiak, E.G., Hinze, W.J., and Braile, L.W., 1983, The role of<br />
rifting in the tectonic development of the Mid-continent, U.S.A.: Tectonophysics,<br />
v. 94, p. 391-412.<br />
Kelley, Dana, DeBor, David, Malanchak, John, and Andersen, David, 1973,<br />
Tully and deeper formations, brine analysis of Pennsylvania: Pennsylvania<br />
<strong>Geologic</strong>al Survey, 4 th ser., Open-file <strong>Report</strong> OF 73-02.<br />
Kelly, W.A., 1936, The Pennsylvanian System of Michigan: Michigan <strong>Geologic</strong>al<br />
Survey Pub. 40, Geol. Ser. 34, pt 2, p.149-226.<br />
Kindle, E.M., 1899, The Devonian and Lower Carboniferous faunas of<br />
southern Indiana and central Kentucky: Bulletins of American Paleontology,<br />
v. 3, no. 12, p. 131-239.<br />
Kinney, D.M., ed., 1976, Geothermal gradient map of North America:<br />
American Association of Petroleum Geologists and U.S. <strong>Geologic</strong>al Survey<br />
Publication G74014, (2 maps).<br />
Knapp, N., and Stith, D., 1982, Geochemical characterization of the Devonian<br />
shales in eastern Ohio: in Gray, J. D., ed., An integrated study of<br />
the Devonian-age black shales in eastern Ohio, U. S. Dept. of Energy,<br />
DOE/ET12131-1399, Chapter 5.<br />
Knight, W.V., 1969, Historical and economic geology of Lower Silurian<br />
Clinton Sandstone of northeastern Ohio: American Association of Petroleum<br />
Geologists Bulletin, v. 53, p. 1421-1452.<br />
Knowles, R.R., 1966, Geology of a portion of the Everett 15-minute quadrangle,<br />
Bedford County, Pennsylvania: Pennsylvania <strong>Geologic</strong>al Survey,<br />
4th ser., Progress <strong>Report</strong> 170, 90 p.<br />
Lacazette, A. J., 1991, Natural hydraulic fracturing in the Bald Eagle sandstone<br />
in central Pennsylvania and the Ithaca siltstone at Watkins Glen,<br />
New York: Pennsylvania State University, Ph.D. dissertation, 225 p.<br />
Lane, A.C., 1902, Notes on the geological section of Michigan; Part II, from<br />
the St. Peters up: Michigan Geol. Survey, <strong>Report</strong> 8, pt. 2, p. 43-105.<br />
Lane, A.C. and Seaman, A.E., 1907, Notes on the geological section of<br />
Michigan; Part 1, The pre-Ordovician: Journal of Geology, v. 15, p.<br />
680-695.<br />
Lane, A.C., Prosser, C.S., Sherzer, W.H., and Grabau, W.A.1909, Nomenclature<br />
and subdivision of the upper Siluric strata of Michigan, Ohio,<br />
and western New York: <strong>Geologic</strong>al Society of America Bulletin, v. 19,<br />
p. 553-556.<br />
Laughrey, C.D., 1984, Petrology and reservoir characteristics of the Lower<br />
Silurian Medina Group sandstones, Athens and Geneva fields, Crawford<br />
County, Pennsylvania: Pennsylvania <strong>Geologic</strong>al Survey, 4 th ser., Mineral<br />
Resource <strong>Report</strong> 85, 126 p.<br />
Laughrey, C.D., 1987, Evaluating the Lockport Dolomite - problems, pores,<br />
and possibilities, in The Eighteenth Annual Appalachian Petroleum Geology<br />
Symposium, “Rifts, Ramps, Reefs, and Royalties”, March 23-26<br />
1987, Sheraton Lakeview Resort and Conference Center, Morgantown,<br />
WV, West Virginia <strong>Geologic</strong>al and Economic Survey Circular C-40, p.<br />
56-58.<br />
Laughrey, C.D., and Harper, J. A., 1986, Comparisons of Upper Devonian<br />
and Lower Silurian tight formations in Pennsylvania —geological and engineering<br />
characteristics, in Spencer, C.W., and Mast, R.F., eds., Geology<br />
of tight gas reservoirs: American Association of Petroleum Geologists<br />
Studies in Geology 24, p. 9-43.<br />
Laughrey, C.D., and Harper, R.M., 1996, Upper Ordovician Bald Eagle Formation<br />
fractured anticlinal play, p. 164-167, in Roen, J. B., and Walker, B.<br />
J., eds., The atlas of major Appalachian gas plays. West Virginia <strong>Geologic</strong>al<br />
and Economic Survey, Publication V-25, 201 p.<br />
Lavin, P.M., Chaffin, D.L., and Davis, W.F., 1982, Major lineaments and the<br />
Lake Erie-Maryland crustal block: Tectonics, v. 1, p. 431-440.<br />
Leahy, P.P., and Martin, Mary, 1993, Geohydrology and simulation of<br />
ground-water flow in the Northern Atlantic Coastal Plain aquifer system:<br />
U.S. <strong>Geologic</strong>al Survey Professional Paper 1404-K, 81 p.<br />
Leahy, P.P., Martin, M., and Meisler, H., 1986, Hydrogeologic definition<br />
of the northern Atlantic Coastal Plain Aquifer System based on regional<br />
simulation, in Vecchioli, J., and Johnson, A. I., eds., Regional aquifer<br />
systems of the United Stated aquifers of the Atlantic and Gulf Coastal<br />
Plain: American Water Resources Association, Monograph Series No. 9,<br />
Bethesda, MD, p. 7-24.<br />
Leslie, J.P., 1878, Preface. Second <strong>Geologic</strong>al Survey of Pennsylvania, v.<br />
F, p. vii-xlix.<br />
Lesure, F.G., 1957, Geology of the Clifton Forge Iron District, Virginia: Virginia.<br />
Polytechnical Institute Experimental Station Bulletin 118, 130 p.<br />
Lidiak, E.G., Hinze, W.J., Keller, G.R., Reed, J.E., Braile, L.W. and Johnson,<br />
R.W., 1985, <strong>Geologic</strong> significance of regional gravity and magnetic<br />
anomalies in the east-central Midcontinent, in Hinze, W. J., ed., The utility<br />
of regional gravity and magnetic maps: Society of Exploration Geophysicists,<br />
p. 287-307.<br />
Lidiak, E.G., Marvin, R.F., Thomas, H. H., and Bass, M. N., 1966, Geochronology<br />
of the midcontinent region, United States, Part 4: Eastern Region,<br />
Journal of Geophysical Research, v. 71, p. 5427-5438.<br />
Lidiak, E. G., and Zietz, Isidore, 1976, Interpretation of aeromagnetic anomalies<br />
between latitudes 37°N and 38°N in the eastern and central United<br />
States: <strong>Geologic</strong>al Society of America Special Paper 167, 37 p.<br />
Lilienthal, R.T., 1978, Stratigraphic cross sections of the Michigan Basin:<br />
Michigan Department of Natural Resources, <strong>Geologic</strong>al Survey Division,<br />
<strong>Report</strong> of Investigations 19, 36 p. (plus plates).<br />
Lucius, J.E., and Von Frese, R.R.B., 1988, Aeromagnetic and gravity<br />
anomaly constraints on the crustal geology of Ohio: <strong>Geologic</strong>al Society<br />
of America Bulletin, v. 100, p. 104-116.<br />
Lusk, R.G., 1927, The significance of structure in the accumulation of oil<br />
in Tennessee: American Association of Petroleum Geologists Bulletin, v.<br />
11, p. 905-917.<br />
Lyons, P.C., 1998, The central and northern Appalachian Basin—A frontier<br />
region for coalbed methane development: International Journal of Coal<br />
Geology, v. 38, p. 61-87.<br />
Lytle, W.S., 1963, Underground gas storage in Pennsylvania: Pennsylvania<br />
<strong>Geologic</strong>al Survey, 4th ser., Mineral Resource <strong>Report</strong> 46, 31 p.<br />
Lytle, W. S., Goth, J. H., Kelley, D. R., McGlade, W. G., and Wagner, W. R.,<br />
1966, Oil and gas developments in Pennsylvania in 1965: Pennsylvania<br />
<strong>Geologic</strong>al Survey, 4th ser., Progress <strong>Report</strong> 172, 66 p.<br />
Mai, H. and Dott, R.H. Jr., 1985, A subsurface study of the St. Peter Sandstone<br />
in southern and eastern Wisconsin: Wisconsin <strong>Geologic</strong>al and Natural<br />
History Survey, no. 47, 26 p.<br />
Manheim, F. T., and Horn, M. K., 1968, Composition of deeper subsurface<br />
waters along the Atlantic continental margin: Southeastern Geology, v. 9,<br />
p. 215-236.<br />
Marchefka, A., and Glumac, B., 2002, Stratigraphy of the Big Spring Station<br />
Member of the Conococheague Limestone, southcentral Pennsylvania [abs.]:<br />
Abstracts with Programs, <strong>Geologic</strong>al Society of America, v. 34, p. 15.<br />
Markowski, A.K., 1998, Coalbed methane resource potential and current<br />
prospects in Pennsylvania: International Journal of Coal Geology, v. 38,<br />
p. 137-159.<br />
Martens, J. H. C., 1939, Petrography and correlation of deep-well sections<br />
in West Virginia and adjacent states: West Virginia <strong>Geologic</strong>al Survey, v.<br />
XI, 255 p.<br />
Martini, I.P., 1971, Regional analysis of sedimentology of Medina Formation<br />
(Silurian), Ontario and New York: American Association of Petroleum<br />
Geologists, Bulletin, v.55, p. 1249-1261.<br />
Martino, R.L., 1996a, Stratigraphy and depositional environments of the<br />
Kanawha Formation (Middle Pennsylvanian), southern West Virginia:<br />
International Journal of Coal Geology, v. 31, p. 217-248.<br />
Martino, R.L., 1996b, Stratigraphic and depositional framework of the Glenshaw<br />
Formation (Late Pennsylvanian) in Wayne County, West Virginia:<br />
Southeastern Geology, v. 36, p. 65-83.<br />
Mather, W. W., 1859, <strong>Report</strong> of the State House Artesian Well at Columbus,<br />
Ohio: Columbus, 41 p.
148 CHARACTERIZATION OF GEOLOGIC SEQUESTRATION OPPORTUNITIES IN THE <strong>MRCSP</strong> REGION<br />
Matthews, R.D., 1983, The Devonian-Mississippian Oil Shale Resource of<br />
the Eastern United States, in Proceedings of the 16 th Oil Shale Symposium:<br />
Colorado School of Mines, Boulder, Colorado, p. 14-25.<br />
Matthews, R.D., 1993, Review and Revision of the Devonian-Mississippian<br />
Stratigraphy in the Michigan Basin, in Roen, J.B. and Kepferle,<br />
R.C., eds., Petroleum Geology of the Devonian and Mississippian Black<br />
Shale of Eastern North America: U.S. <strong>Geologic</strong>al Survey Bulletin 1909,<br />
p. D1-D85.<br />
Mayhew, M. A., Thomas, H. H., and Wasilewski, P. J., 1982, Satellite<br />
and surface geophysical expression of anomalous crustal structure in<br />
Kentucky and Tennessee: Earth and Planetary Science Letters, v.58, p.<br />
395-405.<br />
Mazullo, J.M. and Ehrlich, R., 1987, The St. Peter Sandstone of southeastern<br />
Minnesota: mode of deposition, in Sloan, R.E., ed.,Middle and Late<br />
Ordovician lithostratigraphy of the upper Mississippi Valley: Minnesota<br />
<strong>Geologic</strong>al Survey <strong>Report</strong> of Investigations 35, p. 44-50.<br />
McCormac, M. P., Mychkovsky, G. O., Opritza, S. T., Riley, R. A., Wolfe, M.<br />
E., Larsen, G. E., and Baranoski, M. T., 1996, Play Scm: Lower Silurian<br />
Cataract/Medina Group (“Clinton”) sandstone play, p. 156-163, in Roen,<br />
J. B., and Walker, B. J., eds., The atlas of major Appalachian gas plays:<br />
West Virginia <strong>Geologic</strong>al and Economic Survey Publication V-25, 201 p.<br />
McGarry, C. S., 1996, <strong>Geologic</strong> modeling for landfill screening: Integrating<br />
GIS with geospatial modeling, in Third International Conference/<br />
Workshop on Integrating GIS and Environmental Modeling CD-ROM,<br />
Santa Fe, New Mexico. .<br />
McGuire, W. H., and Howell, P., 1963, Oil and gas possibilities of the Cambrian<br />
and Lower Ordovician in Kentucky: Lexington, Kentucky, Spindletop<br />
Research Center, 216 p.<br />
McKee, E.D., and Crosby, E.J., 1975, Paleotectonic investigations of the<br />
Pennsylvanian System in the United States, part I. Introduction and regional<br />
analyses of the Pennsylvanian System: U.S. <strong>Geologic</strong>al Survey<br />
Professional Paper 853, 349 p.<br />
Meglen, J.F., and Noger, M.C., 1996, Lower Devonian-Upper Silurian<br />
unconformity play, p. 133-138, in Roen, J.B., and Walker, B.J., eds.,<br />
The atlas of major Appalachian gas plays: West Virginia <strong>Geologic</strong>al and<br />
Economic Survey publication V-25, 201 p.<br />
Meisler, Harold, 1989, The occurrence and geochemistry of salty ground<br />
water in the northern Atlantic Coastal Plain: U.S. <strong>Geologic</strong>al Survey Professional<br />
Paper P 1404-D, p. D1-D51.<br />
Meisler, H., Leahy, P. P., and Knobel, L. L., 1984, Effect of eustatic sea-level<br />
changes on salt-water-freshwater in the northern Atlantic coastal plain:<br />
U.S. <strong>Geologic</strong>al Survey Water-Supply Paper 2255, 28 p.<br />
Mesolella, K. J., 1978, Paleogeography of some Silurian and Devonian reef<br />
trends, central Appalachian basin: American Association of Petroleum<br />
Geologists Bulletin, v. 62, p. 1607-1644.<br />
Miall, A.D., 1984, Principals of Sedimentary Basin Analysis: Springer-<br />
Verlag, New York, 490 p.<br />
Milici, R., 1996, Play Dbg: Upper Devonian fractured black shales and gray<br />
shales and siltstone, in J. B. Roen, and B. J. Walker, eds., The atlas of<br />
major Appalachian gas plays: West Virginia <strong>Geologic</strong>al and Economic<br />
Survey Publication V-25, p. 86-92.<br />
Milici, R.C., and de Witt, W., Jr., 1988, The Appalachian Basin, in Sloss,<br />
L.L., ed., Sedimentary Cover—North American Craton: <strong>Geologic</strong>al Society<br />
of America, Boulder, Colorado, p. 506.<br />
Milstein, R.L., 1983, Part 1, maps, cross-sections and lithology, in Bricker,<br />
D.M., Milstein, R.L., and Reszka, C,R. Jr., eds., Selected Studies of<br />
Cambro-Ordovician Sediments within the Michigan Basin: Michigan<br />
Department of Natural Resources, <strong>Geologic</strong>al Survey Division, <strong>Report</strong> of<br />
Investigation 26, p. 1-14.<br />
Mitra, Shankar, 1986, Duplex structures and imbricate thrust systems:<br />
Geometry, structural position, and hydrocarbon potential: American Association<br />
of Petroleum Geologists Bulletin, v. 70, p. 1087-1112.<br />
Mitra, Shankar, 1988, Effects of deformation mechanisms on reservoir potential<br />
in central Appalachian overthrust belt: American Association of<br />
Petroleum Geologists Bulletin, v. 72, p. 536-554.<br />
Montanez, I.P., 1994, Late diagenetic dolomitization of Lower Ordovician,<br />
Upper Knox carbonates: a record of the hydrodynamic evolution of the<br />
southern Appalachian Basin: American Association of Petroeum Geologists<br />
Bulletin, v. 78, p. 1210-1239.<br />
Murray, H. H., compiler, 1955, Sedimentation and stratigraphy of Devonian<br />
rocks of southeastern Indiana: Indiana <strong>Geologic</strong>al Survey, Field Conference<br />
Guidebook 8, 73 p.<br />
Mussman, W.J., Montanez, I.P., and Read, J.F., 1988, Ordovician Knox paleokarst<br />
unconformity, Appalachians, in James, N.P. and Choquette, P.W.,<br />
eds., Paleokarst. Spring-Verlag, New York, p. 211-229.<br />
Mussman, W. J., and Read, J. F., 1986, Sedimentology and development of<br />
a passive- to convergent-margin unconformity: Middle Ordovician Knox<br />
unconformity, Virginia Appalachians: <strong>Geologic</strong>al Society of America<br />
Bulletin, v. 97, p. 282-295.<br />
National Imagery and Mapping Agency, 2000, Digital terrain elevation data<br />
(DTED Level 0), .<br />
Newberry, J.S., 1871, <strong>Report</strong> on the progress of the <strong>Geologic</strong>al Survey in<br />
1869: Ohio <strong>Geologic</strong>al Survey <strong>Report</strong> of Progress, p. 3-53.<br />
Newberry, J. S., 1873, The general geological relations and structure of<br />
Ohio: Ohio <strong>Geologic</strong>al Survey, v. 1, pt. 1, Geology, p. 1-167.<br />
Newland, D. H., and Hartnagel, C. A., 1932, Recent natural gas developments<br />
in south-central New York: New York State Museum Circular 7,<br />
20 p.<br />
Noger, M. C., Meglen, J. F., Humphreys, Matt, Baranoski, M.T, 1996, Upper<br />
Silurian Lockport Dolomite-Keefer (Big Six) sandstone, in Roen, J.B.,<br />
and Walker, B.J., eds., The atlas of major Appalachian gas plays: West<br />
Virginia <strong>Geologic</strong>al and Economic Survey publication V-25, p. 145-150.<br />
Nolde, J.E. and Spears, D., 1998, A preliminary assessment of in place coalbed<br />
methane resources in the Virginia portion of the central Appalachian<br />
Basin: International Journal of Coal Geology, v.38, p. 115-136.<br />
Nuttall, B. C., 1996, Middle and Upper Ordovician bioclastic carbonate<br />
(“Trenton”) play, p. 168-171, in Roen, J. B., and Walker, B. J., eds., The<br />
atlas of major Appalachian gas plays: West Virginia <strong>Geologic</strong>al and Economic<br />
Survey Publication V-25, p. 168-171.<br />
Nuttall, B.C., Drahovzal, J.A., Eble, C.F., and Bustin, R.M., 2005b, Analysis<br />
of the Devonian black shale in Kentucky for potential carbon dioxide<br />
sequestration and enhanced natural gas production, Quarterly <strong>Report</strong>:<br />
Kentucky <strong>Geologic</strong>al Survey, report of research in progress:
APPENDIX A: REFERENCES CITED<br />
149<br />
Patchen, D.G., 1968, Oriskany Sandstone-Huntersville Chert gas production<br />
in the eastern half of West Virginia: West Virginia <strong>Geologic</strong>al and Economic<br />
Survey, Circular 9, 38 p.<br />
Patchen, D. G., 1996, The Upper Silurian Newburg sandstone play, in Roen,<br />
J.B., and Walker, B.J., eds., The atlas of major Appalachian gas plays:<br />
West Virginia <strong>Geologic</strong>al and Economic Survey publication V-25, p.<br />
139-144.<br />
Patchen, D.G., Avary, K.L., and Erwin, R.B., Coordinators 1985a, Northern<br />
Appalachian region correlation chart: American Association of Petroleum<br />
Geologists, Correlation of Stratigraphic Units of North America<br />
(COSUNA) Project, 1 sheet.<br />
Patchen, D.G., Avary, K.L., and Erwin, R.B., Coordinators, 1985b, Southern<br />
Appalachian region correlation chart: American Association of Petroleum<br />
Geologists, Correlation of Stratigraphic Units of North America<br />
(COSUNA) Project, 1 sheet.<br />
Patchen, D. G., and Harper, J. A., 1996, The Lower Devonian Oriskany<br />
Sandstone combination traps play, in Roen, J. B., and Walker, B. J., eds.,<br />
The atlas of major Appalachian gas plays: West Virginia <strong>Geologic</strong>al and<br />
Economic Survey, Publication V-25, p. 118-125.<br />
Patchen, D. G., and Smosna, R. A., 1975, Stratigraphy and petrology of<br />
Middle Silurian McKenzie Formation in West Virginia: American Association<br />
of Petroleum Geologists, v. 59, p. 2266-2287.<br />
Pinsak, A. P., and Shaver, R. H., 1964, The Silurian formations of northern<br />
Indiana: Indiana <strong>Geologic</strong>al Survey, Bulletin 32, 87 p.<br />
Piotrowski, R.G., 1981, Geology and natural gas production of the Lower<br />
Silurian Medina Group and equivalent rock units in Pennsylvania: Pennsylvania<br />
<strong>Geologic</strong>al Survey, 4 th ser., Mineral Resource <strong>Report</strong> 82, 21 p.<br />
Piotrowski, R. G., and Krajewski, S. A., 1979, Drilling depth map to the top<br />
of the Middle Devonian Onondaga Group: Morgantown Energy Technology<br />
Center, EGSP Series 10, Morgantown, WV.<br />
Pope, D. A., and Gordon, A. D., 1999, Simulation of ground-water flow and<br />
movement of the freshwater-saltwater interface in the New Jersey coastal<br />
plain: U.S. <strong>Geologic</strong>al Survey Water-Resources Investigations <strong>Report</strong><br />
98-4216, 159 p.<br />
Potter, P. E., 1978, Structure and isopach map of the New Albany-<br />
Chattanooga-Ohio Shale (Devonian and Mississippian) in Kentucky,<br />
central sheet: Kentucky <strong>Geologic</strong>al Survey, Series X, Structure and Geophysical<br />
Map, scale 1:250,000.<br />
Potter, P.E., Maynard, J.B., and Pryor, W.A., 1981, Sedimentology of gasbearing<br />
Devonian shales of the Appalachian Basin: University of Cincinnati,<br />
H.N. Fisk Laboratory of Sedimentology, 20 p. p.<br />
Pratt, T., Culotta,R., Hauser, E., Nelson, D., Brown, L., Kaufman, S., Oliver,<br />
J., and Hinze, W., 1989, Major Proterozoic basement features of the eastern<br />
Midcontinent of North America revealed by recent COCORP profiling:<br />
Geology, v. 17, p. 505-509.<br />
Price, M.L., 1981, A regional study of the St. Peter Sandstone in eastern<br />
Kentucky, in Luther, M.K., ed., Proceedings of the Technical Sessions<br />
Kentucky Oil and Gas Association 38 th Annual Meeting, 1974: Kentucky<br />
<strong>Geologic</strong>al Survey, ser.11, Special Publication 3, p. 1-19.<br />
Price, P. H., 1929, Pocahontas County: West Virginia <strong>Geologic</strong>al Survey, 531 p.<br />
Prosser, C. S., 1903, The nomenclature of the Ohio geological formations:<br />
Journal of Geology, v. 11, p. 519-546.<br />
Read, J.F., 1989a, Controls on evolution of Cambrian-Ordovician passive<br />
margins, U.S. Appalachians, in Crevello, P.S. (ed.), Controls on Carbonate<br />
Platform and Basin Development: Society of Economic Mineralogists<br />
and Paleontologists Special Publication 44, p. 147-162.<br />
Rice, C.L., Hiett, J.K., and Koozmin, E.D., 1994, Glossary of Pennsylvanian<br />
stratigraphic names, central Appalachian basin, in Rice, C.L., ed., Elements<br />
of Pennsylvanian stratigraphy, central Appalachian basin: <strong>Geologic</strong>al<br />
Society of America Special Paper 294, p. 115-155.<br />
Rice, C.L., Sable, E.G., Dever, G.R., Jr. and Kehn, T.M., 1979, The Mississippian<br />
and Pennsylvanian (Carboniferous) Systems in the United States—<br />
Kentucky: U.S. <strong>Geologic</strong>al Survey Professional Paper 1110-F, 32 p.<br />
Rice, D.D., and Finn, T.M., 1996, <strong>Geologic</strong> framework and description of<br />
coalbed gas plays: Appalachian basin province, in Gautier, D.L., Dolton,<br />
G.L., Takahaski, K.I., and Varnes, K.L., eds., 1995 National assessment<br />
of United States oil and gas resources; results, methodology, and supporting<br />
data: U.S. <strong>Geologic</strong>al Survey, Denver, Digital Data Series DDS-30,<br />
CD-ROM.<br />
Richards, H. G. 1974, Structural and stratigraphic framework of the Atlantic<br />
coastal plain, in Oaks, R. Q., Jr., and DuBar, J. R., eds., Post-Miocene<br />
stratigraphy, central and southern Atlantic coastal plain: Logan UT, Utah<br />
State University Press, p. 11-19.<br />
Rickard, L.V., 1973, Stratigraphy and Structure of the Subsurface Cambrian<br />
and Ordovician Carbonates of New York: New York State Museum Map<br />
& Chart No. 18, 77p.<br />
Rickard, L. V., 1984, Correlation of the subsurface Lower and Middle Devonian<br />
of the Lake Erie region: <strong>Geologic</strong>al Society of America Bulletin,<br />
v. 95, p. 814-828.<br />
Riley, R.A, Baranoski, M.T., and Wickstrom, L.H., 2004, Oil and gas<br />
fields map of Ohio: Ohio Division of <strong>Geologic</strong>al Survey PG-1, scale 1:<br />
500,000.<br />
Riley, R. A., Harper, J. A., Baranoski, M. T., Laughrey, C. D., and Carlton, R.<br />
W., 1993, Measuring and predicting reservoir heterogeneity in complex<br />
deposystems: The Late Cambrian Rose Run sandstone of eastern Ohio<br />
and western Pennsylvania. Appalachian Oil and Natural Gas Research<br />
Consortium, West Virginia University, Morgantown, WV, U.S. Department<br />
of Energy, contract no. DE-AC22-90BC14657, 257 p.<br />
Riley, R.A., Wicks, J., and Thomas, J., 2002, Cambrian-Ordovician Knox<br />
production in Ohio: Three case studies of structural-stratigraphic traps:<br />
American Association of Petroleum Geologists v. 86, no.4, p. 539-555.<br />
Rodgers, J., and Kent, D.F., 1948, Stratigraphic section at Lee Valley,<br />
Hawkins County, Tennessee: Tennessee Division of Geology, Bulletin<br />
55, p. 7-9.<br />
Roen, J.B., and Kepferle, R.C., eds., 1993, Petroleum Geology of the Devonian<br />
and Mississippian Black Shale of Eastern North America: U. S. <strong>Geologic</strong>al<br />
Survey Bulletin 1909, U.S. Government Printing Office, p. various.<br />
Roen, J.B., and Walker, B.J., eds., 1996, The atlas of major Appalachian<br />
gas plays: West Virginia <strong>Geologic</strong>al and Economic Survey, Publication<br />
V-25, 201 p.<br />
Rupp, J.A., 1991, Structure and isopach maps of the Paleozoic rocks of Indiana:<br />
Indiana <strong>Geologic</strong>al Survey, Special <strong>Report</strong> 48, 106 p.<br />
Russell, W. L., 1972, Pressure-depth relations in Appalachian region: American<br />
Association of Petroleum Geologists Bulletin, v. 56, p. 528-536.<br />
Ryder, R.T., 1991, Stratigraphic framework of Cambrian and Ordovician<br />
rocks in the Central Appalachian basin from Richland County, Ohio, to<br />
Rockingham County, Virginia: U.S. <strong>Geologic</strong>al Survey, Miscellaneous<br />
Investigations Series, Map I-2264.<br />
Ryder, R.T., 1992a, Stratigraphic framework of Cambrian and Ordovician<br />
rocks in the Central Appalachian basin from Morrow County, Ohio, to<br />
Pendleton County, West Virginia: U.S. <strong>Geologic</strong>al Survey Bulletin 1839-<br />
G, 25 p., 1 pl.<br />
Ryder, R.T., 1992b, Stratigraphic framework of Cambrian and Ordovician<br />
rocks in the Central Appalachian basin from Lake County, Ohio, to<br />
Juniata County, Pennsylvania: U.S. <strong>Geologic</strong>al Survey Miscellaneous<br />
Investigations Series Map I-2200.<br />
Ryder, R.T., 1996, Fracture Patterns and Their Origin in the Upper Devonian<br />
Antrim Shale Gas Reservoir of the Michigan Basin: A Review: U. S.<br />
<strong>Geologic</strong>al Survey Open-File <strong>Report</strong> 96-23, .<br />
Ryder, R.T., 2004, Stratigraphic framework and depositional sequences in<br />
the Lower Silurian regional oil and gas accumulation, Appalachian basin:<br />
from Ashland County, Ohio, through southwestern Pennsylvania, to Preston<br />
County, West Virginia: United States <strong>Geologic</strong>al Survey, <strong>Geologic</strong><br />
Investigations Series Map I-2810.<br />
Ryder, R.T., Burruss, R.C., and Hatch, J.R., 1998, Black shale source rocks<br />
and oil generation in the Cambrian and Ordovician of the central Appalachian<br />
Basin, USA: American Association of Petroleum Geologist<br />
Bulletin, v. 82, p. 412-441.<br />
Ryder, R. T., Burruss, R. C., and Hatch, J. R., 1991, Geochemistry of selected<br />
oil and source rock samples from Cambrian and Ordovician strata,<br />
Ohio-West Virginia-Tennessee part of the Appalachian basin. U. S. <strong>Geologic</strong>al<br />
Survey Open-File <strong>Report</strong> 91-434, 71 p.<br />
Ryder, R.T., Harris, A.G., and Repetski, J.E., 1992, Stratigraphic framework<br />
of Cambrian and Ordovician rocks in the Central Appalachian basin from<br />
Medina County, Ohio, through southwestern and south-central Pennsylvania,<br />
to Hampshire County, West Virginia: U.S. <strong>Geologic</strong>al Survey,<br />
Bulletin 1839-K, 32 p.
150 CHARACTERIZATION OF GEOLOGIC SEQUESTRATION OPPORTUNITIES IN THE <strong>MRCSP</strong> REGION<br />
Ryder, R.T., Repetski, J.E., and Harris, A.G., 1995, Stratigraphic framework<br />
of Cambrian and Ordovician rocks in the central Appalachian basin from<br />
Fayette County, Ohio, to Botetourt County, Virginia: U.S. <strong>Geologic</strong>al<br />
Survey Miscellaneous Investigations Series Map I-2495.<br />
Ryder, R.T., Repetski, J.E., and Harris, A.G., 1996, Stratigraphic framework<br />
of Cambrian and Ordovician rocks in the central Appalachian basin from<br />
Fayette County, Ohio, to Botetourt County, Virginia: U.S. <strong>Geologic</strong>al<br />
Survey Miscellaneous Investigations Series Map I-2495.<br />
Ryder, R.T., Repetski, J.E., and Harris, A.G., 1997, Stratigraphic framework<br />
of Cambrian and Ordovician rocks in the Central Appalachian basin from<br />
Campbell County, Kentucky, to Tazewell County, Virginia: U.S. <strong>Geologic</strong>al<br />
Survey, Miscellaneous Investigations Series, Map I-2350.<br />
Safford, J.M., 1869, Geology of Tennessee: Nashville, TN, 550 p.<br />
Sanders, L.L, 1991, Geochemistry of formation waters from the Lower Silurian<br />
Clinton Formation (Albion Sandstone), eastern Ohio: American Association<br />
of Petroleum Geologists Bulletin, v. 75, no. 10, p. 1593-1608.<br />
Santos, J.O.S., Hartman, L.A., McNaughton, N.J., Easton, R.M., Rea,<br />
R.G., and Potter, P.E., 2002, Sensitive high resolution ion microprobe<br />
(SHRIMP) detrital zircon geochronology provides new evidence for a<br />
hidden Neoproterozoic foreland basin to the Grenville Orogen in the<br />
eastern <strong>Midwest</strong>, U.S.A.: Canadian Journal of Earth Sciences, v. 39, no.<br />
10, p. 1505-1515.<br />
Scherzer, W. H., and Grabau, A. W., 1909, New Upper Siluric fauna from<br />
southern Michigan: <strong>Geologic</strong>al Society of America Bulleting, v. 19, p.<br />
540-553.<br />
Schmoker, J. W., 1993, Use of formation-density logs to determine organiccarbon<br />
content in Devonian shales of the western Appalachian Basin and<br />
an additional example based on the Bakken Formation of the Williston<br />
Basin, in Roen, J.B. and Kepferle, R.C., eds., Petroleum geology of the<br />
Devonian and Mississippian black shale of eastern North America: U. S.<br />
<strong>Geologic</strong>al Survey Bulletin 1909, p. J1-J14.<br />
Scotese, C. R., and McKerrow, W. S., 1991, Ordovician plate tectonic reconstructions,<br />
in Barnes, C. R., and Williams, S. H., eds., Advances in Ordovician<br />
Geology: <strong>Geologic</strong>al Survey of Canada Paper 90-9, p. 271-282.<br />
Sears, S. O., & Lucia, F. J. (1979). Reef-growth model for Silurian pinnacle<br />
reefs, northern Michigan reef trend: Geology, v. 7, 299-302.<br />
Sears, S. O., & Lucia, F. J. (1980). Dolomitization of Northern Michigan Niagara<br />
Reefs by Brine Refluxion and Freshwater/Seawater Mixing: SEPM<br />
Special Publication no. 28, 215-235.<br />
Seilacher, Adolphe, 1968, Origin and diagenesis of the Oriskany Sandstone<br />
(Lower Devonian, Appalachians) as reflected in its shell fossils, in Muller,<br />
G., and Friedman, G. M., eds., Recent developments in carbonate sedimentology<br />
in central Europe: Springer-Verlag, New York, p. 175-185.<br />
Sevon, W. D., 1968, Lateral continuity of the Ridgeley, Schoharie-Esopus<br />
and Palmerton Formations in Carbon and Schuylkill Counties, Pennsylvania:<br />
Pennsylvania Academy of Science Proceedings, v. 42, p. 190-192.<br />
Shanmugam, G., and Lash, Gary, 1982, Analogous tectonic evolution of the<br />
Ordovician foredeeps, southern and central Appalachians: Geology, v. 10,<br />
p. 562-566.<br />
Shaver, R.H., 1974, The Muscatatuck Group (new Middle Devonian name)<br />
in Indiana: Indiana <strong>Geologic</strong>al Survey Occasional Paper 3, 7 p.<br />
Shaver, R.H. (1991). A history of study of Silurian reefs in the Michigan<br />
Basin environs: <strong>Geologic</strong>al Society of America, 101-137.<br />
Shaver, R.H. (1996). Silurian sequence stratigraphy in the North American<br />
craton, Great Lakes area. In B. J. Witzke, G. A. Ludvigson & J. Day<br />
(Eds.), Paleozoic Sequence Stratigraphy: Views from the North American<br />
Craton (Vol. 306, pp. 193-202). Boulder: <strong>Geologic</strong>al Society of America.<br />
Shaver, R.H., and others, 1986. Compendium of Paleozoic rock-unit stratigraphy<br />
in Indiana—a revision of Indiana <strong>Geologic</strong>al Survey Bulletin 59.<br />
Shaver, R. H., & Sunderman, J. A. (1989). Silurian seascapes: Water depth,<br />
clinothems, reef geometry, and other motifs-A critical review of the Silurian<br />
reef model: <strong>Geologic</strong>al Society of America Bulletin, 101, 939-951.<br />
Shearrow, G.G., 1987, Maps and cross sections of the Cambrian and Lower<br />
Ordovician in Ohio: Ohio <strong>Geologic</strong>al Society, 31 p.<br />
Sherrard, S. J., and Heald, M. T., 1984, Petrology of the Huntersville Chert:<br />
Southeastern Geology, v. 25, p. 37-47.<br />
Shideler, G.L., 1969, Dispersal patterns of Pennsylvanian Sandstones in the<br />
Michigan Basin: Journal of Sedimentary Petrology, v.39, p. 1229-1237.<br />
Shrake, D.L., P.J. Wolfe, B.H. Richard, E.M. Swinford, L.H. Wickstrom,<br />
P.E. Potter, and G.W. Sitler, 1990, Lithologic and geophysical description<br />
of a continuously cored hole in Warren County, Ohio, including description<br />
of the Middle Run Formation (Precambrian) and a seismic profile<br />
across the core site: Ohio Division of <strong>Geologic</strong>al Survey Information<br />
Circular 56.<br />
Shumaker, R.C., 1986, Structural development of Paleozoic continental<br />
basins of eastern North America, in M.J. Aldrich, Jr., and A.W. Laughlin,<br />
eds., Proceedings of the 6 th International Conference on Basement Tectonics:<br />
Salt Lake City, Basement Tectonics Association, p. 82-95.<br />
Shumaker, Robert C., 1996, Structural history of the Appalachian Basin: in<br />
Roen, J.B. and Walker, B.J., eds. The Atlas of Major Appalachian Gas<br />
Plays, West Virginia <strong>Geologic</strong>al and Economic Survey Publication V-25,<br />
Plate 1, p. 11-15.<br />
Sims, P.K., Van Schmus, W.R., Schulz, K.J., and Peterman, Z.E., 1989, Tectonostratigraphic<br />
evolution of the Early Proterozoic Wisconsin magmatic<br />
terranes of the Penokean orogen: Canadian Journal of Earth Sciences, v.<br />
26, p. 2145-2158.<br />
Sloss, L. L., Krumbein, W. C., and Dapples, E. C., 1949, Integrated facies<br />
analysis, in Longwell, C. R., chairman, Sedimentary facies in geologic<br />
history: <strong>Geologic</strong>al Society of America Memoir 39, p. 91-123.<br />
Smith. E.A., 1890, On the geology of the valley regions adjacent to the Cahaba<br />
Field, in Squire, J. (ed.), <strong>Report</strong> on the Cahaba Coal Field: <strong>Geologic</strong>al<br />
Survey of Alabama, p. 149.<br />
Smith, E.I., 1978, Precambrian rhyolites and granitesin south-central Wisconsin:<br />
<strong>Geologic</strong>al Society of America Bulletin, v. 89, p. 875-890.<br />
Smosna, R.A., Conrad, M.J., and Maxwell, T., 1989, Stratigraphic traps in<br />
Silurian Lockport Dolomite of Kentucky: American Association of Petroleum<br />
Geologists Bulletin, v. 73, p. 876-886.<br />
Smosna, Richard, and Patchen, Douglas, 1978, Silurian evolution of central<br />
Appalachian basin: American Association of Petroleum Geologists Bulletin,<br />
v. 62, p. 2308-2328.<br />
Smosna, R.A., Patchen, D.G., Warshauer, S.M., and Perry, W.J., Jr., 1977,<br />
Relationships between depositional environments, Tonoloway Limestone,<br />
and distribution of evaporates in the Salina Formation, West Virginia, in<br />
Fisher, J.H. (ed.), Reefs and Evaporites—Concepts and Depositional<br />
Models: American Association of Petroleum Geologists Studies in Geology<br />
5, p. 125-143.<br />
Stark , T. J., 1997, The East Continent Rift Complex: Evidence and conclusions,<br />
in Ojakangas, R. W., Dickas, A. B., and Green, J. C., eds., Middle<br />
Proterozoic to Cambrian Rifting, Central North America: <strong>Geologic</strong>al<br />
Society of America Special Paper 312, p. 253-266.<br />
Stose, G.W., 1906, Sedimentary rocks of South Mountain, Pennsylvania:<br />
Journal of Geology, v. 14, p. 201-220.<br />
Stose, G.W., 1908, The Cambro-Ordovician limestones of the Appalachian<br />
Valley in southern PA: Journal of Geology, v. 16, p. 698-714.<br />
Stow, M. H., 1938, Conditions of sedimentation and sources of the Oriskany<br />
Sandstone as indicated by petrology: American Association of Petroleum<br />
Geologists Bulletin, v. 22, p. 541-564.<br />
Sullivan, M. P., 1983, The Granville facies: Middle Ordovician barrier-beach<br />
hydrocarbon reservoirs in south-central Kentucky: University of Cincinnati,<br />
M.S. thesis, 150 p.<br />
Summerson, C. H., and Swann, D. H., 1970, Patterns of Devonian sand on<br />
the North American craton and their interpretation: <strong>Geologic</strong>al Society of<br />
America Bulletin, v. 81, p. 469-490.<br />
Swartz, C. K., 1913, The Lower Devonian deposits of Maryland: Correlation<br />
of the Lower Devonian: Maryland <strong>Geologic</strong>al Survey, Lower Devonian,<br />
p. 96-123.<br />
Swartz, F. M., 1939, The Keyser limestone and Helderberg group: The<br />
Devonian Pennsylvania: Pennsylvania <strong>Geologic</strong>al Survey, 4 th ser., Bull.<br />
G19, p. 29-91<br />
Templeton, J. S., and Willman, H. B., 1952, Central northern Illinois: Tri-<br />
State <strong>Geologic</strong>al Society, 16th Annual Field Conference, Guidebook GB<br />
2, October 11-12, Dixon, Illinois, 47 p.<br />
Thompson, A. M., 1970, Lithofacies and formation nomenclature in Upper<br />
Ordovician stratigraphy, central Appalachians: <strong>Geologic</strong>al Society of<br />
America Bulletin, v. 81, p. 1255-1260.<br />
Thompson, A. M., 1999, Chapter 5: Ordovician, in Shultz, C. H., ed., The<br />
Geology of Pennsylvania: Pennsylvania <strong>Geologic</strong>al Survey, 4 th ser., Special<br />
Publication 1, 888 p.
APPENDIX A: REFERENCES CITED<br />
151<br />
Thwaites, F.T., 1923, The Paleozoic rocks found in deep wells in Wisconsin<br />
and northern Illinois: Journal of Geology, v. 31, p. 550.<br />
Tomastik, T.E., 1997, The Sedimentology of the Bass Islands and Salina<br />
Groups in Ohio and its effect on solution—salt mining and underground<br />
storage: Carbonates and Evaporites, v. 12, p. 236-253.<br />
Tomastik, T. E., 2001, Salt deposits of Ohio-geology, mining, and uses: Ohio Division<br />
of <strong>Geologic</strong>al Survey 2001 report on Ohio mineral industries, p. 1-7.<br />
Torrey, P. D., 1931, Natural gas from Oriskany Formation in central New<br />
York and northern Pennsylvania: American Association of Petroleum<br />
Geologists Bulletin, v. 15, p. 671-688.<br />
Trapp, H., Jr., 1992, Hydrogeologic framework of the northern Atlantic<br />
coastal plain in parts of North Carolina, Virginia, Maryland, Delaware,<br />
New Jersey, and New York: U.S. <strong>Geologic</strong>al Survey Professional Paper<br />
1404-G, 59 p., 13 plates.<br />
Trapp, H., Jr., and Horn, M. A., 1997, Ground water atlas of the United<br />
States—segment 11, Delaware, Maryland, New Jersey, North Carolina,<br />
Pennsylvania, Virginia, West Virginia: U.S. <strong>Geologic</strong>al Survey Hydrologic<br />
Investigations, Atlas No. HA-730-L, 30 p.<br />
Trapp, H., Jr., Knobel, L. L., Meisler, H., and Leahy, P. P., 1984, Test well<br />
DO-CE 88 at Cambridge, Dorchester County, Maryland: U.S. <strong>Geologic</strong>al<br />
Survey Water-Supply Paper 2229, 48 p.<br />
Trapp, H., Jr., and Meisler, H., 1992, The regional aquifer underlying the<br />
northern Atlantic coastal plain in parts of North Carolina, Virginia, Maryland,<br />
Delaware, New Jersey, and New York—summary: U.S. <strong>Geologic</strong>al<br />
Survey Professional Paper 1404A, 33 p., 11 plates.<br />
Trowbridge, A.C., and Atwater, G.I., 1934, Stratigraphic problems in the<br />
upper Mississippi Valley: <strong>Geologic</strong>al Society of America Bulletin, v. 45,<br />
p. 45, 79.<br />
Uhler, P. R., 1905, The Niagara period and its associates near Cumberland,<br />
Maryland: Maryland Academy of Science Transactions, v. 2, p. 19-26.<br />
Ulrich, E. O., 1911, Revision of the Paleozoic systems: <strong>Geologic</strong>al Society<br />
of America Bulletin, v. 22, p. 281-680.<br />
Ulteig, J. R., 1964, Upper Niagaran and Cayugan stratigraphy of northeastern<br />
Ohio and adjacent areas: Ohio Division of <strong>Geologic</strong>al Survey <strong>Report</strong><br />
of Investigation 51, 48 p.<br />
Van Petten, O. W., 1939, Drilling and operating practices in Oriskany sand<br />
fields of Kanawha County, West Virginia: American Petroleum Institute,<br />
Drilling and Production Practice, 1938, p. 58-73.<br />
Van Schmus, W. R. and Hinze, W. J., 1985, The Midcontinent Rift System:<br />
Annual Review of Earth and Planetary Sciences, v. 13, p. 345-383.<br />
Van Schmus, W. R., Bickford, M.E., Sims, P.K., Anderson, R.R., Shearer,<br />
C.K. and Treves, S.B., 1993, Proterozoic geology of the western Midcontinent<br />
basement, in Reed, J.C., Jr and others, eds., Precambrian: Conterminous<br />
U.S.: The Geology of North America, v. C-2, <strong>Geologic</strong>al Society<br />
of America, p. 239-259.<br />
Van Schmus, W. R. and Hinze, W. J., 1993, Midcontinent Rift System, in<br />
Reed, J.C., Jr and others, eds., Precambrian: Conterminous U.S.: The<br />
Geology of North America, v. C-2, <strong>Geologic</strong>al Society of America, p.<br />
292-303.<br />
Van Tyne, A.M., 1996a, Middle Devonian Onondaga Limestone Reef Play,<br />
in Roen, J.B., and Walker, B.J., eds., The atlas of major Appalachian gas<br />
plays: West Virginia <strong>Geologic</strong>al and Economic Survey Publication V-25,<br />
p.100-102.<br />
Van Tyne, A.M. 1996b, Upper Silurian Bass Islands Trend, p. 130-132, in<br />
Roen, J.B., and Walker, B.J., eds., The atlas of major Appalachian gas plays:<br />
West Virginia <strong>Geologic</strong>al and Economic Survey Publication V-25, 201 p.<br />
Vanuxem, Lardiner, 1838, Second annual report of the <strong>Geologic</strong>al Survey of<br />
the third district of the State of New York: New York <strong>Geologic</strong>al Survey<br />
Annual <strong>Report</strong>, v. 2, p. 253-286.<br />
Vanuxem, Lardiner, 1839, Third annual report of the <strong>Geologic</strong>al Survey of the<br />
third district: New York <strong>Geologic</strong>al Survey, Annual <strong>Report</strong> 1839, p. 273.<br />
Vanuxem, Lardiner, 1840, Fourh annual report of the <strong>Geologic</strong>al Durvey of<br />
the third district. New York Survey, Annual <strong>Report</strong> 4, p. 355-383.<br />
Vanuxem, Lardiner, 1842, Geology of New York, Part III, comprising the<br />
survey of the Third <strong>Geologic</strong> District, 306 p.<br />
Vugrinovich, Ray, 1984, Lithostratigraphy and depositional environments<br />
of the Pennsylvanian rocks and the Bayport Formation of the Michigan<br />
Basin: Michigan <strong>Geologic</strong>al Survey, <strong>Report</strong> of Investigation 27, 33p.<br />
Wagner, W.R., 1961, Subsurface Cambro-Ordovician stratigraphy of northwestern<br />
Pennsylvania and bordering states: Pennsylvania <strong>Geologic</strong>al<br />
Survey, 4th ser., Progress <strong>Report</strong> 156, 22 p.<br />
Wagner, W.R., 1966a, Exploration for hydrocarbons in the Cambrian rocks<br />
of northwestern Pennsylvania, in Petroleum geology of the Appalachian<br />
Basin: 25th Technical Conference on Petroleum Production, Proceedings,<br />
University Park, PA, October 19-21, 1966, p. 75-95.<br />
Wagner, W.R., 1966b, Pennsylvanians must delve into rocks of ancient age:<br />
Oil and Gas Journal, v. 64, no. 50, p. 152-158.<br />
Wagner, W.R., 1966c, Stratigraphy of the Cambrian to Middle Ordovician<br />
rocks of central and western Pennsylvania: Pennsylvania <strong>Geologic</strong>al Survey,<br />
4th ser., General Geology <strong>Report</strong> 49, 156 p.<br />
Wagner, W.R., 1976, Growth faults in Cambrian and Lower Ordovician<br />
rocks of western Pennsylvania: American Association of Petroleum Geologists,<br />
v. 60, no. 3, p. 414-427.<br />
Walcott, C. D., 1914, Cambrian geology and paleontology: Smithsonian<br />
Misc. Coll., v. 57, p. 345-412.<br />
Walker, R. G., and James, N. P., eds., 1992, Facies models—Response to sea<br />
level change: <strong>Geologic</strong>al Association of Canada, 409 p.<br />
Wallace, L. G., and Roen, J. B., 1989, Petroleum source rock potential of the<br />
Upper Ordovician black shale sequence, northern Appalachian basin: U.<br />
S. <strong>Geologic</strong>al Survey Open-file <strong>Report</strong> 89-488, 66 p.<br />
Wanless, H.R. and Shideler, G.L., 1975, Michigan Basin Region, Paleotectonic<br />
Investigations of the Pennsylvanian System in the United States,<br />
Part I—Introduction and regional analysis of the Pennsylvanian System:<br />
U.S. <strong>Geologic</strong>al Survey Professional Paper 853-D, p. 63-70.<br />
Warner, D., 1989, Hydrologic and hydrochemical assessment of the basal<br />
sandstone and overlying Paleozoic age units for wastewater injection and<br />
confinement in the North Central Region: Underground Injection Practices<br />
Council Research Foundation, 183 p.<br />
Webb, E.J., 1980, Cambrian sedimentation and structural evolution of the<br />
Rome Trough: Cincinnati, Ohio, University of Cincinnati, PhD dissertation,<br />
97 p.<br />
Weed, E. G. A., 1982, Huntersville Chert (Devonian) extending from southwestern<br />
Virginia into southwestern New York, and its Bobs Ridge Sandstone<br />
Member: U.S. <strong>Geologic</strong>al Survey Bulletin 1529-H, p. H131-H133.<br />
Weir, G. W., Greene, R. C. and Simmons, G. C., 1965, Calloway Creek<br />
Limestone and Ashlock and Drakes Formations (Upper Ordovician) in<br />
south-central Kentucky, in Contributions to stratigraphy, 1965: U. S.<br />
<strong>Geologic</strong>al Survey Bulletin 1224-D, p. D1-D36.<br />
Weir, G. W., Peterson, W. L., and Swadley, W. C., 1984, Lithostratigraphy of<br />
Upper Ordovician strata exposed in Kentucky: U. S. <strong>Geologic</strong>al Survey<br />
Professional Paper 1151-E, p. E1-E121.<br />
Welsh, R. A., 1984, Oriskany Sandstone depositional environment and fracture<br />
porosity in Somerset County, Pennsylvania: University of Pittsburgh,<br />
M.S. thesis, 116 p.<br />
Westjohn, D.B., and Weaver, T.L., 1998, Hydrogeologic Framework of the<br />
Michigan Basin Regional Aquifer System, Regional Aquifer System<br />
Analysis—Michigan Basin Aquifer System: U.S. <strong>Geologic</strong>al Survey<br />
Professional Paper 1418, 47p.<br />
Wheeler, H. E., 1963, Post-Sauk and pre-Absaroka Paleozoic stratigraphic<br />
patterns in North America: American Association of Petroleum Geologists<br />
Bulletin, v. 47, p. 1497-1526.<br />
White, C. A., 1870, Cretaceous system, Chapter V; General Geology, Part II;<br />
<strong>Report</strong> on the <strong>Geologic</strong>al Survey of the State of Iowa to the 13th General<br />
Assembly, January, 1870, containing results of examinations and observations<br />
made within the years 1866, ‘67, ‘68, and ‘69; Volume 1: Iowa<br />
<strong>Geologic</strong>al Survey [<strong>Report</strong>], p. 285-294.<br />
White, C.M., Smith, D.H., Jones, K.L, and 7 others, 2005, Sequestration<br />
of carbon dioxide in coal with enhanced coalbed methane recovery—A<br />
review: Energy and Fuels, v. 19, n. 3, p. 659-724.<br />
White, I. C., 1883, The geology of the Susquehanna River region in the<br />
six counties of Wyoming, Lackawanna, Luzerne, Columbia, Montour,<br />
and Northumberland: Second <strong>Geologic</strong>al Survey of Pennsylvania, v.<br />
G7, 464 p.<br />
Wickstrom, L. H., 1996, Play Mof: Middle Ordovician fractured carbonates,<br />
p. 172-176, in Roen, J. B., and Walker, B. J., eds., The atlas of major<br />
Appalachian gas plays: West Virginia <strong>Geologic</strong>al and Economic Survey<br />
Publication V-25, 201 p.<br />
Wickstrom, L. H., Drahovzal, J. A., and Keith, B. D., coordinators, 1992a,
152 CHARACTERIZATION OF GEOLOGIC SEQUESTRATION OPPORTUNITIES IN THE <strong>MRCSP</strong> REGION<br />
The geology and geophysics of the East Continent Rift Basin: Indiana<br />
<strong>Geologic</strong>al Survey Open File <strong>Report</strong> OFR 92-4, 337 p.<br />
Wickstrom, L. H., Gray, J. D., and Steiglitz, R. D., 1992b, Stratigraphy,<br />
structure, and production history of the Trenton Limestone (Ordovician)<br />
and adjacent strata in northwestern Ohio: Ohio Division of <strong>Geologic</strong> Survey<br />
<strong>Report</strong> of Investigations 143, 78 p.<br />
Willard, Bradford, Cleaves, A.B., 1939, Ordovician-Silurian relations in<br />
Pennsylvania: <strong>Geologic</strong>al Society of America Bulletin, v. 50, no. 7, p.<br />
1165-1198.<br />
Williams, M.Y., 1914, Stratigraphy of the Niagara Escarpment of southwestern<br />
Ontario: <strong>Geologic</strong>al Survey of Canada, Summary <strong>Report</strong> for 1913,<br />
p. 178-188.<br />
Wilson, J.L., 1952, Upper Cambrian stratigraphy in the central Appalachians:<br />
<strong>Geologic</strong>al Society of America Bulletin, v. 63, p. 275-322.<br />
Wilson, T.H., 2000, Seismic evaluation of differential tectonic subsidence,<br />
compaction, and loading in an interior basin: American Association of<br />
Petroleum Geologists Bulletin, v. 84, no. 3, p. 376-398.<br />
Winslow, Arthur, 1894, Lead and zinc deposits: Missouri Bureau of Geology<br />
and Mines <strong>Report</strong>, v. 6-7, 763 p.<br />
Wood, G. V., 1960, A comparison of three quartzites. Pennsylvania State<br />
University, Ph.D. dissertation, 159 p.<br />
Woodward, H. P., 1943, Devonian System of West Virginia: West Virginia<br />
<strong>Geologic</strong>al and Economic Survey, v. 15, 655 p.<br />
Woodward, H.P., 1961, Preliminary subsurface study of southeastern Appalachian<br />
interior plateau: American Association of Petroleum Geologists<br />
Bulletin, v. 45, p. 1634-1655.<br />
Yeakel, L.S., 1962, Tuscarora, Juniata, and Bald Eagle paleocurrents and paleogeography<br />
in the central Appalachians: <strong>Geologic</strong>al Society of America<br />
Bulletin, v. 73, p. 1515-1540.<br />
Young, R. S., and Harnberger, W. T., 1955, Geology of Bergton gas field,<br />
Rockingham County, Virginia: American Association of Petroleum Geologists<br />
Bulletin, v. 39, p. 317-328.<br />
Zielinski, R.E., and McIver, R.D., 1982, Resource and Exploration Assessment<br />
of the Oil and Gas Potential in the Devonian Gas Shales of the<br />
Appalachian Basin: U. S. Department of Energy, MLM-MU-82-61-0002,<br />
DOE/DP/0053-1125, 326 p.