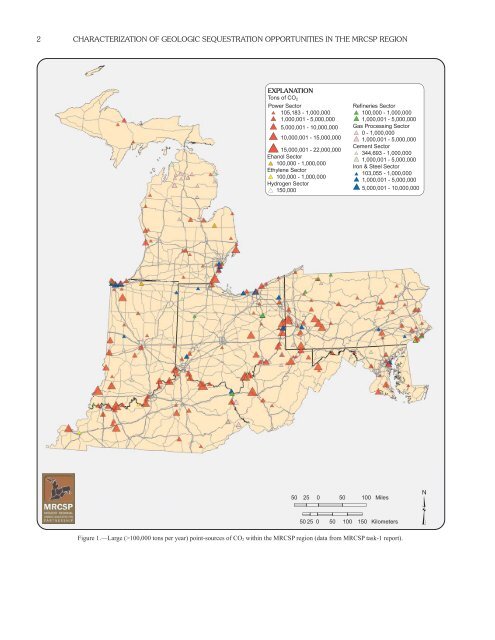
2 CHARACTERIZATION OF GEOLOGIC SEQUESTRATION OPPORTUNITIES IN THE <strong>MRCSP</strong> REGION EXPLANATION Tons of CO 2 Power Sector #* #* #* #* #* 105,183 - 1,000,000 1,000,001 - 5,000,000 5,000,001 - 10,000,000 10,000,001 - 15,000,000 15,000,001 - 22,000,000 Ehanol Sector #* 100,000 - 1,000,000 Ethylene Sector #* 100,000 - 1,000,000 Hydrogen Sector #* 150,000 Refineries Sector #* 100,000 - 1,000,000 #* 1,000,001 - 5,000,000 Gas Processing Sector #* 0 - 1,000,000 #* 1,000,001 - 5,000,000 Cement Sector #* 344,693 - 1,000,000 #* 1,000,001 - 5,000,000 Iron & Steel Sector #* 103,055 - 1,000,000 #* 1,000,001 - 5,000,000 5,000,001 - 10,000,000 #* 50 25 0 50 100 Miles 5025 0 50 100 150 Kilometers ³ Figure 1.—Large (>100,000 tons per year) point-sources of CO 2 within the <strong>MRCSP</strong> region (data from <strong>MRCSP</strong> task-1 report).
BACKGROUND INFORMATION 3 (a minimum depth of approximately 2,500 feet below the surface is required to maintain the CO 2 in the supercritical phase). Natural geologic reservoirs have held oil, natural gas, water, and even CO 2, for millions of years without leaking (or at least with minimal leakage). Therefore, these same systems are thought to offer both nearterm opportunities and longer-term possibilities for future management of anthropogenic CO 2 (Reichle and others, 1999; Beecy and others, 2002). Societal industries currently use these natural reservoirs for storage of industrial wastes (Class I injection wells) and the disposal of oil field brines (Class II injection wells). The injection of CO 2 into oil fields in order to stimulate additional oil production [Class II enhanced oil recovery (EOR) injection wells] is a growing methodology in the petroleum industry. Thus, a substantial quantity of experience currently exists on CO 2 injection operations. Furthermore, several large-scale CO 2 geologic sequestration projects have been in operation for several years; these include the North Sea Sleipner project (injecting into a saline formation) (Gale and others, 2001) and the North American Weyburn project (sequestering CO 2 while performing enhanced oil recovery) (Whittaker, 2005; Brown and others, 2001). These projects have been closely monitored and studied, yielding much information to this emerging technology. Additionally, the injection of anthropogenic CO 2 may be in conjunction with the production of methane from unmineable coal beds or oil and/or natural gas from active or depleted petroleum reservoirs. In both cases the produced fuels may defray some of the cost of CO 2 capture and injection. While these enhanced recovery options are considered to be near-term opportunities, due to potentially favorable economic conditions, the overall storage capacity in coal beds or oil-and-gas reservoirs is relatively small compared to the potential of deep saline formations. POTENTIAL GEOLOGIC RESERVOIRS The U.S. Department of Energy has identified several categories of geologic reservoirs for potential CO 2 sequestration (U.S. Department of Energy, 1999, 2004, 2005). Of these categories, four are considered important for the <strong>MRCSP</strong> region: (1) deep saline formations, (2) oil and gas fields, (3) unmineable coal beds and (4) organic-rich (carbonaceous) shales. Deep Saline Formations Saline formations are natural salt-water bearing intervals of porous and permeable rocks that occur beneath the level of potable groundwater. Currently, a number of the saline formations in the <strong>MRCSP</strong> region are used for waste-fluid disposal (especially in Indiana, Michigan, and Ohio); thus, a long history of technological and regulatory factors exist that could be applied to CO 2 injection/ disposal. Saline formations are widespread, close to many large CO 2 sources, and are thought to have large pore volumes available for injection (Reichle and others 1999, U.S. DOE, 2004, 2005). In order to maintain the injected CO 2 in a supercritical phase (i.e. liquid) the geologic unit must be approximately 2,500-feet or greater in depth. Maintaining the CO 2 in a liquid phase is desirable because, as a liquid, it occupies less volume than when in the gaseous phase. One tonne of CO 2 at surface temperature and pressure (in gaseous phase) occupies approximately 18,000-cubic feet. The same amount of CO 2, when injected to approximately 2,600 feet in depth, will occupy only 50-cubic feet. Deep sequestration depths also help insure there is an adequate interval of rocks (confining layers) above the potential injection zones to act as a geologic seal. For the purposes of the <strong>MRCSP</strong> <strong>Phase</strong> I project, no consideration was given to the potential use of shallow saline formations for CO 2 sequestration. In this type of reservoir, CO 2 is injected, under pressure, down a specially constructed well where it displaces (hydrodynamic trapping) and mixes (solubility trapping) with saline water and fills the pore spaces between the mineral grains of the rocks in the reservoir and is trapped within minerals (mineral trapping) in the rock matrix. Depth, permeability, injectivity, reservoir pressure, reservoir integrity, and water chemistry are some of the variables that control the sequestration potential in deep saline formations (Reichle and others, 1999; Bach and Adams, 2003). In addition to favorable properties of the injection zone in the reservoir, an overlying seal unit (confining layers) is necessary. The injected CO 2 has a lower specific gravity, and thus, is more buoyant than the natural formation fluids and will rise to the top of the porous zones. Hence, all cap-rock units must be relatively impermeable and sufficiently thick to arrest any appreciable vertical movement of the CO 2 within the sequestration interval, thereby trapping it in the deep subsurface. The <strong>MRCSP</strong> geologic team collected data and mapped several intervals that would act as satisfactory cap rock as part of the <strong>Phase</strong> I study. Storage of CO 2 can be in either subsurface traps or in unconfined strata. In subsurface traps, the more buoyant CO 2 will occupy the highest portion of any structural (e.g. anticline) or stratigraphic (e.g. pinch-out) feature. This same mechanism of trapping is found in many of the natural gas and oil reservoirs (i.e., traps) that occur in the <strong>MRCSP</strong> study area. Within such traps, only the pore volume available in the rock and the size of the trap limits the volume of CO 2 that can be injected. In unconfined storage units, the CO 2 is injected in regional aquifers located in rocks without specific structural closures or stratigraphic traps. Once injected, the CO 2 will migrate to the highest portion of the saline formation where it accumulates against the cap rock, which prevents further vertical movement (Bentham and Kirby, 2005). At that point the injected CO 2 then will migrate laterally, following the normal hydrodynamic flow regime of the region (usually towards shallower areas). However, it must be emphasized that flow velocities in deep geologic systems occur at rates measured in feet per hundreds or thousands of years. Commercial sequestration in saline formations has been successful in the Sleipner field of Norway, and the U.S. Department of Energy is involved in a small-scale demonstration project in the Frio Formation of Texas (Hovorka and others, 2001). Further testing and pilot studies will occur in the United States during <strong>Phase</strong> II of the Regional Carbon Sequestration Partnerships (U.S. DOE, 2004, 2005). Oil and Gas Fields Oil and gas fields represent known geologic traps (structural or stratigraphic) containing hydrocarbons within a confined reservoir with a known cap or seal. In depleted or abandoned petroleum fields, CO 2 would be injected into the reservoir to fill the pore volume left by the extraction of the oil or natural gas resource (Westrich and others, 2002). The injected CO 2 would be trapped by the natural limits of the reservoir (whether structural or stratigraphic) for secure storage. Volume, permeability, injectivity, pressure, reservoir integrity, water chemistry, the nature of the cap rock or reservoir seal, and the history of production are some of the variables that control the sequestration potential in depleted oil and gas fields (Reichle and others, 1999). This option may be attractive in many parts of the <strong>MRCSP</strong> region because vast areas of the region have a long history of oil and gas recovery (exploration for oil began in the 1800s). In addition, the <strong>MRCSP</strong> region includes four of the top seven, natural-gas storage states in the nation (Natural Gas Monthly,
- Page 1 and 2: Characterization of Geologic Seques
- Page 3 and 4: ABOUT THE MRCSP The Midwest Regiona
- Page 5 and 6: CONTENTS About the MRCSP ..........
- Page 7 and 8: CONTENTS Figure A14-2.—Structure
- Page 9: 1 CHARACTERIZATION OF GEOLOGIC SEQU
- Page 13 and 14: INTRODUCTION TO THE MRCSP REGION’
- Page 15 and 16: INTRODUCTION TO THE MRCSP REGION’
- Page 17 and 18: INTRODUCTION TO THE MRCSP REGION’
- Page 19 and 20: INTRODUCTION TO THE MRCSP REGION’
- Page 21 and 22: GEOLOGIC MAPPING PROCEDURES, DATA S
- Page 23 and 24: GEOLOGIC MAPPING PROCEDURES, DATA S
- Page 25 and 26: GEOLOGIC MAPPING PROCEDURES, DATA S
- Page 27 and 28: GEOLOGIC MAPPING PROCEDURES, DATA S
- Page 29 and 30: GEOLOGIC MAPPING PROCEDURES, DATA S
- Page 31 and 32: GEOLOGIC MAPPING PROCEDURES, DATA S
- Page 33 and 34: GEOLOGIC MAPPING PROCEDURES, DATA S
- Page 35 and 36: OIL, GAS, AND GAS STORAGE FIELDS 27
- Page 37 and 38: OIL, GAS, AND GAS STORAGE FIELDS 29
- Page 39 and 40: OIL, GAS, AND GAS STORAGE FIELDS 31
- Page 41 and 42: CO 2-SEQUESTRATION STORAGE CAPACITY
- Page 43 and 44: CO 2-SEQUESTRATION STORAGE CAPACITY
- Page 45 and 46: CO 2-SEQUESTRATION STORAGE CAPACITY
- Page 47 and 48: CO 2-SEQUESTRATION STORAGE CAPACITY
- Page 49 and 50: CO 2-SEQUESTRATION STORAGE CAPACITY
- Page 51 and 52: CO 2-SEQUESTRATION STORAGE CAPACITY
- Page 53 and 54: CONCLUSIONS AND REGIONAL ASSESSMENT
- Page 55 and 56: REFERENCES CITED 47 National Confer
- Page 57 and 58: 49 APPENDIX A Geologic Summaries of
- Page 59 and 60: APPENDIX A: PRECAMBRIAN UNCONFORMIT
- Page 61 and 62:
APPENDIX A: CAMBRIAN BASAL SANDSTON
- Page 63 and 64:
APPENDIX A: CAMBRIAN BASAL SANDSTON
- Page 65 and 66:
APPENDIX A: CAMBRIAN BASAL SANDSTON
- Page 67 and 68:
APPENDIX A: BASAL SANDSTONES TO TOP
- Page 69 and 70:
APPENDIX A: BASAL SANDSTONES TO TOP
- Page 71 and 72:
APPENDIX A: BASAL SANDSTONES TO TOP
- Page 73 and 74:
APPENDIX A: UPPER CAMBRIAN ROSE RUN
- Page 75 and 76:
APPENDIX A: UPPER CAMBRIAN ROSE RUN
- Page 77 and 78:
APPENDIX A: UPPER CAMBRIAN ROSE RUN
- Page 79 and 80:
APPENDIX A: UPPER CAMBRIAN ROSE RUN
- Page 81 and 82:
APPENDIX A: KNOX TO LOWER SILURIAN
- Page 83 and 84:
APPENDIX A: KNOX TO LOWER SILURIAN
- Page 85 and 86:
APPENDIX A: KNOX TO LOWER SILURIAN
- Page 87 and 88:
N T R APPENDIX A: KNOX TO LOWER SIL
- Page 89 and 90:
APPENDIX A: MIDDLE ORDOVICIAN ST. P
- Page 91 and 92:
-6000 -8000 APPENDIX A: MIDDLE ORDO
- Page 93 and 94:
APPENDIX A: LOWER SILURIAN MEDINA G
- Page 95 and 96:
APPENDIX A: LOWER SILURIAN MEDINA G
- Page 97 and 98:
APPENDIX A: LOWER SILURIAN MEDINA G
- Page 99 and 100:
APPENDIX A: LOWER SILURIAN MEDINA G
- Page 101 and 102:
APPENDIX A: NIAGARAN/LOCKPORT THROU
- Page 103 and 104:
APPENDIX A: NIAGARAN/LOCKPORT THROU
- Page 105 and 106:
A APPENDIX A: NIAGARAN/LOCKPORT THR
- Page 107 and 108:
APPENDIX A: MIDDLE SILURIAN NIAGARA
- Page 109 and 110:
-3000 APPENDIX A: MIDDLE SILURIAN N
- Page 111 and 112:
APPENDIX A: LOWER DEVONIAN MANDATA
- Page 113 and 114:
APPENDIX A: LOWER DEVONIAN ORISKANY
- Page 115 and 116:
APPENDIX A: LOWER DEVONIAN ORISKANY
- Page 117 and 118:
APPENDIX A: LOWER DEVONIAN ORISKANY
- Page 119 and 120:
APPENDIX A: LOWER DEVONIAN ORISKANY
- Page 121 and 122:
APPENDIX A: LOWER DEVONIAN SYLVANIA
- Page 123 and 124:
-2000 APPENDIX A: LOWER DEVONIAN SY
- Page 125 and 126:
25 APPENDIX A: LOWER/MIDDLE DEVONIA
- Page 127 and 128:
APPENDIX A: DEVONIAN ORGANIC-RICH S
- Page 129 and 130:
APPENDIX A: DEVONIAN ORGANIC-RICH S
- Page 131 and 132:
APPENDIX A: DEVONIAN ORGANIC-RICH S
- Page 133 and 134:
APPENDIX A: DEVONIAN ORGANIC-RICH S
- Page 135 and 136:
( ( ( ( APPENDIX A: PENNSYLVANIAN C
- Page 137 and 138:
APPENDIX A: PENNSYLVANIAN COAL BEDS
- Page 139 and 140:
APPENDIX A: PENNSYLVANIAN COAL BEDS
- Page 141 and 142:
APPENDIX A: PENNSYLVANIAN COAL BEDS
- Page 143 and 144:
APPENDIX A: LOWER CRETACEOUS WASTE
- Page 145 and 146:
APPENDIX A: LOWER CRETACEOUS WASTE
- Page 147 and 148:
APPENDIX A: LOWER CRETACEOUS WASTE
- Page 149 and 150:
APPENDIX A: LOWER CRETACEOUS WASTE
- Page 151 and 152:
APPENDIX A: REFERENCES CITED 143 Sa
- Page 153 and 154:
APPENDIX A: REFERENCES CITED 145 an
- Page 155 and 156:
APPENDIX A: REFERENCES CITED 147 lo
- Page 157 and 158:
APPENDIX A: REFERENCES CITED 149 Pa
- Page 159 and 160:
APPENDIX A: REFERENCES CITED 151 Th