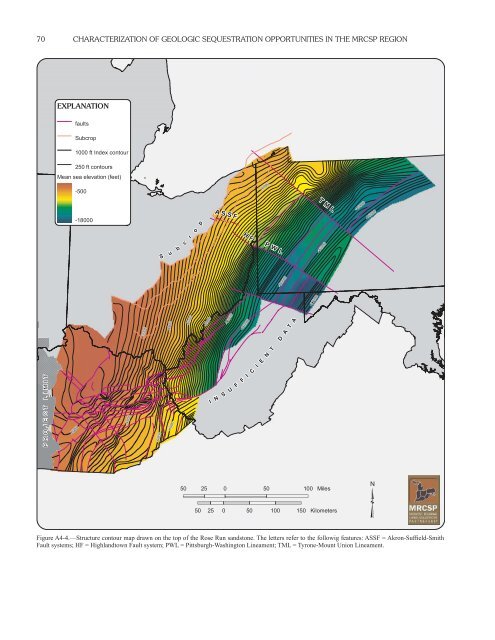
70 CHARACTERIZATION OF GEOLOGIC SEQUESTRATION OPPORTUNITIES IN THE <strong>MRCSP</strong> REGION EXPLANATION faults Subcrop 1000 ft Index contour 250 ft contours Mean sea elevation (feet) -500 -6000 -18000 S u b c r o p A S S F H F P W L T M L -13000 -15000 -16000 -16000 -17000 -2000 -4000 -6000 -8000 -11000 -13000 D A T A PROJECT LIMIT -2000 -4000 -6000 -7000 I N S U F F I C I E N T 50 25 0 50 100 Miles ³ 50 25 0 50 100 150 Kilometers Figure A4-4.—Structure contour map drawn on the top of the Rose Run sandstone. The letters refer to the followig features: ASSF = Akron-Suffield-Smith Fault systems; HF = Highlandtown Fault system; PWL = Pittsburgh-Washington Lineament; TML = Tyrone-Mount Union Lineament.
APPENDIX A: UPPER CAMBRIAN ROSE RUN SANDSTONE 71 range from approximately 50 feet per mile in northeastern Ohio and northwestern Pennsylvania to approximately 100 feet per mile in southeastern Ohio, and western West Virginia. The major tectonic features affecting Rose Run structure occur in northeastern Ohio, western Pennsylvania, eastern Kentucky, and western West Virginia. In western Pennsylvania, these include the Tyrone-Mt. Union and Pittsburgh-Washington lineaments, which have been interpreted as northwest-southeast trending wrench faults (Riley and others, 1993). In addition, numerous growth faults above basement rifts have been proposed that have been offset by movement along these major wrench faults (Laughrey and Harper, 1986; Harper, 1989; Riley and others, 1993). In northeastern Ohio, the major tectonic features indicated by regional mapping are the northwest-southeast trending Akron-Suffield-Smith and the Highlandtown fault systems, which also have been suggested to be wrench faults (Riley and others, 1993). These are extensions of the Pittsburgh-Washington lineament in Pennsylvania. In eastern Kentucky and western West Virginia, the Rose Run structure is broken by the east- to northeast-trending Rome trough. Locally, small-scale features are present that are not evident on the regional-scale maps. A relationship between basement faults and paleotopographic highs on the Knox or Rose Run has been proposed as a controlling factor in reservoir development and hydrocarbon production (Coogan and Lesser, 1991; Riley and others, 1993). The Rose Run sandstone interval thickens gradually from zero feet at the western limit of the subcrop to about 200 feet throughout the area of eastern Ohio and northwestern Pennsylvania (Figure A4- 3). The irregular nature of the Rose Run isopach map in Ohio near the subcrop is a result of erosion on the Knox unconformity. Various paleotopographic features, including numerous erosional remnants, are present along the subcrop trend as a result of paleodrainage. East of this broad zone of gradual thickening, the contours become narrower in western Pennsylvania as a result of the rapid thickening that is present in the Rome trough. Various authors have indicated that the Rome trough was actively subsiding during Rose Run deposition (Wagner, 1976; Harper, 1991). Approximately 470 feet of Rose Run was encountered in the Amoco #1 Svetz well in Somerset County, Pennsylvania before drilling was stopped at 21,640 feet; most of that thickness occurred in the uppermost sandstone body. The depositional pattern of the Rose Run in south-central Ohio and north-central Kentucky suggests control by the Waverly arch, a north-south trending feature that was first identified by Woodward (1961). Isopach maps of the Knox by Janssens (1973), and the Prairie du Chien by Shearrow (1987), indicate thinning over the feature. This thinning is also coincident with a facies change in the Rose Run in which it is sandstone-dominant on the east side and carbonate-dominant on the west side of the Waverly arch (Riley and others, 1993). A rather abrupt thinning occurs on the isopach map across the state line boundary of Ohio and Kentucky. This is, in part, an artifact of how the base of the Rose Run is interpreted differently in Ohio and Kentucky as discussed previously. In eastern Kentucky, changes in the contours along the Rome trough indicate that this fault influenced Rose Run deposition. DEPOSITIONAL ENVIRONMENTS/ PALEOGEOGRAPHY/TECTONISM Following the Rome trough aulacogen and deposition of the basal sandstones described in an earlier section, Late Cambrian recycled sands, including those of the Rose Run, continued to be deposited across the present-day Appalachian basin area. These sands were mixed with shelf carbonates that eventually dominated this passive margin (Riley and others, 1993). Provenance studies of the Rose Run sandstone suggest that they are compositionally mature and were derived from the crystalline Precambrian shield complexes and overlying platform rocks (Miall, 1984; Riley and others, 1993). The widespread Knox unconformity developed during the initial collision of the passive margin and the lowering of eustatic sea level in the Middle Ordovician (Mussman and others, 1988; Read, 1989). The progressive westward truncation of Knox units along this regional unconformity created and exposed the Rose Run subcrop trend (Figures A4-1, A4-3 and A4-4). Deposition of the Rose Run and adjacent Knox units has been attributed by various authors to represent a peritidal to shallow subtidal marine environment (Mussman and Read, 1986; Anderson, 1991; Gooding, 1992; Ryder, 1992a; Ryder and others, 1992; Riley and others, 1993). The Rose Run is part of a heterogeneous assemblage of interbedded siliciliclastic and carbonate facies in the Knox that were deposited on a carbonate shelf, which Ginsburg (1982) referred to as the “Great American Bank.” The Rose Run represents lowstand deposits of siliciclastic sediments that were transported onto the peritidal platform and reworked during subsequent sealevel rises (Read, 1989). Many authors have interpreted tidal flat deposition for the Rose Run and equivalent strata (Mussman and Read, 1986; Anderson, 1991; Enterline, 1991; Riley and others, 1993) based upon core and outcrop description. Sedimentary features supporting this include herringbone cross bedding and basal lags of dolostone and shaly dolostone indicating scour along tidal channel thalwegs. In outcrop in central Pennsylvania, a shallowing-upward tidal flat sequence is recognized and include the following subfacies: 1) storm sheet deposition with flat pebble conglomerates; 2) algal patch reefs with thrombolitic bioherms; 3) subtidal ooid-peloid sand shoals with cross stratified ooid grainstones; 4) lower intertidal mixed sandmud flats with ribbon rock; 5) upper intertidal algal flats with prismcracked wavy laminites; and 6) supratidal flats with mudcracked flat laminites (Riley and others, 1993). Subsurface cores in Ohio also indicate a supratidal facies from the presence of digitate algal stromatolites, mudcracks, and nodular anhydrite and chert replacing evaporites. Extensive mottling from bioturbation indicative of intertidal and subtidal environments is pervasive throughout the Rose Run and adjacent Knox units. SUITABILITY AS A CO 2 INJECTION TARGET OR SEAL UNIT Suitability of CO 2 injection for the Rose Run can be subdivided into three geographic areas for discussion: 1) within the Rose Run subcrop trend; 2) downdip of the eastern edge of the subcrop; and 3) within the Rome Trough. In most of these areas, the Rose Run occurs at depths greater than 2,500 feet, which should be within the preferred condition to obtain adequate minimum miscibility pressures for CO 2 sequestration. Availability of subsurface well data is greatest within the subcrop trend, where most of the petroleum exploration and production from this formation has occurred. Thus, knowledge of reservoir characteristics is best within the subcrop trend, where thousands of oil and gas wells have targeted the Rose Run, and decreases basinward away from the subcrop. Within and adjacent to the Rose Run subcrop, reservoir quality is controlled by erosional truncation and paleotopography on the Knox unconformity. Erosional remnants are found along the subcrop trend, typically 80 acres or less in area. Large-scale injection of CO 2 in Rose Run remnants would be difficult because of their limited size. However, reservoir quality within these remnants is
- Page 1 and 2:
Characterization of Geologic Seques
- Page 3 and 4:
ABOUT THE MRCSP The Midwest Regiona
- Page 5 and 6:
CONTENTS About the MRCSP ..........
- Page 7 and 8:
CONTENTS Figure A14-2.—Structure
- Page 9 and 10:
1 CHARACTERIZATION OF GEOLOGIC SEQU
- Page 11 and 12:
BACKGROUND INFORMATION 3 (a minimum
- Page 13 and 14:
INTRODUCTION TO THE MRCSP REGION’
- Page 15 and 16:
INTRODUCTION TO THE MRCSP REGION’
- Page 17 and 18:
INTRODUCTION TO THE MRCSP REGION’
- Page 19 and 20:
INTRODUCTION TO THE MRCSP REGION’
- Page 21 and 22:
GEOLOGIC MAPPING PROCEDURES, DATA S
- Page 23 and 24:
GEOLOGIC MAPPING PROCEDURES, DATA S
- Page 25 and 26:
GEOLOGIC MAPPING PROCEDURES, DATA S
- Page 27 and 28: GEOLOGIC MAPPING PROCEDURES, DATA S
- Page 29 and 30: GEOLOGIC MAPPING PROCEDURES, DATA S
- Page 31 and 32: GEOLOGIC MAPPING PROCEDURES, DATA S
- Page 33 and 34: GEOLOGIC MAPPING PROCEDURES, DATA S
- Page 35 and 36: OIL, GAS, AND GAS STORAGE FIELDS 27
- Page 37 and 38: OIL, GAS, AND GAS STORAGE FIELDS 29
- Page 39 and 40: OIL, GAS, AND GAS STORAGE FIELDS 31
- Page 41 and 42: CO 2-SEQUESTRATION STORAGE CAPACITY
- Page 43 and 44: CO 2-SEQUESTRATION STORAGE CAPACITY
- Page 45 and 46: CO 2-SEQUESTRATION STORAGE CAPACITY
- Page 47 and 48: CO 2-SEQUESTRATION STORAGE CAPACITY
- Page 49 and 50: CO 2-SEQUESTRATION STORAGE CAPACITY
- Page 51 and 52: CO 2-SEQUESTRATION STORAGE CAPACITY
- Page 53 and 54: CONCLUSIONS AND REGIONAL ASSESSMENT
- Page 55 and 56: REFERENCES CITED 47 National Confer
- Page 57 and 58: 49 APPENDIX A Geologic Summaries of
- Page 59 and 60: APPENDIX A: PRECAMBRIAN UNCONFORMIT
- Page 61 and 62: APPENDIX A: CAMBRIAN BASAL SANDSTON
- Page 63 and 64: APPENDIX A: CAMBRIAN BASAL SANDSTON
- Page 65 and 66: APPENDIX A: CAMBRIAN BASAL SANDSTON
- Page 67 and 68: APPENDIX A: BASAL SANDSTONES TO TOP
- Page 69 and 70: APPENDIX A: BASAL SANDSTONES TO TOP
- Page 71 and 72: APPENDIX A: BASAL SANDSTONES TO TOP
- Page 73 and 74: APPENDIX A: UPPER CAMBRIAN ROSE RUN
- Page 75 and 76: APPENDIX A: UPPER CAMBRIAN ROSE RUN
- Page 77: APPENDIX A: UPPER CAMBRIAN ROSE RUN
- Page 81 and 82: APPENDIX A: KNOX TO LOWER SILURIAN
- Page 83 and 84: APPENDIX A: KNOX TO LOWER SILURIAN
- Page 85 and 86: APPENDIX A: KNOX TO LOWER SILURIAN
- Page 87 and 88: N T R APPENDIX A: KNOX TO LOWER SIL
- Page 89 and 90: APPENDIX A: MIDDLE ORDOVICIAN ST. P
- Page 91 and 92: -6000 -8000 APPENDIX A: MIDDLE ORDO
- Page 93 and 94: APPENDIX A: LOWER SILURIAN MEDINA G
- Page 95 and 96: APPENDIX A: LOWER SILURIAN MEDINA G
- Page 97 and 98: APPENDIX A: LOWER SILURIAN MEDINA G
- Page 99 and 100: APPENDIX A: LOWER SILURIAN MEDINA G
- Page 101 and 102: APPENDIX A: NIAGARAN/LOCKPORT THROU
- Page 103 and 104: APPENDIX A: NIAGARAN/LOCKPORT THROU
- Page 105 and 106: A APPENDIX A: NIAGARAN/LOCKPORT THR
- Page 107 and 108: APPENDIX A: MIDDLE SILURIAN NIAGARA
- Page 109 and 110: -3000 APPENDIX A: MIDDLE SILURIAN N
- Page 111 and 112: APPENDIX A: LOWER DEVONIAN MANDATA
- Page 113 and 114: APPENDIX A: LOWER DEVONIAN ORISKANY
- Page 115 and 116: APPENDIX A: LOWER DEVONIAN ORISKANY
- Page 117 and 118: APPENDIX A: LOWER DEVONIAN ORISKANY
- Page 119 and 120: APPENDIX A: LOWER DEVONIAN ORISKANY
- Page 121 and 122: APPENDIX A: LOWER DEVONIAN SYLVANIA
- Page 123 and 124: -2000 APPENDIX A: LOWER DEVONIAN SY
- Page 125 and 126: 25 APPENDIX A: LOWER/MIDDLE DEVONIA
- Page 127 and 128: APPENDIX A: DEVONIAN ORGANIC-RICH S
- Page 129 and 130:
APPENDIX A: DEVONIAN ORGANIC-RICH S
- Page 131 and 132:
APPENDIX A: DEVONIAN ORGANIC-RICH S
- Page 133 and 134:
APPENDIX A: DEVONIAN ORGANIC-RICH S
- Page 135 and 136:
( ( ( ( APPENDIX A: PENNSYLVANIAN C
- Page 137 and 138:
APPENDIX A: PENNSYLVANIAN COAL BEDS
- Page 139 and 140:
APPENDIX A: PENNSYLVANIAN COAL BEDS
- Page 141 and 142:
APPENDIX A: PENNSYLVANIAN COAL BEDS
- Page 143 and 144:
APPENDIX A: LOWER CRETACEOUS WASTE
- Page 145 and 146:
APPENDIX A: LOWER CRETACEOUS WASTE
- Page 147 and 148:
APPENDIX A: LOWER CRETACEOUS WASTE
- Page 149 and 150:
APPENDIX A: LOWER CRETACEOUS WASTE
- Page 151 and 152:
APPENDIX A: REFERENCES CITED 143 Sa
- Page 153 and 154:
APPENDIX A: REFERENCES CITED 145 an
- Page 155 and 156:
APPENDIX A: REFERENCES CITED 147 lo
- Page 157 and 158:
APPENDIX A: REFERENCES CITED 149 Pa
- Page 159 and 160:
APPENDIX A: REFERENCES CITED 151 Th