MRCSP Phase I Geologic Characterization Report - Midwest ...
MRCSP Phase I Geologic Characterization Report - Midwest ...
MRCSP Phase I Geologic Characterization Report - Midwest ...

You also want an ePaper? Increase the reach of your titles
YUMPU automatically turns print PDFs into web optimized ePapers that Google loves.
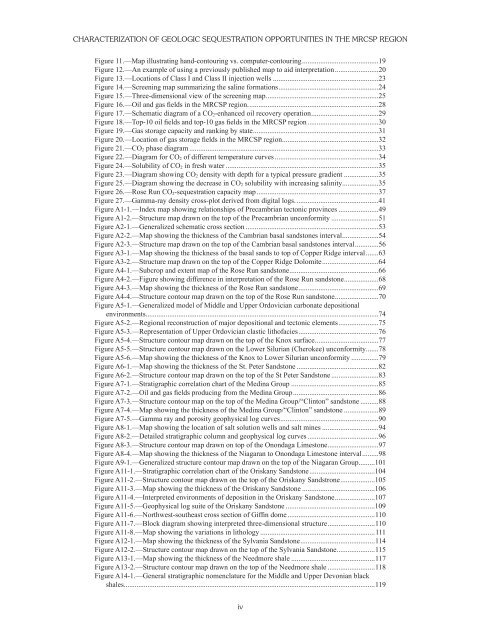
CHARACTERIZATION OF GEOLOGIC SEQUESTRATION OPPORTUNITIES IN THE <strong>MRCSP</strong> REGION<br />
Figure 11.—Map illustrating hand-contouring vs. computer-contouring..........................................19<br />
Figure 12.—An example of using a previously published map to aid interpretation........................20<br />
Figure 13.—Locations of Class I and Class II injection wells ..........................................................23<br />
Figure 14.—Screening map summarizing the saline formations.......................................................24<br />
Figure 15.—Three-dimensional view of the screening map..............................................................25<br />
Figure 16.—Oil and gas fields in the <strong>MRCSP</strong> region........................................................................28<br />
Figure 17.—Schematic diagram of a CO 2-enhanced oil recovery operation.....................................29<br />
Figure 18.—Top-10 oil fields and top-10 gas fields in the <strong>MRCSP</strong> region .......................................30<br />
Figure 19.—Gas storage capacity and ranking by state.....................................................................31<br />
Figure 20.—Location of gas storage fields in the <strong>MRCSP</strong> region.....................................................32<br />
Figure 21.—CO 2 phase diagram ........................................................................................................33<br />
Figure 22.—Diagram for CO 2 of different temperature curves .........................................................34<br />
Figure 24.—Solubility of CO 2 in fresh water ....................................................................................35<br />
Figure 23.—Diagram showing CO 2 density with depth for a typical pressure gradient ...................35<br />
Figure 25.—Diagram showing the decrease in CO 2 solubility with increasing salinity....................35<br />
Figure 26.—Rose Run CO 2-sequestration capacity map...................................................................37<br />
Figure 27.—Gamma-ray density cross-plot derived from digital logs..............................................41<br />
Figure A1-1.—Index map showing relationships of Precambrian tectonic provinces ......................49<br />
Figure A1-2.—Structure map drawn on the top of the Precambrian unconformity ..........................51<br />
Figure A2-1.—Generalized schematic cross section .........................................................................53<br />
Figure A2-2.—Map showing the thickness of the Cambrian basal sandstones interval....................54<br />
Figure A2-3.—Structure map drawn on the top of the Cambrian basal sandstones interval.............56<br />
Figure A3-1.—Map showing the thickness of the basal sands to top of Copper Ridge interval.......63<br />
Figure A3-2.—Structure map drawn on the top of the Copper Ridge Dolomite...............................64<br />
Figure A4-1.—Subcrop and extent map of the Rose Run sandstone.................................................66<br />
Figure A4-2.—Figure showing difference in interpretation of the Rose Run sandstone...................68<br />
Figure A4-3.—Map showing the thickness of the Rose Run sandstone............................................69<br />
Figure A4-4.—Structure contour map drawn on the top of the Rose Run sandstone........................70<br />
Figure A5-1.—Generalized model of Middle and Upper Ordovician carbonate depositional<br />
environments................................................................................................................................74<br />
Figure A5-2.—Regional reconstruction of major depositional and tectonic elements......................75<br />
Figure A5-3.—Representation of Upper Ordovician clastic lithofacies............................................76<br />
Figure A5-4.—Structure contour map drawn on the top of the Knox surface...................................77<br />
Figure A5-5.—Structure contour map drawn on the Lower Silurian (Cherokee) unconformity.......78<br />
Figure A5-6.—Map showing the thickness of the Knox to Lower Silurian unconformity ...............79<br />
Figure A6-1.—Map showing the thickness of the St. Peter Sandstone .............................................82<br />
Figure A6-2.—Structure contour map drawn on the top of the St Peter Sandstone ..........................83<br />
Figure A7-1.—Stratigraphic correlation chart of the Medina Group ................................................85<br />
Figure A7-2.—Oil and gas fields producing from the Medina Group...............................................86<br />
Figure A7-3.—Structure contour map on the top of the Medina Group/“Clinton” sandstone ..........88<br />
Figure A7-4.—Map showing the thickness of the Medina Group/“Clinton” sandstone ...................89<br />
Figure A7-5.—Gamma ray and porosity geophysical log curves......................................................90<br />
Figure A8-1.—Map showing the location of salt solution wells and salt mines ...............................94<br />
Figure A8-2.—Detailed stratigraphic column and geophysical log curves .......................................96<br />
Figure A8-3.—Structure contour map drawn on top of the Onondaga Limestone............................97<br />
Figure A8-4.—Map showing the thickness of the Niagaran to Onondaga Limestone interval.........98<br />
Figure A9-1.—Generalized structure contour map drawn on the top of the Niagaran Group.........101<br />
Figure A11-1.—Stratigraphic correlation chart of the Oriskany Sandstone....................................104<br />
Figure A11-2.—Structure contour map drawn on the top of the Oriskany Sandstrone...................105<br />
Figure A11-3.—Map showing the thickness of the Oriskany Sandstone ........................................106<br />
Figure A11-4.—Interpreted environments of deposition in the Oriskany Sandstone......................107<br />
Figure A11-5.—Geophysical log suite of the Oriskany Sandstone .................................................109<br />
Figure A11-6.—Northwest-southeast cross section of Giffin dome................................................110<br />
Figure A11-7.—Block diagram showing interpreted three-dimensional structure..........................110<br />
Figure A11-8.—Map showing the variations in lithology ...............................................................111<br />
Figure A12-1.—Map showing the thickness of the Sylvania Sandstone.........................................114<br />
Figure A12-2.—Structure contour map drawn on the top of the Sylvania Sandstone.....................115<br />
Figure A13-1.—Map showing the thickness of the Needmore shale ..............................................117<br />
Figure A13-2.—Structure contour map drawn on the top of the Needmore shale ..........................118<br />
Figure A14-1.—General stratigraphic nomenclature for the Middle and Upper Devonian black<br />
shales..........................................................................................................................................119<br />
iv