POWER UP A WINNER - Plant Services
POWER UP A WINNER - Plant Services
POWER UP A WINNER - Plant Services

Create successful ePaper yourself
Turn your PDF publications into a flip-book with our unique Google optimized e-Paper software.
0 13 25 48 50 63 75 88 100<br />
% Power (kW)<br />
Note:<br />
Efficiency / Compressors<br />
1. These operating characteristics will vary with motor type,<br />
basic design, motor efficiency, constant or variable speed, etc.<br />
2. Amperage will vary indirectly with changes in rated voltage.<br />
It is best to measure kW directly.<br />
3. 87% amp = 80% power<br />
Input power estimates flow<br />
% kW power<br />
110<br />
100<br />
90<br />
80<br />
70<br />
60<br />
50<br />
40<br />
30<br />
20<br />
10<br />
0<br />
Actual modulation<br />
performace curve<br />
No load<br />
69% power<br />
85% power<br />
35% flow<br />
% Flow<br />
100% load<br />
100% power<br />
Estimated flow = 215 X .35 = 75 acfm<br />
Note: The actual no load modulation point<br />
will vary with each compressor. To establish<br />
actual curve, measure kW at full load at rated<br />
pressure and kW at point where valve closed<br />
before blowdown. Draw appropriate curve.<br />
10 20 30 40 50 60 70 80 90 100<br />
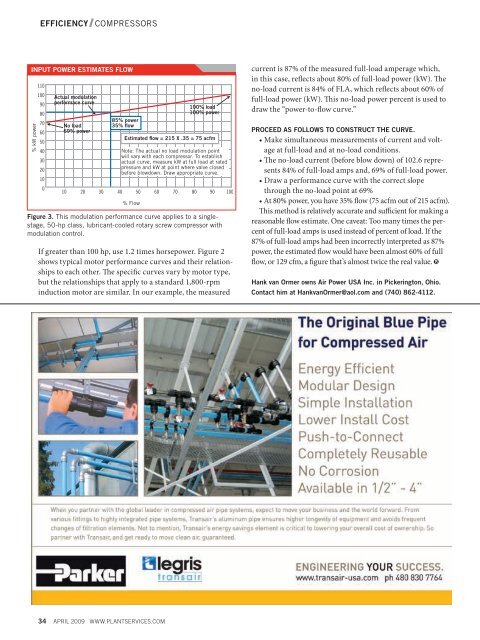
Figure 3. This modulation performance curve applies to a singlestage,<br />
50-hp class, lubricant-cooled rotary screw compressor with<br />
modulation control.<br />
If greater than 100 hp, use 1.2 times horsepower. Figure 2<br />
shows typical motor performance curves and their relationships<br />
to each other. The specific curves vary by motor type,<br />
but the relationships that apply to a standard 1,800-rpm<br />
induction motor are similar. In our example, the measured<br />
current is 87% of the measured full-load amperage which,<br />
in this case, reflects about 80% of full-load power (kW). The<br />
no-load current is 84% of FLA, which reflects about 60% of<br />
full-load power (kW). This no-load power percent is used to<br />
draw the “power-to-flow curve.”<br />
Proceed as follows to construct the curve.<br />
• Make simultaneous measurements of current and voltage<br />
at full-load and at no-load conditions.<br />
• The no-load current (before blow down) of 102.6 represents<br />
84% of full-load amps and, 69% of full-load power.<br />
• Draw a performance curve with the correct slope<br />
through the no-load point at 69%<br />
• At 80% power, you have 35% flow (75 acfm out of 215 acfm).<br />
This method is relatively accurate and sufficient for making a<br />
reasonable flow estimate. One caveat: Too many times the percent<br />
of full-load amps is used instead of percent of load. If the<br />
87% of full-load amps had been incorrectly interpreted as 87%<br />
power, the estimated flow would have been almost 60% of full<br />
flow, or 129 cfm, a figure that’s almost twice the real value.<br />
Hank van Ormer owns Air Power USA Inc. in Pickerington, Ohio.<br />
Contact him at HankvanOrmer@aol.com and (740) 862-4112.<br />
34 APRIL 2009 www.PLANTSERVICES.com