The Evaluation of 'Behavioural Additionality' - IWT
The Evaluation of 'Behavioural Additionality' - IWT
The Evaluation of 'Behavioural Additionality' - IWT

You also want an ePaper? Increase the reach of your titles
YUMPU automatically turns print PDFs into web optimized ePapers that Google loves.
CHAPTER 2 > Measuring Additionality <strong>of</strong> R&D Subsidies with Surveys:<br />
Towards an <strong>Evaluation</strong> Methodology for <strong>IWT</strong>-Flanders<br />
<strong>IWT</strong>-STUDIES > >> 48<br />
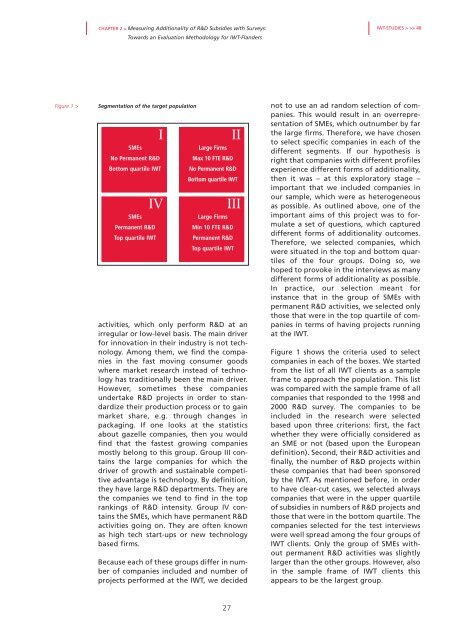
Figure 1 ><br />
Segmentation <strong>of</strong> the target population<br />
I<br />
SMEs<br />
No Permanent R&D<br />
Bottom quartile <strong>IWT</strong><br />
IV<br />
SMEs<br />
Permanent R&D<br />
Top quartile <strong>IWT</strong><br />
II<br />
Large Firms<br />
Max 10 FTE R&D<br />
No Permanent R&D<br />
Bottom quartile <strong>IWT</strong><br />
III<br />
Large Firms<br />
Min 10 FTE R&D<br />
Permanent R&D<br />
Top quartile <strong>IWT</strong><br />
activities, which only perform R&D at an<br />
irregular or low-level basis. <strong>The</strong> main driver<br />
for innovation in their industry is not technology.<br />
Among them, we find the companies<br />
in the fast moving consumer goods<br />
where market research instead <strong>of</strong> technology<br />
has traditionally been the main driver.<br />
However, sometimes these companies<br />
undertake R&D projects in order to standardize<br />
their production process or to gain<br />
market share, e.g. through changes in<br />
packaging. If one looks at the statistics<br />
about gazelle companies, then you would<br />
find that the fastest growing companies<br />
mostly belong to this group. Group III contains<br />
the large companies for which the<br />
driver <strong>of</strong> growth and sustainable competitive<br />
advantage is technology. By definition,<br />
they have large R&D departments. <strong>The</strong>y are<br />
the companies we tend to find in the top<br />
rankings <strong>of</strong> R&D intensity. Group IV contains<br />
the SMEs, which have permanent R&D<br />
activities going on. <strong>The</strong>y are <strong>of</strong>ten known<br />
as high tech start-ups or new technology<br />
based firms.<br />
Because each <strong>of</strong> these groups differ in number<br />
<strong>of</strong> companies included and number <strong>of</strong><br />
projects performed at the <strong>IWT</strong>, we decided<br />
not to use an ad random selection <strong>of</strong> companies.<br />
This would result in an overrepresentation<br />
<strong>of</strong> SMEs, which outnumber by far<br />
the large firms. <strong>The</strong>refore, we have chosen<br />
to select specific companies in each <strong>of</strong> the<br />
different segments. If our hypothesis is<br />
right that companies with different pr<strong>of</strong>iles<br />
experience different forms <strong>of</strong> additionality,<br />
then it was – at this exploratory stage –<br />
important that we included companies in<br />
our sample, which were as heterogeneous<br />
as possible. As outlined above, one <strong>of</strong> the<br />
important aims <strong>of</strong> this project was to formulate<br />
a set <strong>of</strong> questions, which captured<br />
different forms <strong>of</strong> additionality outcomes.<br />
<strong>The</strong>refore, we selected companies, which<br />
were situated in the top and bottom quartiles<br />
<strong>of</strong> the four groups. Doing so, we<br />
hoped to provoke in the interviews as many<br />
different forms <strong>of</strong> additionality as possible.<br />
In practice, our selection meant for<br />
instance that in the group <strong>of</strong> SMEs with<br />
permanent R&D activities, we selected only<br />
those that were in the top quartile <strong>of</strong> companies<br />
in terms <strong>of</strong> having projects running<br />
at the <strong>IWT</strong>.<br />
Figure 1 shows the criteria used to select<br />
companies in each <strong>of</strong> the boxes. We started<br />
from the list <strong>of</strong> all <strong>IWT</strong> clients as a sample<br />
frame to approach the population. This list<br />
was compared with the sample frame <strong>of</strong> all<br />
companies that responded to the 1998 and<br />
2000 R&D survey. <strong>The</strong> companies to be<br />
included in the research were selected<br />
based upon three criterions: first, the fact<br />
whether they were <strong>of</strong>ficially considered as<br />
an SME or not (based upon the European<br />
definition). Second, their R&D activities and<br />
finally, the number <strong>of</strong> R&D projects within<br />
these companies that had been sponsored<br />
by the <strong>IWT</strong>. As mentioned before, in order<br />
to have clear-cut cases, we selected always<br />
companies that were in the upper quartile<br />
<strong>of</strong> subsidies in numbers <strong>of</strong> R&D projects and<br />
those that were in the bottom quartile. <strong>The</strong><br />
companies selected for the test interviews<br />
were well spread among the four groups <strong>of</strong><br />
<strong>IWT</strong> clients. Only the group <strong>of</strong> SMEs without<br />
permanent R&D activities was slightly<br />
larger than the other groups. However, also<br />
in the sample frame <strong>of</strong> <strong>IWT</strong> clients this<br />
appears to be the largest group.<br />
27