The Quality Measurement Journey - Sikker Patient
The Quality Measurement Journey - Sikker Patient
The Quality Measurement Journey - Sikker Patient
You also want an ePaper? Increase the reach of your titles
YUMPU automatically turns print PDFs into web optimized ePapers that Google loves.
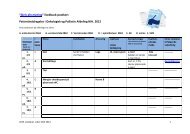
Elements of a Shewhart<br />
Control Chart<br />
50.0<br />
45.0<br />
40.0<br />
(Upper Control Limit)<br />
UCL=44.855<br />
A<br />
Measure<br />
Number of Complaints<br />
35.0<br />
30.0<br />
25.0<br />
20.0<br />
15.0<br />
10.0<br />
An indication of<br />
a special cause<br />
B<br />
C<br />
CL=29.250<br />
C<br />
B<br />
A<br />
X (Mean)<br />
LCL=13.645<br />
(Lower Control Limit)<br />
5.0<br />
Jan01 Mar01 May01 July01 Sept01 Nov01 Jan02 Mar02 May02 July02 Sept02 Nov02<br />
Time<br />
Month<br />
©Copyright 2011 IHI/R. Lloyd<br />
Run and Control Charts<br />
don’t tell you<br />
• <strong>The</strong> reasons(s) for a Special Cause<br />
• Whether or not a Common Cause process<br />
should be improved (Is the performance of<br />
the process acceptable)<br />
• How the process should actually be<br />
improved or redesigned<br />
©Copyright 2011 IHI/R. Lloyd<br />
Institute for Healthcare Improvement


