Financial Statements of - Shoppers Drug Mart
Financial Statements of - Shoppers Drug Mart
Financial Statements of - Shoppers Drug Mart

You also want an ePaper? Increase the reach of your titles
YUMPU automatically turns print PDFs into web optimized ePapers that Google loves.
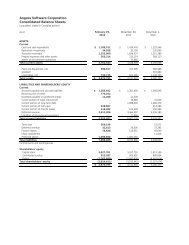
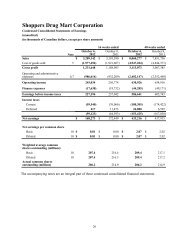
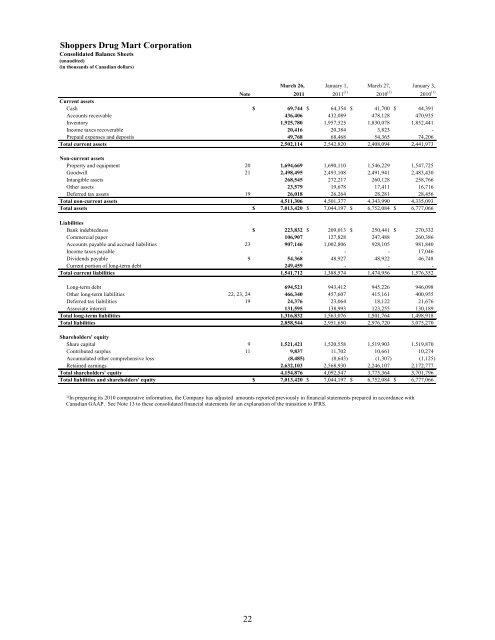
<strong>Shoppers</strong> <strong>Drug</strong> <strong>Mart</strong> Corporation<br />
Consolidated Balance Sheets<br />
(unaudited)<br />
(in thousands <strong>of</strong> Canadian dollars)<br />
March 26, January 1, March 27, January 3,<br />
Note<br />
2011 2011 (1) 2010 (1)<br />
2010 (1)<br />
Current assets<br />
Cash $ 69,744 $ 64,354 $ 41,700 $ 44,391<br />
Accounts receivable 436,406 432,089 478,128 470,935<br />
Inventory 1,925,780 1,957,525 1,830,078 1,852,441<br />
Income taxes recoverable 20,416 20,384 3,823 -<br />
Prepaid expenses and deposits 49,768 68,468 54,365 74,206<br />
Total current assets 2,502,114 2,542,820 2,408,094 2,441,973<br />
Non-current assets<br />
Property and equipment 20 1,694,669 1,690,110 1,546,229 1,547,725<br />
Goodwill 21 2,498,495 2,493,108 2,491,941 2,483,430<br />
Intangible assets 268,545 272,217 260,128 258,766<br />
Other assets 23,579 19,678 17,411 16,716<br />
Deferred tax assets 19 26,018 26,264 28,281 28,456<br />
Total non-current assets 4,511,306 4,501,377 4,343,990 4,335,093<br />
Total assets $ 7,013,420 $ 7,044,197 $ 6,752,084 $ 6,777,066<br />
Liabilities<br />
Bank indebtedness $ 223,832 $ 209,013 $ 250,441 $ 270,332<br />
Commercial paper 106,907 127,828 247,488 260,386<br />
Accounts payable and accrued liabilities 23 907,146 1,002,806 928,105 981,840<br />
Income taxes payable - - - 17,046<br />
Dividends payable 9 54,368 48,927 48,922 46,748<br />
Current portion <strong>of</strong> long-term debt 249,459 - - -<br />
Total current liabilities 1,541,712 1,388,574 1,474,956 1,576,352<br />
Long-term debt 694,521 943,412 945,226 946,098<br />
Other long-term liabilities 22, 23, 24 466,340 457,607 415,161 400,955<br />
Deferred tax liabilities 19 24,376 23,064 18,122 21,676<br />
Associate interest 131,595 138,993 123,255 130,189<br />
Total long-term liabilities 1,316,832 1,563,076 1,501,764 1,498,918<br />
Total liabilities 2,858,544 2,951,650 2,976,720 3,075,270<br />
Shareholders' equity<br />
Share capital 9 1,521,421 1,520,558 1,519,903 1,519,870<br />
Contributed surplus 11 9,837 11,702 10,661 10,274<br />
Accumulated other comprehensive loss (8,485) (8,643) (1,307) (1,125)<br />
Retained earnings 2,632,103 2,568,930 2,246,107 2,172,777<br />
Total shareholders' equity 4,154,876 4,092,547 3,775,364 3,701,796<br />
Total liabilities and shareholders' equity $ 7,013,420 $ 7,044,197 $ 6,752,084 $ 6,777,066<br />
1)<br />
In preparing its 2010 comparative information, the Company has adjusted amounts reported previously in financial statements prepared in accordance with<br />
Canadian GAAP. See Note 13 to these consolidated financial statements for an explanation <strong>of</strong> the transition to IFRS.<br />
22