Financial Statements of - Shoppers Drug Mart
Financial Statements of - Shoppers Drug Mart
Financial Statements of - Shoppers Drug Mart

Create successful ePaper yourself
Turn your PDF publications into a flip-book with our unique Google optimized e-Paper software.
SHOPPERS DRUG MART CORPORATION<br />
Notes to the Consolidated <strong>Financial</strong> <strong>Statements</strong><br />
(unaudited)<br />
(in thousands <strong>of</strong> Canadian dollars, except per share data)<br />
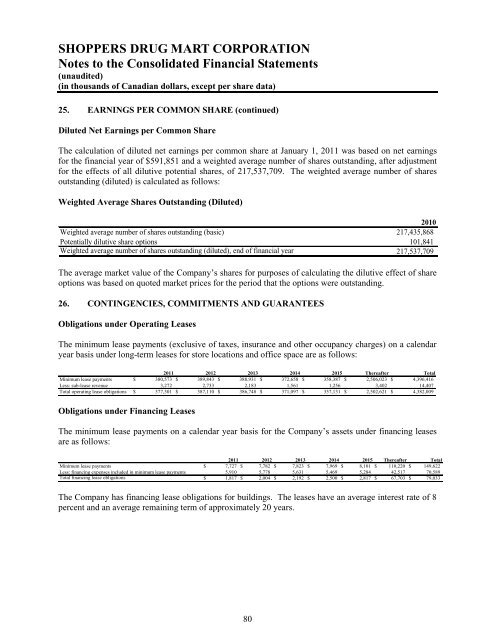
25. EARNINGS PER COMMON SHARE (continued)<br />
Diluted Net Earnings per Common Share<br />
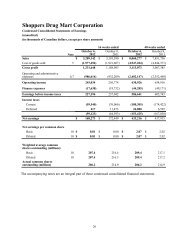
The calculation <strong>of</strong> diluted net earnings per common share at January 1, 2011 was based on net earnings<br />
for the financial year <strong>of</strong> $591,851 and a weighted average number <strong>of</strong> shares outstanding, after adjustment<br />
for the effects <strong>of</strong> all dilutive potential shares, <strong>of</strong> 217,537,709. The weighted average number <strong>of</strong> shares<br />
outstanding (diluted) is calculated as follows:<br />
Weighted Average Shares Outstanding (Diluted)<br />
2010<br />
Weighted average number <strong>of</strong> shares outstanding (basic) 217,435,868<br />
Potentially dilutive share options 101,841<br />
Weighted average number <strong>of</strong> shares outstanding (diluted), end <strong>of</strong> financial year 217,537,709<br />
The average market value <strong>of</strong> the Company’s shares for purposes <strong>of</strong> calculating the dilutive effect <strong>of</strong> share<br />
options was based on quoted market prices for the period that the options were outstanding.<br />
26. CONTINGENCIES, COMMITMENTS AND GUARANTEES<br />
Obligations under Operating Leases<br />
The minimum lease payments (exclusive <strong>of</strong> taxes, insurance and other occupancy charges) on a calendar<br />
year basis under long-term leases for store locations and <strong>of</strong>fice space are as follows:<br />
2011 2012 2013 2014<br />
2015 Thereafter Total<br />
Minimum lease payments $ 380,573 $ 389,843 $ 388,931 $ 372,658 $ 358,387 $ 2,506,023 $ 4,396,416<br />
Less: sub-lease revenue 3,272 2,733 2,183 1,561 1,256 3,402 14,407<br />
Total operating lease obligations $ 377,301 $ 387,110 $ 386,748 $ 371,097 $ 357,131 $ 2,502,621 $ 4,382,009<br />
Obligations under Financing Leases<br />
The minimum lease payments on a calendar year basis for the Company’s assets under financing leases<br />
are as follows:<br />
2011 2012 2013 2014 2015 Thereafter Total<br />
Minimum lease payments $ 7,727 $ 7,782 $ 7,823 $ 7,969 $ 8,101 $ 110,220 $ 149,622<br />
Less: financing expenses included in minimum lease payments 5,910 5,778 5,631 5,469 5,284 42,517 70,589<br />
Total financing lease obligations $ 1,817 $ 2,004 $ 2,192 $ 2,500 $ 2,817 $ 67,703 $ 79,033<br />
The Company has financing lease obligations for buildings. The leases have an average interest rate <strong>of</strong> 8<br />
percent and an average remaining term <strong>of</strong> approximately 20 years.<br />
80