2011 Annual Report - TOM Group
2011 Annual Report - TOM Group
2011 Annual Report - TOM Group

Create successful ePaper yourself
Turn your PDF publications into a flip-book with our unique Google optimized e-Paper software.
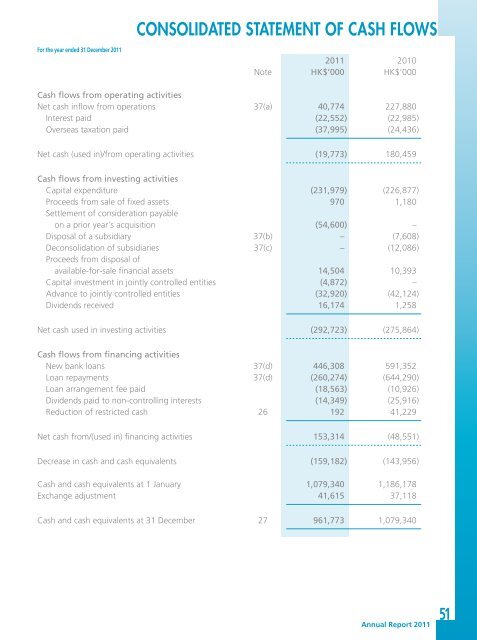
CONSOLIDATED STATEMENT OF CASH FLOWS<br />
For the year ended 31 December <strong>2011</strong><br />
<strong>2011</strong> 2010<br />
Note HK$’000 HK$’000<br />
Cash flows from operating activities<br />
Net cash inflow from operations 37(a) 40,774 227,880<br />
Interest paid (22,552) (22,985)<br />
Overseas taxation paid (37,995) (24,436)<br />
Net cash (used in)/from operating activities (19,773) 180,459<br />
Cash flows from investing activities<br />
Capital expenditure (231,979) (226,877)<br />
Proceeds from sale of fixed assets 970 1,180<br />
Settlement of consideration payable<br />
on a prior year’s acquisition (54,600) –<br />
Disposal of a subsidiary 37(b) – (7,608)<br />
Deconsolidation of subsidiaries 37(c) – (12,086)<br />
Proceeds from disposal of<br />
available-for-sale financial assets 14,504 10,393<br />
Capital investment in jointly controlled entities (4,872) –<br />
Advance to jointly controlled entities (32,920) (42,124)<br />
Dividends received 16,174 1,258<br />
Net cash used in investing activities (292,723) (275,864)<br />
Cash flows from financing activities<br />
New bank loans 37(d) 446,308 591,352<br />
Loan repayments 37(d) (260,274) (644,290)<br />
Loan arrangement fee paid (18,563) (10,926)<br />
Dividends paid to non-controlling interests (14,349) (25,916)<br />
Reduction of restricted cash 26 192 41,229<br />
Net cash from/(used in) financing activities 153,314 (48,551)<br />
Decrease in cash and cash equivalents (159,182) (143,956)<br />
Cash and cash equivalents at 1 January 1,079,340 1,186,178<br />
Exchange adjustment 41,615 37,118<br />
Cash and cash equivalents at 31 December 27 961,773 1,079,340<br />
<strong>Annual</strong> <strong>Report</strong> <strong>2011</strong><br />
51