2011 Annual Report - TOM Group
2011 Annual Report - TOM Group
2011 Annual Report - TOM Group

You also want an ePaper? Increase the reach of your titles
YUMPU automatically turns print PDFs into web optimized ePapers that Google loves.
NOTES TO THE CONSOLIDATED FINANCIAL STATEMENTS<br />
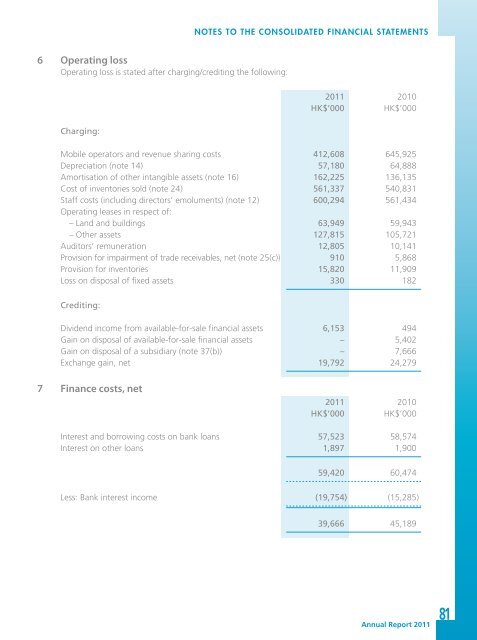
6 Operating loss<br />
Operating loss is stated after charging/crediting the following:<br />
Charging:<br />
<strong>2011</strong> 2010<br />
HK$’000 HK$’000<br />
Mobile operators and revenue sharing costs 412,608 645,925<br />
Depreciation (note 14) 57,180 64,888<br />
Amortisation of other intangible assets (note 16) 162,225 136,135<br />
Cost of inventories sold (note 24) 561,337 540,831<br />
Staff costs (including directors’ emoluments) (note 12) 600,294 561,434<br />
Operating leases in respect of:<br />
– Land and buildings 63,949 59,943<br />
– Other assets 127,815 105,721<br />
Auditors’ remuneration 12,805 10,141<br />
Provision for impairment of trade receivables, net (note 25(c)) 910 5,868<br />
Provision for inventories 15,820 11,909<br />
Loss on disposal of fixed assets 330 182<br />
Crediting:<br />
Dividend income from available-for-sale financial assets 6,153 494<br />
Gain on disposal of available-for-sale financial assets – 5,402<br />
Gain on disposal of a subsidiary (note 37(b)) – 7,666<br />
Exchange gain, net 19,792 24,279<br />
7 Finance costs, net<br />
<strong>2011</strong> 2010<br />
HK$’000 HK$’000<br />
Interest and borrowing costs on bank loans 57,523 58,574<br />
Interest on other loans 1,897 1,900<br />
59,420 60,474<br />
Less: Bank interest income (19,754) (15,285)<br />
39,666 45,189<br />
<strong>Annual</strong> <strong>Report</strong> <strong>2011</strong><br />
81