2011 Annual Report - TOM Group
2011 Annual Report - TOM Group
2011 Annual Report - TOM Group

You also want an ePaper? Increase the reach of your titles
YUMPU automatically turns print PDFs into web optimized ePapers that Google loves.
76<br />
NOTES TO THE CONSOLIDATED FINANCIAL STATEMENTS<br />
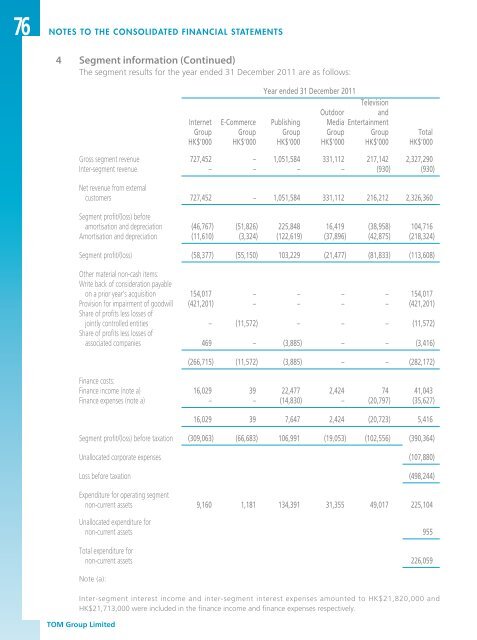
4 Segment information (Continued)<br />
The segment results for the year ended 31 December <strong>2011</strong> are as follows:<br />
<strong>TOM</strong> <strong>Group</strong> Limited<br />
Year ended 31 December <strong>2011</strong><br />
Television<br />
Outdoor<br />
and<br />
Internet E-Commerce Publishing Media Entertainment<br />
<strong>Group</strong> <strong>Group</strong> <strong>Group</strong> <strong>Group</strong> <strong>Group</strong> Total<br />
HK$’000 HK$’000 HK$’000 HK$’000 HK$’000 HK$’000<br />
Gross segment revenue 727,452 – 1,051,584 331,112 217,142 2,327,290<br />
Inter-segment revenue – – – – (930) (930)<br />
Net revenue from external<br />
customers 727,452 – 1,051,584 331,112 216,212 2,326,360<br />
Segment profit/(loss) before<br />
amortisation and depreciation (46,767) (51,826) 225,848 16,419 (38,958) 104,716<br />
Amortisation and depreciation (11,610) (3,324) (122,619) (37,896) (42,875) (218,324)<br />
Segment profit/(loss) (58,377) (55,150) 103,229 (21,477) (81,833) (113,608)<br />
Other material non-cash items:<br />
Write back of consideration payable<br />
on a prior year’s acquisition 154,017 – – – – 154,017<br />
Provision for impairment of goodwill (421,201) – – – – (421,201)<br />
Share of profits less losses of<br />
jointly controlled entities – (11,572) – – – (11,572)<br />
Share of profits less losses of<br />
associated companies 469 – (3,885) – – (3,416)<br />
(266,715) (11,572) (3,885) – – (282,172)<br />
Finance costs:<br />
Finance income (note a) 16,029 39 22,477 2,424 74 41,043<br />
Finance expenses (note a) – – (14,830) – (20,797) (35,627)<br />
16,029 39 7,647 2,424 (20,723) 5,416<br />
Segment profit/(loss) before taxation (309,063) (66,683) 106,991 (19,053) (102,556) (390,364)<br />
Unallocated corporate expenses (107,880)<br />
Loss before taxation (498,244)<br />
Expenditure for operating segment<br />
non-current assets 9,160 1,181 134,391 31,355 49,017 225,104<br />
Unallocated expenditure for<br />
non-current assets 955<br />
Total expenditure for<br />
non-current assets 226,059<br />
Note (a):<br />
Inter-segment interest income and inter-segment interest expenses amounted to HK$21,820,000 and<br />
HK$21,713,000 were included in the finance income and finance expenses respectively.