2011 Annual Report - TOM Group
2011 Annual Report - TOM Group
2011 Annual Report - TOM Group

Create successful ePaper yourself
Turn your PDF publications into a flip-book with our unique Google optimized e-Paper software.
72<br />
NOTES TO THE CONSOLIDATED FINANCIAL STATEMENTS<br />
2 Financial risk management (Continued)<br />
(c)<br />
Fair value estimation (Continued)<br />
The financial instruments that are measured at fair value require disclosure of fair value<br />
measurements by level of the following fair value measurement hierarchy:<br />
• Quoted prices (unadjusted) in active markets for identical assets or liabilities (level 1).<br />
• Inputs other than quoted prices included within level 1 that are observable for the asset<br />
or liability, either directly (that is, as prices) or indirectly (that is, derived from prices)<br />
(level 2).<br />
• Inputs for the asset or liability that are not based on observable market data (that is,<br />
unobservable inputs) (level 3).<br />
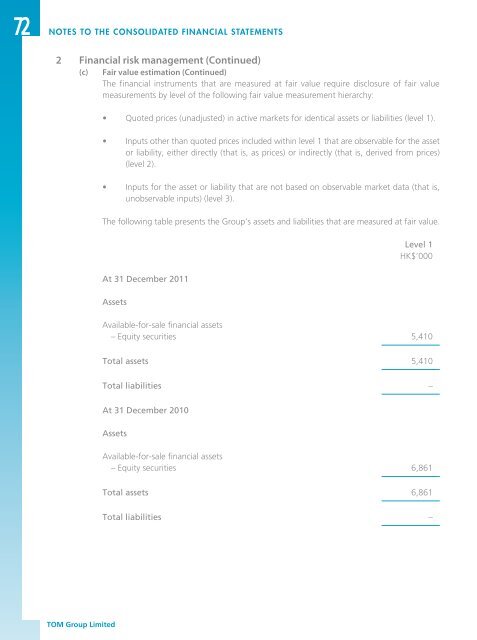
The following table presents the <strong>Group</strong>’s assets and liabilities that are measured at fair value.<br />
At 31 December <strong>2011</strong><br />
Assets<br />
Level 1<br />
HK$’000<br />
Available-for-sale financial assets<br />
– Equity securities 5,410<br />
Total assets 5,410<br />
Total liabilities –<br />
At 31 December 2010<br />
Assets<br />
Available-for-sale financial assets<br />
– Equity securities 6,861<br />
Total assets 6,861<br />
Total liabilities –<br />
<strong>TOM</strong> <strong>Group</strong> Limited