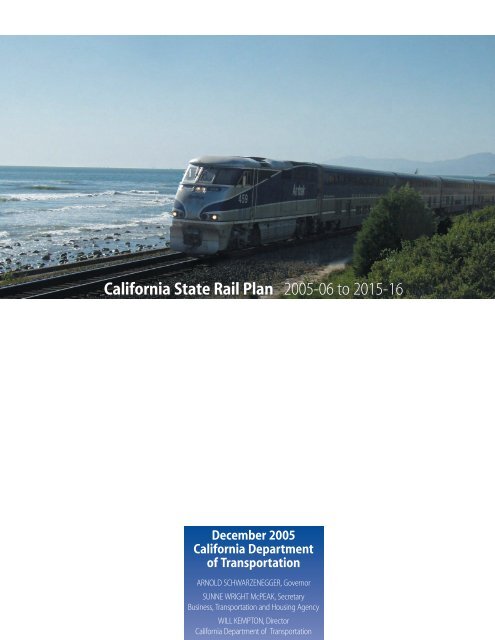
California State Rail Plan 2005-06 to 2015-16
California State Rail Plan 2005-06 to 2015-16
California State Rail Plan 2005-06 to 2015-16

You also want an ePaper? Increase the reach of your titles
YUMPU automatically turns print PDFs into web optimized ePapers that Google loves.
<strong>California</strong> <strong>State</strong> <strong>Rail</strong> <strong>Plan</strong> <strong>2005</strong>-<strong>06</strong> <strong>to</strong> <strong>2015</strong>-<strong>16</strong><br />
December <strong>2005</strong><br />
<strong>California</strong> Department<br />
of Transportation<br />
ARNOLD SCHWARZENEGGER, Governor<br />
SUNNE WRIGHT McPEAK, Secretary<br />
Business, Transportation and Housing Agency<br />
WILL KEMPTON, Direc<strong>to</strong>r<br />
<strong>California</strong> Department of Transportation
JOSEPH TAVAGLIONE, Chair<br />
JEREMIAH F. HALLISEY, Vice Chair<br />
BOB BALGENORTH<br />
MARIAN BERGESON<br />
JOHN CHALKER<br />
JAMES C. GHIELMETTJ<br />
ALLEN M. LAWRENCE<br />
R. K. LINDSEY<br />
ESTEBAN E. TORRES<br />
SENATOR TOM TORLAKSON, Ex Officio<br />
ASSEMBL YMEMBER JENNY OROPEZA, Ex Officio<br />
STATE OF CALIFORNIA<br />
ARNOLDSCHWARZENEGGER<br />
GOVERNOR<br />
JOHN BARNA, Executive Direc<strong>to</strong>r<br />
CALIFORNIA TRANSPORTATION COMMISSION<br />
1120 N STREET. MS-52<br />
P. O. BOX 942873<br />
SACRAMENTO. 94273-0001<br />
FAX (9<strong>16</strong>) 653-2134<br />
(9<strong>16</strong>) 654-4245<br />
http://\\WW.catc.cagov<br />
December 29,<strong>2005</strong><br />
Honorable Alan Lowenthal, Chairman<br />
Senate Transportation and Housing Conmrittee<br />
<strong>State</strong> Capi<strong>to</strong>l, Room 2209<br />
Sacramen<strong>to</strong>, CA 95814<br />
Honorable Jenny Oropeza, Chair<br />
Assembly Transportation Committee<br />
1020 N Street, Room 112<br />
Sacramen<strong>to</strong>, CA 95814<br />
Dear: Sena<strong>to</strong>r Lowenthal<br />
Assembly Member Oropeza:<br />
On behalf of the <strong>California</strong> Transportation Commission, I am transmitting <strong>to</strong> the Legislature the 10-year <strong>California</strong><br />
<strong>State</strong> <strong>Rail</strong> <strong>Plan</strong> for FY <strong>2005</strong>-<strong>06</strong> through FY <strong>2015</strong>-<strong>16</strong> by the Department of Transportation (Caltrans) with the<br />
Commission's resolution (#G-05-ll) giving advice and consent, as required by Section 14036 of the Governrnent<br />
Code.<br />
The ten-year plan provides Caltrans' vision for intercity rail service. Caltrans' IO-year plan goals are <strong>to</strong> provide<br />
intercity rail as an alternative mode of transportation, promote congestion relief, improve air quality, better fuel<br />
efficiency, and improved land use practices. This year's <strong>Plan</strong> includes: standards for meeting those goals; sets<br />
priorities for increased revenues, increased capacity, reduced running times; and cost effectiveness.<br />
The plan:<br />
describes <strong>California</strong>'s intercity rail network and connecting bus service.<br />
presents Caltrans' ten-year reconnnendations regarding the level of state-supported service on specific<br />
routes, as well as the capital and operational funding needed <strong>to</strong> support such service.<br />
discusses rail planning and marketing, programming, funding processes for operations and capital<br />
improvements, freight rail, and potential new service and routes.<br />
In reviewing Caltrans' Draft 20<strong>06</strong> ten-year plan, the Commission at its: November <strong>2005</strong> meeting advised Caltrans,<br />
which Caltrans has included in its final ten-year plan, <strong>to</strong>:
Honorable Alan Lowenthal<br />
Honorable Oropeza<br />
December 27, <strong>2005</strong><br />
Page 2<br />
discuss the benefits of a stable funding source and increased funding <strong>to</strong> address future capital and operating<br />
requirements.<br />
discuss the need for a dedicated and reliable funding source <strong>to</strong> perform the major overhaul of locomotives<br />
and passenger cars and acquisition of new equipment.<br />
The Connnission adopted its Advice and Consent resolution (attached) at its November <strong>2005</strong> meeting. (Caltrans is<br />
responsible for transmitting the ten-year plan, after it has prepared the plan for publication.) The Connnission<br />
appreciates the opportunity <strong>to</strong> give advice and consent on Caltrans' <strong>2005</strong>10-year <strong>California</strong> <strong>State</strong> <strong>Rail</strong> <strong>Plan</strong>. The<br />
Connnission intends its advice <strong>to</strong> be constructive in producing a plan that identifies current and potential future<br />
issues for the Administration and the Legislature. The Connnission intends <strong>to</strong> continue, in cooperation with Caltrans<br />
and local agencies, <strong>to</strong> implement and expand intercity rail service in <strong>California</strong>.<br />
Sincerely,<br />
Joseph Tavaglione<br />
Chair<br />
<strong>California</strong> Transportation Commission<br />
Attachment<br />
adviceandconsentO6 transmittaltrdoc
.<br />
PASSED BY<br />
CALIFORNIA TRANSPORTATION COMMISSION<br />
Commission Consent <strong>to</strong> the Department's<br />
Ten-Year <strong>California</strong> <strong>State</strong> <strong>Rail</strong> <strong>Plan</strong><br />
Resolution G-OS-ll<br />
1.1 WHEREAS, the <strong>California</strong> Transportation Commission (Commission) is required by<br />
Govemm.ent Code Section 14036 <strong>to</strong> give its advice and consent on the Department of<br />
Transporthtion (Department) 10-year <strong>State</strong> <strong>Rail</strong> <strong>Plan</strong>; and<br />
1.2 WHEREAS, the Department has prepared the <strong>2005</strong> Caljfomia <strong>State</strong> <strong>Rail</strong> <strong>Plan</strong> for<br />
FY <strong>2005</strong>-<strong>06</strong> through FY <strong>2015</strong>-<strong>16</strong> in order <strong>to</strong> provide a comprehensive 10-year plan; and<br />
1.3 WHEREAS, the Commission has reviewed the <strong>California</strong> <strong>State</strong> <strong>Rail</strong> <strong>Plan</strong> at its November<br />
<strong>2005</strong> meeting; and<br />
1.4 WHEREAS, the Commission advised the Departmenthat the <strong>State</strong> <strong>Rail</strong> <strong>Plan</strong> should include:<br />
a discussion of the benefits of a stable funding source and increased funding <strong>to</strong> address<br />
future capital and operating requirements.<br />
a discussion on the need for a dedicated and reliable funding source <strong>to</strong> perform the major<br />
overhaul of locomotives and passenger cars and acquisition of new equipment.<br />
1.5 WHEREAS, the Department has agreed <strong>to</strong> incorporate the Commission's advice in<strong>to</strong> its final<br />
ten-year report.<br />
2<br />
NOW, THEREFORE BE IT RESOLVED that the Commission does hereby consent <strong>to</strong> the<br />
information contained in the <strong>California</strong> <strong>State</strong> <strong>Rail</strong> <strong>Plan</strong> and directs the Department <strong>to</strong> transmit<br />
<strong>to</strong> the Legislature, the Governor, and the Public Utilities Commission the 10-year <strong>State</strong> <strong>Rail</strong><br />
<strong>Plan</strong> for FY <strong>2005</strong>-<strong>06</strong> through FY <strong>2015</strong>-<strong>16</strong>.<br />
CastaterailplanllOSresolution.doc
CALIFORNIA STATE RAIL PLAN<br />
<strong>2005</strong>-<strong>06</strong> TO <strong>2015</strong>-<strong>16</strong><br />
December <strong>2005</strong><br />
<strong>California</strong> Department of Transportation
<strong>2005</strong>-<strong>06</strong> – <strong>2015</strong>-<strong>16</strong> <strong>California</strong> <strong>State</strong> <strong>Rail</strong> <strong>Plan</strong>
Table of Contents<br />
Table of Contents<br />
Executive Summary ....................................................................................... 1<br />
Introduction................................................................................................... 1<br />
Part I - Passenger <strong>Rail</strong> Element .................................................................. 3<br />
Chapter - I <strong>California</strong>’s Vision for Intercity Passenger <strong>Rail</strong> ................... 5<br />
Go<strong>California</strong> ........................................................................................................ 5<br />
The Department’s Mission and Goals.................................................................. 6<br />
Interregional Strategic <strong>Plan</strong>ning........................................................................... 6<br />
The Department’s Vision for Intercity Passenger <strong>Rail</strong> ........................................ 6<br />
Relationship of Department’s Goals <strong>to</strong> Intercity Passenger <strong>Rail</strong>......................... 8<br />
Chapter II - Capital Program...................................................................... 9<br />
Capital Program Goals ......................................................................................... 9<br />
Unconstrained Ten-Year Capital Program........................................................... 9<br />
Projected Capital Projects.............................................................................. 10<br />
Projected Capital Projects.............................................................................. 11<br />
Corridor Strategic <strong>Plan</strong>ning ........................................................................... 12<br />
Constrained Capital Program ............................................................................. 13<br />
Capital Program Funding ................................................................................... 14<br />
Background.................................................................................................... 14<br />
Outlook .......................................................................................................... 17<br />
Rolling S<strong>to</strong>ck Program ....................................................................................... 18<br />
Rolling S<strong>to</strong>ck Fleet ........................................................................................ 18<br />
Rolling S<strong>to</strong>ck Maintenance and Overhaul Program...................................... 18<br />
<strong>Rail</strong>-Highway Grade Crossing Improvement and Separation Programs ........... 21<br />
Federal Section 1010/1103(c) <strong>Rail</strong>way-Highway Crossing<br />
Hazard Elimination in High Speed <strong>Rail</strong> Corridors Program..................... 21<br />
Federal Section 130 Crossing Improvement Program................................... 21<br />
<strong>State</strong> Section 190 Grade Separation Program................................................ 23<br />
Station Programs ................................................................................................ 24<br />
Parking Facilities at Intercity <strong>Rail</strong> Stations ................................................... 24<br />
Decrepit Stations............................................................................................ 25<br />
Chapter III - Operations Program............................................................ 27<br />
Operations Program Goals ................................................................................. 27<br />
Ten-Year Intercity <strong>Rail</strong> Service Levels and Operations Financial <strong>Plan</strong> ............ 27<br />
Progress In Meeting Route Objectives .......................................................... 29<br />
Administration and Marketing Costs............................................................. 35<br />
i
<strong>2005</strong>-<strong>06</strong> – <strong>2015</strong>-<strong>16</strong> <strong>California</strong> <strong>State</strong> <strong>Rail</strong> <strong>Plan</strong><br />
Table of Contents<br />
(continued)<br />
Operations Program............................................................................................ 35<br />
Operational Efficiency and Schedule <strong>Plan</strong>ning............................................. 35<br />
Passenger Amenities...................................................................................... 36<br />
Connecting Amtrak Bus Services.................................................................. 39<br />
Multimodal Connectivity............................................................................... 41<br />
<strong>Rail</strong> 2 <strong>Rail</strong> Program ....................................................................................... 42<br />
Airport Access ............................................................................................... 43<br />
Chapter IV - Marketing Program............................................................. 45<br />
Marketing Program Goals .................................................................................. 45<br />
Marketing Budget............................................................................................... 45<br />
Department’s Marketing Program...................................................................... 46<br />
Advertising .................................................................................................... 46<br />
Public Relations/Outreach ............................................................................. 46<br />
Group Travel.................................................................................................. 47<br />
<strong>Rail</strong> Safety ..................................................................................................... 48<br />
Market Research ............................................................................................ 49<br />
Capi<strong>to</strong>l Corridor Marketing Program................................................................ 50<br />
Chapter V - The <strong>California</strong> <strong>Rail</strong> Network................................................ 53<br />
<strong>Rail</strong> Services in <strong>California</strong> ................................................................................. 53<br />
The <strong>State</strong>’s Role in <strong>Rail</strong> Passenger Service ....................................................... 56<br />
Intercity <strong>Rail</strong> Services.................................................................................... 56<br />
Commuter <strong>Rail</strong> Services................................................................................ 56<br />
Definition of Commuter Versus Intercity <strong>Rail</strong>.............................................. 58<br />
Amtrak Basic System Services .......................................................................... 59<br />
Route Descriptions......................................................................................... 59<br />
Amtrak Ridership by Station ......................................................................... 61<br />
Other Passenger <strong>Rail</strong> Services....................................................................... 65<br />
Chapter VI - Pacific Surfliner Route ........................................................ 67<br />
Ten-Year Operational and Service Improvement <strong>Plan</strong>s..................................... 68<br />
On-Time Performance ................................................................................... 68<br />
Passenger Safety, Comfort, Convenience, and Information.......................... 68<br />
Intermodal Connectivity ................................................................................ 68<br />
Travel Times.................................................................................................. 69<br />
Ridership, Revenue, and Farebox Ratio ........................................................ 69<br />
Ten-Year <strong>Plan</strong>ned Train Service Expansion <strong>Plan</strong>s ............................................ 70<br />
Increased Service Frequencies....................................................................... 70<br />
San Francisco <strong>to</strong> San Luis Obispo (and Los Angeles) Extension ................. 70<br />
Route His<strong>to</strong>ry and Performance ......................................................................... 70<br />
His<strong>to</strong>rical Performance .................................................................................. 72<br />
ii
Table of Contents<br />
Table of Contents<br />
(continued)<br />
Route Description............................................................................................... 74<br />
Connecting Amtrak buses.............................................................................. 76<br />
Route Administration ......................................................................................... 76<br />
Los Angeles-San Diego-San Luis Obispo <strong>Rail</strong> Corridor Agency<br />
(LOSSAN)................................................................................................. 77<br />
Chapter VII - San Joaquin Route.............................................................. 79<br />
Ten-Year Operational and Service Improvement <strong>Plan</strong>s..................................... 80<br />
On-Time Performance ................................................................................... 80<br />
Passenger Safety, Comfort, Convenience, and Information.......................... 81<br />
Intermodal Connectivity ................................................................................ 81<br />
Travel Times.................................................................................................. 81<br />
Ridership, Revenue, and Farebox Ratio ........................................................ 81<br />
Ten-Year <strong>Plan</strong>ned Train Service Expansion <strong>Plan</strong>s ............................................ 82<br />
Increased Service Frequencies....................................................................... 82<br />
S<strong>to</strong>ck<strong>to</strong>n <strong>to</strong> Oakland ...................................................................................... 82<br />
Bakersfield <strong>to</strong> Los Angeles............................................................................ 82<br />
Route His<strong>to</strong>ry and Performance ......................................................................... 83<br />
His<strong>to</strong>rical Performance .................................................................................. 84<br />
Route Description............................................................................................... 86<br />
Connecting Amtrak Buses ............................................................................. 87<br />
Route Administration ......................................................................................... 89<br />
San Joaquin Valley <strong>Rail</strong> Committee.............................................................. 89<br />
Chapter VIII - The Capi<strong>to</strong>l Corridor ......................................................... 91<br />
Route Administration ......................................................................................... 92<br />
Ten-Year Operational and Service Improvement <strong>Plan</strong>s..................................... 92<br />
On-Time Performance ................................................................................... 92<br />
Enhance Cus<strong>to</strong>mer Satisfaction ..................................................................... 93<br />
Intermodal Connectivity ................................................................................ 93<br />
Travel Times.................................................................................................. 93<br />
Ridership, Revenue, and Farebox Ratio ........................................................ 94<br />
Ten-Year <strong>Plan</strong>ned Train Service Expansion <strong>Plan</strong>s ............................................ 94<br />
Increased Service Frequencies....................................................................... 94<br />
Sacramen<strong>to</strong>-Reno Extension.......................................................................... 95<br />
Dumbar<strong>to</strong>n <strong>Rail</strong> Corridor............................................................................... 95<br />
Auburn-Oakland Regional <strong>Rail</strong> Service........................................................ 95<br />
Route His<strong>to</strong>ry and Performance ......................................................................... 96<br />
His<strong>to</strong>rical Performance .................................................................................. 98<br />
Route Description............................................................................................... 98<br />
Connecting Amtrak Buses ........................................................................... 100<br />
iii
<strong>2005</strong>-<strong>06</strong> – <strong>2015</strong>-<strong>16</strong> <strong>California</strong> <strong>State</strong> <strong>Rail</strong> <strong>Plan</strong><br />
Table of Contents<br />
(continued)<br />
Chapter IX - Commuter <strong>Rail</strong> Services.................................................... 103<br />
Coaster Commuter <strong>Rail</strong> Service (San Diego-Oceanside) ............................... 103<br />
Background.................................................................................................. 105<br />
Organizational Structure.............................................................................. 105<br />
Route and Service Description .................................................................... 105<br />
Fare Structure............................................................................................... 1<strong>06</strong><br />
Connecting Services .................................................................................... 1<strong>06</strong><br />
Performance................................................................................................. 107<br />
Capital Improvement Program .................................................................... 107<br />
Metrolink Commuter <strong>Rail</strong> Service (Los Angeles, Orange, Riverside,<br />
San Bernardino, and Ventura counties)....................................................... 109<br />
Background.................................................................................................. 109<br />
Organizational Structure.............................................................................. 110<br />
Route and Service Description .................................................................... 110<br />
Fare Structure............................................................................................... 111<br />
Connecting Services .................................................................................... 112<br />
Performance................................................................................................. 112<br />
Capital Improvement Program .................................................................... 113<br />
Proposed Service Enhancements ................................................................. 114<br />
Caltrain Commuter <strong>Rail</strong> Service (San Francisco-San Jose-Gilroy)................ 117<br />
Background.................................................................................................. 117<br />
Organizational Structure.............................................................................. 118<br />
Route and Service Description .................................................................... 118<br />
Fare Structure............................................................................................... 119<br />
Connecting Services .................................................................................... 119<br />
Performance................................................................................................. 120<br />
<strong>Plan</strong>ned Improvements ................................................................................ 120<br />
Capital Improvement Program .................................................................... 121<br />
Proposed Service Extensions....................................................................... 122<br />
ACE Commuter <strong>Rail</strong> Service (S<strong>to</strong>ck<strong>to</strong>n-San Jose)......................................... 124<br />
Background.................................................................................................. 124<br />
Organizational Structure.............................................................................. 125<br />
Route and Service Description .................................................................... 125<br />
Fare Structure............................................................................................... 126<br />
Connecting Services .................................................................................... 126<br />
Performance................................................................................................. 126<br />
<strong>Plan</strong>ned Improvements ................................................................................ 127<br />
Capital Improvement Program .................................................................... 127<br />
Proposed Service Extensions....................................................................... 128<br />
iv
Table of Contents<br />
Table of Contents<br />
(continued)<br />
Proposed Commuter <strong>Rail</strong> Services................................................................... 128<br />
Ventura and Santa Barbara Commuter <strong>Rail</strong> Service ................................... 128<br />
Sonoma Marin-Area <strong>Rail</strong> Transit ................................................................ 128<br />
Auburn-Oakland Regional <strong>Rail</strong> Service...................................................... 129<br />
Chapter X - Potential New Services........................................................ 133<br />
Proposed Intercity <strong>Rail</strong> Routes......................................................................... 133<br />
San Francisco <strong>to</strong> San Luis Obispo (and Los Angeles) Via Coast Route..... 133<br />
Sacramen<strong>to</strong> <strong>to</strong> Reno..................................................................................... 135<br />
Sacramen<strong>to</strong> <strong>to</strong> Redding................................................................................ 136<br />
Los Angeles <strong>to</strong> Indio (Coachella Valley) .................................................... 137<br />
Potential Intercity <strong>Rail</strong> Routes ......................................................................... 138<br />
San Francisco <strong>to</strong> Monterey .......................................................................... 138<br />
Los Angeles <strong>to</strong> Las Vegas ........................................................................... 140<br />
High-Speed <strong>Rail</strong> ............................................................................................... 140<br />
Background.................................................................................................. 140<br />
<strong>California</strong> High-Speed <strong>Rail</strong> Authority......................................................... 141<br />
Magnetic Levitation ......................................................................................... 143<br />
Southern <strong>California</strong> Maglev Project............................................................ 146<br />
Las Vegas-Anaheim Maglev Project........................................................... 147<br />
Chapter XI - Amtrak................................................................................ 149<br />
Amtrak’s Relationship with the Department and the Capi<strong>to</strong>l Corridor<br />
Joint Powers Authority ................................................................................ 149<br />
Amtrak <strong>Plan</strong>ning .............................................................................................. 150<br />
Amtrak Strategic Reform Initiative and FY <strong>06</strong> Grant Request ................... 150<br />
Amtrak’s 2004 Strategic Business <strong>Plan</strong>....................................................... 151<br />
Amtrak Reform and Budget ............................................................................. 155<br />
FFY 2003 Budget and Legislative Reform Proposals................................. 155<br />
FFY 2004 Budget and Legislative Reform Proposals................................. 155<br />
FFY <strong>2005</strong> Budget and Legislative Reform Proposals................................. 156<br />
FFY 20<strong>06</strong> Budget and Legislative Reform Proposals................................. 156<br />
Chapter XII - Intercity <strong>Rail</strong> Funding ..................................................... 157<br />
Public Transportation Account......................................................................... 157<br />
Use of PTA Funds ....................................................................................... 157<br />
Funding Sources .......................................................................................... 157<br />
Repayments <strong>to</strong> the PTA............................................................................... 159<br />
<strong>State</strong> Highway Account.................................................................................... 159<br />
Traffic Congestion Relief Fund........................................................................ <strong>16</strong>0<br />
Tribal Compact Bonds ..................................................................................... <strong>16</strong>0<br />
The Passenger <strong>Rail</strong> and Clean Air Bond Act of 1990 (Proposition 108) ....... <strong>16</strong>0<br />
v
<strong>2005</strong>-<strong>06</strong> – <strong>2015</strong>-<strong>16</strong> <strong>California</strong> <strong>State</strong> <strong>Rail</strong> <strong>Plan</strong><br />
Table of Contents<br />
(continued)<br />
Clean Air and Transportation Improvement Act of 1990 (Proposition 1<strong>16</strong>)... <strong>16</strong>1<br />
General Fund .................................................................................................... <strong>16</strong>1<br />
Local Funds ...................................................................................................... <strong>16</strong>1<br />
Federal Funds ................................................................................................... <strong>16</strong>1<br />
Amtrak Funds................................................................................................... <strong>16</strong>2<br />
<strong>Rail</strong>road Funds ................................................................................................. <strong>16</strong>2<br />
Chapter XIII - Environment and Land Use........................................... <strong>16</strong>3<br />
Environmental Goals for the Intercity Passenger <strong>Rail</strong> Program ...................... <strong>16</strong>3<br />
Congestion Relief ........................................................................................ <strong>16</strong>3<br />
Travel Mode Share ...................................................................................... <strong>16</strong>4<br />
Air Quality................................................................................................... <strong>16</strong>5<br />
Energy Efficiency ........................................................................................ <strong>16</strong>5<br />
Land Use........................................................................................................... <strong>16</strong>6<br />
Progress in Meeting Environmental and Land Use Goals ............................... 170<br />
Part II - Freight <strong>Rail</strong> Element ................................................................. 173<br />
Chapter XIV - Introduction..................................................................... 175<br />
Major Freight <strong>Rail</strong>roads ................................................................................... 175<br />
Union Pacific <strong>Rail</strong>road ................................................................................ 177<br />
BNSF <strong>Rail</strong>way............................................................................................. 177<br />
Regional <strong>Rail</strong>roads ........................................................................................... 179<br />
Short Line <strong>Rail</strong>roads......................................................................................... 179<br />
Commodities Shipped ...................................................................................... 182<br />
Chapter XV - Major Freight Issues ........................................................ 183<br />
Go<strong>California</strong> .................................................................................................... 183<br />
Goods Movement Action <strong>Plan</strong> ......................................................................... 183<br />
Growing Business and Capacity Concerns ...................................................... 184<br />
Intermodal Shipments.................................................................................. 185<br />
Shared Use of Rights-of-Way...................................................................... 187<br />
Joint Dispatching of Freight Operations...................................................... 188<br />
Fresno <strong>Rail</strong> Consolidation ........................................................................... 189<br />
Major Issues for <strong>California</strong> <strong>Rail</strong> Shippers........................................................ 189<br />
Chapter XVI - Short Line Analysis......................................................... 191<br />
Short Line <strong>Rail</strong>road Issues ............................................................................... 191<br />
Securing Infrastructure Funding Sources .................................................... 191<br />
Trend Towards Heavier Cars....................................................................... 191<br />
Short Line Bill of Rights ............................................................................. 192<br />
Short Line Survey............................................................................................. 194<br />
Service and Infrastructure ................................................................................ 194<br />
vi
Table of Contents<br />
Table of Contents<br />
(continued)<br />
Commodity Movements................................................................................... 195<br />
Upgrade Costs .................................................................................................. 196<br />
Impact on Maintenance................................................................................ 197<br />
Chapter XVII - Funding........................................................................... 199<br />
Economic Role of Short Line and Regional <strong>Rail</strong>roads .................................... 199<br />
Sustainability of Short Lines and Regional <strong>Rail</strong>roads ..................................... 199<br />
Funding Sources for Short Lines...................................................................... 200<br />
Federal <strong>Rail</strong> Programs ................................................................................. 200<br />
<strong>State</strong> Programs............................................................................................. 202<br />
<strong>California</strong> Traffic Congestion Relief Program ............................................ 204<br />
Northwestern Pacific <strong>Rail</strong>road ......................................................................... 204<br />
Chapter XVIII - Environmental Review ................................................ 207<br />
Introduction ...................................................................................................... 207<br />
Noise................................................................................................................. 208<br />
Federal Ruling on Sounding Locomotive Horns......................................... 209<br />
Noise Standards ........................................................................................... 209<br />
Mitigation of Noise Impacts ........................................................................ 209<br />
Vibration........................................................................................................... 210<br />
<strong>Rail</strong> - Highway Grade Crossings...................................................................... 210<br />
Existing Conditions ..................................................................................... 211<br />
<strong>Rail</strong>-Highway Accidents.............................................................................. 211<br />
Air Quality........................................................................................................ 212<br />
Emission Standards for <strong>Rail</strong> Vehicles ......................................................... 213<br />
Enforcement................................................................................................. 213<br />
Chapter XIX - New Technology .............................................................. 215<br />
Global Positioning System Applications ......................................................... 215<br />
Positive Train Control ...................................................................................... 215<br />
Information Technology Applications ............................................................. 2<strong>16</strong><br />
Electronic Commerce....................................................................................... 217<br />
Locomotive Technology .................................................................................. 217<br />
Electronic Braking............................................................................................ 218<br />
Increased Car Capacity..................................................................................... 218<br />
Rolling S<strong>to</strong>ck Improvements............................................................................ 219<br />
Summary .......................................................................................................... 219<br />
Chapter XX - Future Needs ..................................................................... 221<br />
Appendix - Acronyms............................................................................... 223<br />
vii
<strong>2005</strong>-<strong>06</strong> – <strong>2015</strong>-<strong>16</strong> <strong>California</strong> <strong>State</strong> <strong>Rail</strong> <strong>Plan</strong><br />
viii
Table of Figures<br />
Table of Figures<br />
Figure 2A – Ten-Year Intercity <strong>Rail</strong> Capital Program Project Costs .................. 10<br />
Figure 2B – Constrained Ten-Year Intercity <strong>Rail</strong> Capital Program<br />
Project Costs................................................................................. 14<br />
Figure 2C – Intercity <strong>Rail</strong> Capital Program Funding His<strong>to</strong>ry ............................. 15<br />
Figure 2D – Intercity <strong>Rail</strong> Rolling S<strong>to</strong>ck Overhaul Program............................... 20<br />
Figure 2E – Section 130 Federal Crossing Improvement Program<br />
Funding Status .............................................................................. 22<br />
Figure 3A – Intercity <strong>Rail</strong> Ridership and Service Levels...................................... 30<br />
Figure 3B – Intercity <strong>Rail</strong> Operations Financial <strong>Plan</strong> ......................................... 31<br />
Figure 3C – Performance by Route....................................................................... 32<br />
Figure 3D – <strong>State</strong> Costs by Route ......................................................................... 33<br />
Figure 3E – Route Objectives by Corridor ........................................................... 34<br />
Figure 3F – Intercity <strong>Rail</strong> Administration and Marketing Costs.......................... 35<br />
Figure 3G – Amtrak Connecting Bus Performance in <strong>California</strong> ........................ 40<br />
Figure 3H – <strong>Rail</strong> Access <strong>to</strong> Major <strong>California</strong> Airports ........................................ 44<br />
Figure 5A – <strong>California</strong> Intercity and Commuter Passenger <strong>Rail</strong> Network Map.. 52<br />
Figure 5B – <strong>Rail</strong> Passenger Services in <strong>California</strong> .............................................. 54<br />
Figure 5C – Annual Intercity and Commuter <strong>Rail</strong> Ridership in <strong>California</strong> ......... 55<br />
Figure 5D – <strong>State</strong>-Supported Intercity <strong>Rail</strong> and Feeder Bus Routes Map............ 57<br />
Figure 5E – Amtrak Basic System Routes in <strong>California</strong> Map............................... 60<br />
Figure 5F – Amtrak Train and Bus Ridership by Station in <strong>California</strong> ............... 62<br />
Figure 6A – Pacific Surfliner Intercity <strong>Rail</strong> and Feeder Bus Routes Map ........... 66<br />
Figure 6B – Pacific Surfliner Route Annual Operating Performance.................. 73<br />
Figure 6C – Pacific Surfliner Route Ownership and Track Characteristics........ 75<br />
Figure 7A – San Joaquin Intercity <strong>Rail</strong> and Feeder Bus Routes Map.................. 78<br />
Figure 7B – San Joaquin Route Annual Operating Performance ........................ 85<br />
Figure 7C – San Joaquin Route Ownership and Track Characteristics............... 87<br />
Figure 8A – Capi<strong>to</strong>l Corridor Intercity <strong>Rail</strong> and Feeder Bus Routes Map .......... 90<br />
Figure 8B – Capi<strong>to</strong>l Corridor Annual Operating Performance ........................... 97<br />
Figure 8C – Capi<strong>to</strong>l Corridor Ownership and Track Characteristics ................. 99<br />
Figure 9A – <strong>California</strong> Intercity and Commuter Passenger<br />
<strong>Rail</strong> Network Map ....................................................................... 102<br />
Figure 9B – Southern <strong>California</strong> Commuter <strong>Rail</strong> Services Map ........................ 104<br />
Figure 9C – Coaster Annual Ridership............................................................... 107<br />
Figure 9D – Metrolink Annual Ridership ........................................................... 112<br />
Figure 9E – Northern <strong>California</strong> Commuter <strong>Rail</strong> Services Map........................ 1<strong>16</strong><br />
Figure 9F – Caltrain Annual Ridership.............................................................. 120<br />
Figure 9G – ACE Annual Ridership.................................................................... 126<br />
Figure 10A – Potential New Intercity Routes in <strong>California</strong> Map ....................... 132<br />
Figure 10B – High Speed <strong>Rail</strong> and Maglev Routes Under Study<br />
in <strong>California</strong> Map........................................................................ 145<br />
ix
<strong>2005</strong>-<strong>06</strong> – <strong>2015</strong>-<strong>16</strong> <strong>California</strong> <strong>State</strong> <strong>Rail</strong> <strong>Plan</strong><br />
Table of Figures<br />
(continued)<br />
Figure 11A – Amtrak Five-Year Strategic <strong>Plan</strong> – Capital Projects ................... 153<br />
Figure 13A – Intercity <strong>Rail</strong> Environmental and Land Use Goals ...................... 171<br />
Figure 14A – <strong>California</strong> Class I <strong>Rail</strong>roads Map ................................................ 176<br />
Figure 14B – <strong>California</strong> <strong>Rail</strong>road Freight Tonnage Map .................................. 178<br />
Figure 14C – Regional <strong>Rail</strong>roads and Short Lines in <strong>California</strong> ....................... 180<br />
Figure 14D – <strong>California</strong> Class II and Class III <strong>Rail</strong>roads Map......................... 181<br />
Figure 14E – Commodities Originated and Terminated in <strong>California</strong> .............. 182<br />
Figure 15A – <strong>California</strong> <strong>Rail</strong>road Intermodal Facilities Map ........................... 186<br />
Figure 15B – Container 20-Foot Equivalent Units at Major U.S. Ports............ 187<br />
Figure <strong>16</strong>A – Regional and Short Line <strong>Rail</strong>road Ownership by Size ................. 193<br />
Figure <strong>16</strong>B – <strong>California</strong> Short Line <strong>Rail</strong>road Commodity Distribution............. 196<br />
Figure 17A – Assistance Programs for <strong>State</strong> Short Line <strong>Rail</strong>roads ................... 203<br />
Figure 18A – Noise Exposure from Main Line <strong>Rail</strong>roads .................................. 208<br />
x
Executive Summary <strong>California</strong> <strong>State</strong> <strong>Rail</strong> <strong>Plan</strong> <strong>2005</strong>-<strong>06</strong> <strong>to</strong> <strong>2015</strong>-<strong>16</strong><br />
December <strong>2005</strong><br />
<strong>California</strong> Department<br />
of Transportation<br />
ARNOLD SCHWARZENEGGER, Governor<br />
SUNNE WRIGHT McPEAK, Secretary<br />
Business, Transportation and Housing Agency<br />
WILL KEMPTON, Direc<strong>to</strong>r<br />
<strong>California</strong> Department of Transportation
Executive Summary<br />
PART I<br />
Passenger <strong>Rail</strong> Element<br />
Government Code Section 14036 requires the <strong>California</strong> Department of Transportation<br />
(Department) <strong>to</strong> complete a ten-year <strong>State</strong> <strong>Rail</strong> <strong>Plan</strong> with both passenger and freight<br />
rail elements. The law also provides that the <strong>State</strong> <strong>Rail</strong> <strong>Plan</strong> be updated every two years.<br />
The passenger rail element of the <strong>California</strong> <strong>State</strong> <strong>Rail</strong> <strong>Plan</strong> <strong>2005</strong>-<strong>06</strong> <strong>to</strong> <strong>2015</strong>-<strong>16</strong> (<strong>State</strong><br />
<strong>Rail</strong> <strong>Plan</strong>) examines intercity passenger rail transportation in <strong>California</strong>, and reviews<br />
the current operations of state-supported intercity rail passenger service and outlines<br />
ten-year plans for capital improvements and service expansions. The passenger rail<br />
element of the <strong>State</strong> <strong>Rail</strong> <strong>Plan</strong> is covered in Part I (Chapters I through XIII); the freight<br />
rail element is contained in Part II (Chapters XIV through XX).<br />
Chapter I–<strong>California</strong>’s Vision for Intercity Passenger<br />
<strong>Rail</strong><br />
Go<strong>California</strong><br />
Transportation in <strong>California</strong> is guided by the Administration’s comprehensive<br />
Go<strong>California</strong> vision, which guides the FY <strong>2005</strong>-<strong>06</strong> transportation budget and capital<br />
and operating programs.<br />
Go<strong>California</strong>’s vision statement is:<br />
Improve mobility and accessibility for people, goods, services, and information<br />
through a safe, integrated, multimodal, world-class transportation system that<br />
achieves the “3-E’s”:<br />
• Prosperous Economy<br />
• Quality Environment<br />
• Social Equity<br />
Go<strong>California</strong>'s goal is:<br />
Mobility that continues <strong>to</strong> attract capital investment in <strong>California</strong> <strong>to</strong> generate jobs.<br />
Go<strong>California</strong>’s objectives in its ten-year investment plan for mobility are:<br />
• Address 20-year needs and reduce congestion below <strong>to</strong>day’s levels.<br />
• Deploy demand-management strategies, use existing capacity more efficiently,<br />
and expand capacity.<br />
• Build a world-class transportation system that incorporates best research and<br />
technology.<br />
The linkage between transportation, housing, and land use are also important themes<br />
in the strategies and implementation of the Go<strong>California</strong> vision.<br />
2 Executive Summary <strong>California</strong> <strong>State</strong> <strong>Rail</strong> <strong>Plan</strong> <strong>2005</strong>-<strong>06</strong> <strong>to</strong> <strong>2015</strong>-<strong>16</strong>
THE DEPARTMENT’S MISSION AND GOALS<br />
The Department’s mission–“Caltrans Improves Mobility across <strong>California</strong>” and its<br />
five strategic goals: safety, mobility, delivery, flexibility, and stewardship, support the<br />
Go<strong>California</strong> vision.<br />
INTERREGIONAL STRATEGIC PLANNING<br />
The Department’s Interregional Transportation Strategic <strong>Plan</strong> (ITSP) is the strategic<br />
planning document for interregional capital projects, and relies heavily upon the <strong>State</strong><br />
<strong>Rail</strong> <strong>Plan</strong> for its intercity rail portion.<br />
THE DEPARTMENT’S VISION FOR INTERCITY RAIL<br />
The Department’s Intercity Passenger <strong>Rail</strong> Vision supports the Go<strong>California</strong> vision, the<br />
Department’s mission and goals, and the ITSP. It includes the following elements:<br />
• Provide relief <strong>to</strong> highway and airway congestion.<br />
• Provide a rail transportation alternative <strong>to</strong> other travel modes.<br />
• Improve air quality, conserve fuel, and contribute <strong>to</strong> efficient and environmentally<br />
superior land use.<br />
Chapter II–Capital Program<br />
CAPITAL PROGRAM GOALS<br />
• Expand capacity on existing routes for increased frequencies and reliability.<br />
• Reduce train running times <strong>to</strong> attract riders and <strong>to</strong> provide an efficient service.<br />
• Improve equipment, stations, and facilities.<br />
• Increase farebox ratio <strong>to</strong> reach or exceed 50 percent.<br />
• Improve the safety of state-supported intercity rail service, including grade crossings.<br />
• Implement projects <strong>to</strong> allow new cost-effective routes.<br />
TEN-YEAR INTERCITY RAIL CAPITAL PROGRAM<br />
The Department’s ten-year $3.1 billion capital program for the three existing statesupported<br />
routes and for new routes represents an unconstrained program based<br />
on project needs, and not funding expectations. Full implementation of this capital<br />
program would require major federal funding. Key projects in the program are listed in<br />
the chapter.<br />
If sufficient funding for the unconstrained program is unavailable, a constrained<br />
program would be implemented with state funds from future <strong>State</strong> Transportation<br />
Improvement Program (STIP) programming cycles, as supplemented by other funding.<br />
This program is represented in the Department’s constrained $770 million ten-year<br />
capital program. The program includes $60 million per year in STIP funds and $170<br />
million in Transportation Congestion Relief Program (TCRP) funds.<br />
CAPITAL PROGRAM FUNDING<br />
To date, over $2.8 billion has either been invested or reserved for capital funding for<br />
<strong>California</strong> intercity rail passenger service. The <strong>State</strong> has provided about 62 percent of<br />
Executive Summary <strong>California</strong> <strong>State</strong> <strong>Rail</strong> <strong>Plan</strong> <strong>2005</strong>-<strong>06</strong> <strong>to</strong> <strong>2015</strong>-<strong>16</strong> 3
the <strong>to</strong>tal investment and local entities, the Federal government, Amtrak, and the private<br />
railroads have also made major contributions.<br />
However, adequate <strong>State</strong> funding is not projected <strong>to</strong> be available <strong>to</strong> fund the<br />
unconstrained capital program. The only ongoing capital funding source is a limited<br />
portion of the STIP. The lack of a stable and adequate funding source for the capital<br />
program is a major concern and the Department will continue <strong>to</strong> explore mechanisms<br />
for stable funding. <strong>Rail</strong> equipment does not have access <strong>to</strong> the <strong>State</strong> Highway Account<br />
(SHA) funding in the STIP because Article XIX of the <strong>State</strong> Constitution prevents rail<br />
equipment from being funded by the SHA.<br />
INTERCITY RAIL ROLLING STOCK PROGRAM<br />
The <strong>State</strong> has an intercity rail rolling s<strong>to</strong>ck program unparalleled by any other state<br />
in the nation. The <strong>State</strong> owns its own fleet of 88 cars and 17 locomotives and has<br />
spent over $300 million on the design and acquisition of cars and locomotives since<br />
the early 1990s with the majority of funding from bonds. In addition <strong>to</strong> equipment<br />
procurement, the Equipment Program also includes warranty, rework, and modification<br />
of procured equipment; scheduled maintenance; heavy equipment overhaul; equipment<br />
modernization; inspection and safety moni<strong>to</strong>ring; and rehabilitation of damaged<br />
equipment.<br />
RAIL-HIGHWAY GRADE CROSSING IMPROVEMENT<br />
AND SEPARATION PROGRAMS<br />
The Department has a number of programs <strong>to</strong> improve safety at rail-highway grade<br />
crossings as well as improve rail and road operations. The Federal Section 1010/1103<br />
Program and the Federal Section 130 Program focus on improving safety and<br />
operations at grade crossings. The <strong>State</strong> Section 190 Program focuses on constructing<br />
grade separations. These programs combined receive, in general, approximately<br />
$35 million a year in funds.<br />
Chapter III–Operations Program<br />
OPERATIONS PROGRAM GOALS<br />
• Provide cost-effective service that will reach or exceed the Department’s 50 percent<br />
farebox ratio standard.<br />
• Provide safe, reliable, and convenient intercity rail and connecting bus service with<br />
enough schedule flexibility <strong>to</strong> meet a wide range of traveler’s needs.<br />
• Increase service attractiveness and cus<strong>to</strong>mer satisfaction through improved on-time<br />
performance, operations, and service amenities.<br />
• Create a “seamless” network where intercity rail services and schedules are well<br />
connected <strong>to</strong> commuter and urban rail, and transit.<br />
TEN-YEAR INTERCITY RAIL SERVICE LEVELS AND<br />
FINANCIAL PLAN<br />
This chapter presents the Department’s ten-year proposed intercity passenger rail<br />
ridership and service levels; projected revenue, expense, and farebox ratio for existing<br />
routes; and projected state costs for existing and new routes. In developing increased<br />
4 Executive Summary <strong>California</strong> <strong>State</strong> <strong>Rail</strong> <strong>Plan</strong> <strong>2005</strong>-<strong>06</strong> <strong>to</strong> <strong>2015</strong>-<strong>16</strong>
service levels, service extensions, and new services the Department considers:<br />
• Ridership demand based on actual train ridership, or in the case of extensions or<br />
new routes, based on bus ridership and overall travel demand in the corridor.<br />
• Improved cost-effectiveness of existing services, and positive cost-effectiveness of<br />
new routes.<br />
• Feasibility of increased service based on route capacity, equipment availability, and<br />
infrastructure quality.<br />
• Local support for the service.<br />
Also, the Department’s progress in meeting principal route objectives is assessed. Actual<br />
results and future objectives in the prior <strong>California</strong> <strong>State</strong> <strong>Rail</strong> <strong>Plan</strong> are compared with<br />
those in the current <strong>State</strong> <strong>Rail</strong> <strong>Plan</strong>.<br />
OPERATIONS PROGRAM<br />
The operations, marketing, and capital programs are all interrelated. The Operations<br />
Program includes operational efficiency which is heavily dependent on capital improvements<br />
and also includes schedule planning and cost and revenue analysis. The<br />
Department is continually working <strong>to</strong> improve on-board and station amenities and<br />
passenger information. All three routes have connecting Amtrak bus service, with the<br />
San Joaquins including an extensive network of buses that is an essential element of the<br />
Route. Improving multi-modal connectivity <strong>to</strong> the routes is also an important focus of<br />
operations.<br />
Chapter IV–Marketing Program<br />
MARKETING PROGRAM GOALS<br />
• Establish a position for <strong>California</strong> train travel in consumers’ minds. Market rail<br />
travel as fun, easy-<strong>to</strong>-use, relevant <strong>to</strong> travel needs - in short “Travel made simple.”<br />
• Emphasize Amtrak’s everyday low fares and implement fare promotion campaigns.<br />
• Develop ridership in specific primary target markets, such as the “mature market”<br />
(persons over 50), families, and Hispanic persons. Secondary markets include<br />
business travelers and college students.<br />
• Promote important recent improvements <strong>to</strong> the corridors.<br />
• Work with local agencies <strong>to</strong> market special events where train travel is an option.<br />
• Promote new train and feeder bus services.<br />
DEPARTMENT’S MARKETING PROGRAM<br />
The Marketing Program has a number of components. Advertising is a joint program<br />
with Amtrak and focuses on the “Travel made simple” concept. Public Relations/<br />
Outreach includes special promotions, media relations, printed materials, and<br />
special events. There are group travel programs for kids, seniors, and students. The<br />
Department coordinates its rail safety activities with <strong>California</strong> Operation Lifesaver, and<br />
contracts for market research. The Capi<strong>to</strong>l Corridor Joint Powers Agency (CCJPA) has its<br />
own marketing program, which includes a combination of grassroots local marketing<br />
efforts and broad-based joint media campaigns. The CCJPA coordinates its marketing<br />
efforts with the <strong>State</strong>, Amtrak, and CCJPA member agencies.<br />
Executive Summary <strong>California</strong> <strong>State</strong> <strong>Rail</strong> <strong>Plan</strong> <strong>2005</strong>-<strong>06</strong> <strong>to</strong> <strong>2015</strong>-<strong>16</strong> 5
San Francisco<br />
Paso Robles<br />
Atascadero<br />
Cal Poly<br />
San Luis Obispo<br />
Grover Beach<br />
Guadalupe<br />
Salinas<br />
Santa Maria<br />
Surf<br />
Lompoc<br />
Buell<strong>to</strong>n<br />
Solvang<br />
Goleta<br />
Oakland<br />
King City<br />
San Jose<br />
Pacific<br />
Surfliner<br />
Corridor<br />
Santa Barbara<br />
Carpinteria<br />
Ventura<br />
Oxnard<br />
Camarillo<br />
Moorpark<br />
San Juan Capistrano<br />
San Clemente<br />
Oceanside<br />
Bakersfield<br />
Simi Valley<br />
Newhall<br />
Chatsworth<br />
Van Nuys<br />
Burbank<br />
Airport<br />
Glendale<br />
Los Angeles<br />
San Pedro<br />
Long Beach<br />
Fuller<strong>to</strong>n<br />
Anaheim<br />
Santa Ana<br />
Irvine<br />
Chapter V–The <strong>California</strong> <strong>Rail</strong> Network<br />
THE STATE’S ROLE IN RAIL PASSENGER SERVICE<br />
The <strong>State</strong> rail system combines intercity, commuter, and freight rail. Intercity rail<br />
includes <strong>State</strong>-supported corridor routes and Amtrak long-distance routes. All three<br />
systems share the same infrastructure that is generally owned by private railroads,<br />
and in some cases, public entitites. The <strong>State</strong> <strong>Rail</strong> <strong>Plan</strong> focuses on these rail systems<br />
because they share the same infrastructure. The <strong>State</strong> supports: the Pacific Surfliner<br />
operating between San Diego and San Luis Obispo, the San Joaquin between Bay Area/<br />
Sacramen<strong>to</strong> and Bakersfield, and the Capi<strong>to</strong>l Corridor between San Jose and Auburn.<br />
Services intended <strong>to</strong> meet primarily local needs are developed as commuter and urban<br />
rail services rather than intercity. In <strong>California</strong>, Amtrak currently operates all statesupported<br />
intercity rail service under the provisions of the Federal <strong>Rail</strong> Passenger<br />
Service Act (49 U.S.C. 24101).<br />
Chapter VI–Pacific Surfliner Route<br />
SAN LUIS OBISPO-SANTA BARBARA-LOS ANGELES-SAN DIEGO<br />
PRINCIPAL <strong>2005</strong>-<strong>06</strong> TO <strong>2015</strong>-<strong>16</strong> ROUTE OBJECTIVES:<br />
Improve on-time performance <strong>to</strong> 90 percent by <strong>2015</strong>-<strong>16</strong>.<br />
Improve passenger comfort, convenience, and information with improved<br />
services on-board and at stations.<br />
Improve intermodal connectivity:<br />
• Cross-ticketing and coordinated schedules with Metrolink and Coaster.<br />
• Improved coordination with urban transit.<br />
• Improved Amtrak Thruway service.<br />
Reduce Travel Times:<br />
• San Diego <strong>to</strong> Los Angeles - 2 hours, 30 minutes (15 minute reduction).<br />
• Los Angeles <strong>to</strong> San Luis Obispo - 5 hours, 8 minutes (20 minute reduction).<br />
Increase annual ridership 40 percent from 2,578,000 <strong>to</strong> 3,611,000.<br />
Increase annual revenues 60 percent from $28.4 million <strong>to</strong> $45.4 million for the<br />
state-supported 70 percent of the Route.<br />
Increase revenue/cost (farebox) ratio from 58.0 percent <strong>to</strong> 65.0 percent.<br />
Increase Service Frequency:<br />
• From 11 <strong>to</strong> 13 daily round-trips between San Diego–Los Angeles.<br />
• From 5 <strong>to</strong> 6 daily round-trips between Los Angeles–Santa Barbara.<br />
• From 2 <strong>to</strong> 3 daily round-trips between Santa Barbara–San Luis Obispo.<br />
Extend Service:<br />
• San Francisco–San Luis Obispo, first daily round-trip in 2007-08, second daily<br />
round-trip in 2013-14.<br />
Solana Beach<br />
San Diego<br />
6 Executive Summary <strong>California</strong> <strong>State</strong> <strong>Rail</strong> <strong>Plan</strong> <strong>2005</strong>-<strong>06</strong> <strong>to</strong> <strong>2015</strong>-<strong>16</strong>
Eureka<br />
Arcata<br />
Fortuna<br />
Scotia<br />
RECENT PERFORMANCE:<br />
In FFY 2004-05, ridership for all trains was 2,520,000 and the farebox ratio was<br />
57.1 percent. On-time performance averaged 72.9 percent.<br />
PROPOSED TRAIN SERVICE EXPANSION:<br />
2009-10 Los Angeles–San Diego, twelfth round-trip.<br />
2012-13 Los Angeles–San Diego, thirteenth round-trip.<br />
2013-14 Los Angeles–Goleta, sixth round-trip.<br />
Goleta–San Luis Obispo, third round-trip.<br />
Chapter VII–San Joaquin Route<br />
BAY AREA/SACRAMENTO-FRESNO-BAKERSFIELD-(L.A.)<br />
PRINCIPAL <strong>2005</strong>-<strong>06</strong> TO <strong>2015</strong>-<strong>16</strong> ROUTE OBJECTIVES:<br />
Improve on-time performance <strong>to</strong> 90 percent by <strong>2015</strong>-<strong>16</strong>.<br />
Improve passenger comfort, convenience, and information with improved<br />
services on-board and at stations.<br />
Improve intermodal connectivity:<br />
• Improved coordination with urban transit.<br />
• Improved Amtrak Thruway service.<br />
Reduce Travel Times:<br />
• Oakland <strong>to</strong> Bakersfield 5 hours, 51 minutes (20 minute reduction).<br />
• Sacramen<strong>to</strong> <strong>to</strong> Bakersfield 5 hours, 5 minutes (14 minute reduction).<br />
Increase annual ridership 47 percent from 773,000 <strong>to</strong> 1,133,000.<br />
Increase annual revenues 70 percent from $23.9 million <strong>to</strong> $40.7 million.<br />
Increase revenue/cost (farebox) ratio from 46.8 percent <strong>to</strong> 49.1 percent.<br />
Increase Service Frequency:<br />
• From 4 <strong>to</strong> 5 daily round-trips between Oakland <strong>to</strong> Bakersfield.<br />
• From 2 <strong>to</strong> 3 daily round-trips between Sacramen<strong>to</strong> <strong>to</strong> Bakersfield.<br />
Expand Service:<br />
• Study options <strong>to</strong> extend rail service from S<strong>to</strong>ck<strong>to</strong>n <strong>to</strong> Oakland and from Bakersfield<br />
<strong>to</strong> Los Angeles.<br />
RECENT PERFORMANCE:<br />
In FFY 2004-05, ridership for all trains was 756,000 and the farebox ratio was<br />
45.9 percent. On-time performance averaged 63.5 percent.<br />
PROPOSED TRAIN SERVICE EXPANSION:<br />
2010-11 Bakersfield-Sacramen<strong>to</strong>, third daily round-trip from S<strong>to</strong>ck<strong>to</strong>n <strong>to</strong> Sacramen<strong>to</strong><br />
(seventh round-trip on route).<br />
2014-15 Bakersfield-Oakland, fifth daily round-trip from S<strong>to</strong>ck<strong>to</strong>n <strong>to</strong> Oakland (eighth<br />
round-trip on route).<br />
Vallejo<br />
Richmond-BART<br />
San Francisco<br />
Martinez<br />
Oakland<br />
Emeryville<br />
Monterey<br />
Santa Cruz<br />
Paso Robles<br />
San Luis Obispo<br />
Grover Beach<br />
Santa Maria<br />
Cloverdale<br />
Healdsburg<br />
Santa Rosa<br />
Rohnert Park<br />
Petaluma<br />
Salinas<br />
Atascadero<br />
Great America<br />
San Jose<br />
Santa Barbara<br />
Legett<br />
Napa<br />
Antioch<br />
Dublin-BART<br />
Livermore-ACE<br />
Kettleman<br />
City<br />
Garberville<br />
Lay<strong>to</strong>nville<br />
Willits<br />
Ukiah<br />
Hollister<br />
San Juan<br />
Bautista<br />
San<br />
Joaquin<br />
Corridor<br />
Carpinteria<br />
Ventura<br />
Oxnard<br />
Santa Paula<br />
Fillmore<br />
Simi Valley<br />
Chatsworth<br />
Van Nuys<br />
Burbank<br />
Tracy<br />
Glendale<br />
Los Angeles<br />
San Pedro<br />
Long Beach<br />
Los<br />
Banos<br />
Davis<br />
Merced<br />
Lemoore<br />
Hanford<br />
Corcoran<br />
Wasco<br />
Sacramen<strong>to</strong><br />
Newhall<br />
Pasadena<br />
Lodi<br />
Modes<strong>to</strong><br />
Turlock-Denair<br />
Madera<br />
San Juan Capistrano<br />
San Clemente<br />
Oceanside<br />
Roseville<br />
S<strong>to</strong>ck<strong>to</strong>n-ACE<br />
S<strong>to</strong>ck<strong>to</strong>n<br />
La Crescenta<br />
Fuller<strong>to</strong>n<br />
Anaheim<br />
Santa Ana<br />
Irvine<br />
Fresno<br />
Corning<br />
Bakersfield<br />
Red Bluff<br />
Lancaster<br />
Palmdale<br />
Claremont<br />
Chico<br />
Auburn<br />
Rocklin<br />
Littlerock<br />
Redding<br />
Oroville<br />
Marysville<br />
Mariposa<br />
Goshen Jct.<br />
Visalia<br />
Tehachapi<br />
Mojave<br />
Rosamond<br />
Adelan<strong>to</strong> Jct.<br />
Nev<br />
Grass Va<br />
Colfax<br />
Cameron Park<br />
Placerville<br />
Midpines<br />
El<br />
Bor<br />
Vic<strong>to</strong>rville<br />
Ontario<br />
San<br />
Bernardino<br />
Riverside<br />
Moreno Valley<br />
Perris<br />
Hemet<br />
Beaumont<br />
Pa<br />
Solana Beach<br />
Executive Summary <strong>California</strong> <strong>State</strong> <strong>Rail</strong> <strong>Plan</strong> <strong>2005</strong>-<strong>06</strong> <strong>to</strong> <strong>2015</strong>-<strong>16</strong> San Diego<br />
7<br />
P<br />
De
Healdsburg<br />
Santa Rosa<br />
Rohnert Park<br />
Petaluma<br />
Vallejo<br />
Suisun<br />
Richmond-BART<br />
San Francisco Berkeley<br />
Martinez<br />
Oakland<br />
Emeryville<br />
Santa Cruz<br />
Hayward<br />
Fremont<br />
Great America<br />
San Jose<br />
Napa<br />
Davis<br />
Sacramen<strong>to</strong><br />
Roseville<br />
Capi<strong>to</strong>l<br />
Corridor<br />
Oroville<br />
Marysville<br />
Auburn<br />
Rocklin<br />
Nevada City<br />
Grass Valley<br />
Colfax<br />
Cameron Park<br />
Placerville<br />
Truckee<br />
Tahoe<br />
Wye<br />
Soda Springs<br />
<strong>State</strong>line, NV<br />
Carson City, NV<br />
Reno, NV<br />
Sparks, NV<br />
Salinas<br />
Paso Robles<br />
San Luis Obispo<br />
Grover Beach<br />
Santa Maria<br />
Solvang<br />
Santa Barbara<br />
Chapter VIII–The Capi<strong>to</strong>l Corridor<br />
AUBURN-SACRAMENTO-OAKLAND-SAN JOSE<br />
PRINCIPAL <strong>2005</strong>-<strong>06</strong> TO <strong>2015</strong>-<strong>16</strong> ROUTE OBJECTIVES:<br />
Maintain on-time performance at 90 percent throughout the ten-year period.<br />
Enhance cus<strong>to</strong>mer satisfaction.<br />
Improve intermodal connectivity:<br />
• Establish transfer agreements and coordinated schedules with all local transit<br />
systems.<br />
• Participate in the Bay Area’s TransLink program.<br />
Reduce Travel Times by up <strong>to</strong> 12 percent.<br />
Increase annual ridership 88 percent from 1,323,000 <strong>to</strong> 2,483,000.<br />
Increase annual revenues 86 percent from $<strong>16</strong>.0 million <strong>to</strong> $29.8 million.<br />
Increase revenue/cost (farebox) ratio from 38.9 percent <strong>to</strong> 44.6 percent.<br />
Increase Service Frequency:<br />
• From 12 <strong>to</strong> 18 daily round-trips between Oakland and Sacramen<strong>to</strong>.<br />
• From 4 <strong>to</strong> <strong>16</strong> daily round-trips between San Jose and Oakland.<br />
• From 1 <strong>to</strong> 8 daily round-trips between Sacramen<strong>to</strong> and Roseville.<br />
• From 1 <strong>to</strong> 4 daily round-trips between Roseville and Auburn.<br />
Expand Service:<br />
• Sacramen<strong>to</strong>-Reno–first daily round-trip in 2008-09, second in 2010-11.<br />
• Support Auburn-Oakland Regional <strong>Rail</strong> Service commuter system planning.<br />
• Coordinate with Caltrain in the Dumbar<strong>to</strong>n <strong>Rail</strong> corridor commuter expansion.<br />
RECENT PERFORMANCE:<br />
In FFY 2004-05, ridership for all trains was 1,260,000 and the farebox ratio was<br />
38.7 percent. On-time performance averaged 84.7 percent.<br />
PROPOSED TRAIN SERVICE EXPANSION:<br />
20<strong>06</strong>-07 San Jose-Oakland, fifth, sixth and seventh round-trips. Sacramen<strong>to</strong>-Roseville,<br />
second and third round-trips. Roseville-Auburn, second round-trip.<br />
8 Executive Summary <strong>California</strong> <strong>State</strong> <strong>Rail</strong> <strong>Plan</strong> <strong>2005</strong>-<strong>06</strong> <strong>to</strong> <strong>2015</strong>-<strong>16</strong>
2008-09 San Jose-Oakland, eighth and ninth round-trips. Oakland-Sacramen<strong>to</strong>,<br />
thirteenth and fourteenth round-trips.<br />
2010-11 San Jose-Oakland, tenth and eleventh round-trips. Oakland-Sacramen<strong>to</strong>,<br />
fifteenth and sixteenth round-trips. Sacramen<strong>to</strong>-Roseville, fourth roundtrip.<br />
Auburn-Oakland, third round-trip.<br />
2012-13 San Jose-Oakland, twelfth and thirteenth round-trips. Oakland-<br />
Sacramen<strong>to</strong>, seventeenth and eighteenth round-trips. Sacramen<strong>to</strong>-Roseville,<br />
fifth and sixth round-trips. Roseville-Auburn, fourth round-trip.<br />
2014-15 San Jose–Oakland, fourteenth, fifteenth, and sixteenth round-trips.<br />
Sacramen<strong>to</strong>-Roseville, seventh and eighth round-trips.<br />
Chapter IX–Commuter <strong>Rail</strong> Services<br />
COASTER COMMUTER RAIL (OCEANSIDE–SAN DIEGO)<br />
PRINCIPAL <strong>2005</strong>-<strong>06</strong> TO <strong>2015</strong>-<strong>16</strong> ROUTE OBJECTIVES:<br />
• Increase ridership and improve mobility in the region.<br />
• Implement timed transfers at various stations and transit centers.<br />
• Initiate and continue implementation of the Cus<strong>to</strong>mer Amenities Program.<br />
• Implement incremental service increases, if feasible, including: supplementary midday<br />
service, reverse peak service, evening service, and weekend service.<br />
• Construct Oceanside passing track.<br />
• Construct new mainline track between O’Neil and Flores.<br />
• Replace single-track San Diegui<strong>to</strong> River and Santa Margarita bridges with new twotrack<br />
concrete bridges.<br />
• Replace other timber bridges with new concrete bridges.<br />
• Upgrade sidings and add second main track segments.<br />
• Continue stabilization of Del Mar Bluffs.<br />
• Construct new parking garage at Oceanside Transit Center.<br />
• Extend platforms at Old Town and Poinsettia Stations.<br />
• Build 500-space parking structure at Solana Beach Station for mixed-use<br />
development.<br />
METROLINK COMMUTER RAIL (LOS ANGELES, ORANGE,<br />
RIVERSIDE, SAN BERNARDINO, AND VENTURA COUNTIES)<br />
PRINCIPAL <strong>2005</strong>-<strong>06</strong> TO <strong>2015</strong>-<strong>16</strong> ROUTE OBJECTIVES:<br />
• Improve cus<strong>to</strong>mer service and accessibility.<br />
• Improve integration with other transit modes.<br />
• Purchase 43 <strong>to</strong> 66 new rail cars.<br />
• Initiate a study of Sealed Corridor safety improvements on SCRRA-owned lines.<br />
• Complete systemwide rail line rehabilitation/renovation projects.<br />
• Design and construct Eastern Area maintenance facility.<br />
• Perform various projects <strong>to</strong> improve system performance.<br />
(continued)<br />
Executive Summary <strong>California</strong> <strong>State</strong> <strong>Rail</strong> <strong>Plan</strong> <strong>2005</strong>-<strong>06</strong> <strong>to</strong> <strong>2015</strong>-<strong>16</strong> 9
V E N T U R A<br />
Montalvo<br />
Oxnard<br />
Moorpark<br />
Camarillo<br />
Santa<br />
Clarita<br />
Simi<br />
Valley<br />
Chatsworth<br />
Northridge<br />
Via Princessa<br />
Newhall<br />
Metrolink<br />
Lancaster<br />
Palmdale<br />
Vincent Grade/Ac<strong>to</strong>n<br />
L O S<br />
A N G E L E S<br />
Burbank-Bob Hope Airport<br />
Van Burbank<br />
Pomona North Fontana<br />
Nuys<br />
Cal<br />
<strong>State</strong> El Covina<br />
Glendale LA Monte<br />
Los Angeles<br />
Pomona<br />
E. Ontario<br />
Industry<br />
Commerce Montebello<br />
Norwalk/<br />
Santa Fe Springs<br />
Fuller<strong>to</strong>n<br />
Anaheim<br />
Orange<br />
Santa Ana<br />
Tustin<br />
Irvine<br />
S A N<br />
B E R N A R D I N O<br />
N. Main Corona<br />
R I V E R S I D E<br />
O R A N G E<br />
Laguna Miguel/<br />
Mission Viejo<br />
San Bernardino<br />
Riverside<br />
San Juan Capistrano<br />
San Clemente<br />
S A N<br />
D I E G O<br />
Southern<br />
<strong>California</strong><br />
Commuter<br />
<strong>Rail</strong><br />
Coaster<br />
Oceanside<br />
Carlsbad Village<br />
Encinitas<br />
Solana Beach<br />
Sorren<strong>to</strong> Valley<br />
Old Town<br />
San Diego<br />
• Purchase and rebuild used locomotives.<br />
• Install Lincoln Avenue double track.<br />
• Construct fifth lead track at Los Angeles Union Station.<br />
• Construct new rolling s<strong>to</strong>ck s<strong>to</strong>rage facility at Keller Street in Los Angeles.<br />
• Implement Perris Valley extension, Redlands extension, Santa Paula branch line, and<br />
Fuller<strong>to</strong>n-Laguna Niguel/Mission Viejo service enhancements.<br />
10<br />
Executive Summary <strong>California</strong> <strong>State</strong> <strong>Rail</strong> <strong>Plan</strong> <strong>2005</strong>-<strong>06</strong> <strong>to</strong> <strong>2015</strong>-<strong>16</strong>
CALTRAIN COMMUTER RAIL (SAN FRANCISCO–GILROY)<br />
PRINCIPAL <strong>2005</strong>-<strong>06</strong> TO <strong>2015</strong>-<strong>16</strong> ROUTE OBJECTIVES:<br />
• Evaluate and fine-tune the newly inaugurated Baby Bullet service.<br />
• Increase parking at stations impacted by initiation of Baby Bullet service.<br />
• Increase employer bus shuttles as demand grows.<br />
• Implement Translink regional ticketing system.<br />
• Reduce costs and gain productivity and performance through au<strong>to</strong>mated ticket<br />
purchasing and track and system capital improvements.<br />
• <strong>Plan</strong> and design service extensions <strong>to</strong> down<strong>to</strong>wn San Francisco, across the<br />
Dumbar<strong>to</strong>n Bridge, and <strong>to</strong> Salinas.<br />
• Complete Centralized Maintenance Facility.<br />
• Improve operations capacity at targeted stations and other route locations, including<br />
outside boarding platforms and additional crossovers.<br />
• Complete cus<strong>to</strong>mer service improvements, including improved station access, and<br />
amenities at selected stations.<br />
• Improve right-of-way by designing various grade separations in San Mateo County,<br />
and rehabilitate bridges, culverts, tracks, and tunnels.<br />
• Prepare design plans, specifications and estimates <strong>to</strong> electrify the route between<br />
San Francisco and Gilroy.<br />
• Implement Dumbar<strong>to</strong>n and Salinas extensions.<br />
ALTAMONT COMMUTER EXPRESS (STOCKTON–SAN JOSE)<br />
PRINCIPAL <strong>2005</strong>-<strong>06</strong> TO <strong>2015</strong>-<strong>16</strong> ROUTE OBJECTIVES:<br />
• Continue service improvements.<br />
• Improve on-time performance.<br />
• Increase ridership on existing routes.<br />
• Improve service coordination with other service providers such as BART, Caltrain,<br />
Capi<strong>to</strong>l Corridor, and shuttle service providers.<br />
• Acquire right-of-way, perform engineering work, and begin construction of rail<br />
maintenance and layover facility in San Joaquin County.<br />
• Upgrade signal system between S<strong>to</strong>ck<strong>to</strong>n and Fremont.<br />
(continued)<br />
Executive Summary <strong>California</strong> <strong>State</strong> <strong>Rail</strong> <strong>Plan</strong> <strong>2005</strong>-<strong>06</strong> <strong>to</strong> <strong>2015</strong>-<strong>16</strong><br />
11
M A R I N<br />
S O L A N O<br />
S A N<br />
J O A Q U I N<br />
C O N T R A<br />
S<strong>to</strong>ck<strong>to</strong>n ACE<br />
San<br />
Francisco<br />
Caltrain<br />
Millbrae<br />
C O S T A<br />
Pleasan<strong>to</strong>n<br />
A L A M E D A<br />
Fremont-Centerville<br />
Vasco<br />
Livermore<br />
A<br />
Lathrop-Manteca<br />
ACE<br />
Tracy<br />
Northern<br />
<strong>California</strong><br />
Commuter<br />
<strong>Rail</strong><br />
Redwood City<br />
S A N<br />
M A T E O<br />
Palo Al<strong>to</strong><br />
Mountain View<br />
Sunnyvale<br />
Great America<br />
Santa Clara<br />
San Jose<br />
Tamien<br />
Capi<strong>to</strong>l<br />
S A N T A<br />
C L A R A<br />
Blossom Hill<br />
Morgan Hill<br />
San Martin<br />
Gilroy<br />
S T A N I S L A U S<br />
• Replace ties between Niles Junction and Santa Clara.<br />
• Upgrade diamond at Lyoth and replace switch at Hunter Street.<br />
• Upgrade passenger cars and locomotives.<br />
• Evaluate potential extensions and new services in the Central Valley.<br />
PROPOSED COMMUTER RAIL ROUTES<br />
VENTURA AND SANTA BARBARA COMMUTER RAIL SERVICE<br />
The Department has expanded its LOSSAN North Strategic <strong>Plan</strong> <strong>to</strong> study the potential for<br />
commuter rail service in Ventura and Santa Barbara Counties.<br />
SONOMA-MARIN AREA RAIL TRANSIT (SMART)<br />
SMART is planning service in a 70-mile corridor from Cloverdale <strong>to</strong> the Larkspur Ferrry<br />
Terminal on existing track.<br />
AUBURN-OAKLAND REGIONAL RAIL SERVICE<br />
Six agencies have partnered <strong>to</strong> develop a service concept plan for a new regional<br />
commuter rail service extending from Auburn <strong>to</strong> Oakland that would be integrated with<br />
the Capi<strong>to</strong>l Corridor.<br />
12 Executive Summary <strong>California</strong> <strong>State</strong> <strong>Rail</strong> <strong>Plan</strong> <strong>2005</strong>-<strong>06</strong> <strong>to</strong> <strong>2015</strong>-<strong>16</strong>
Chapter X–Potential New Services<br />
PROPOSED INTERCITY RAIL ROUTES<br />
The Department proposes four routes for service in the ten-year period.<br />
• Down<strong>to</strong>wn San Francisco <strong>to</strong> San Luis Obispo (and Los Angeles) via Coast Route.<br />
One round-trip between San Francisco and San Luis Obispo, starting in 2007-08,<br />
with a second round-trip in 2013-14.<br />
• Sacramen<strong>to</strong> <strong>to</strong> Reno. Extension of one round-trip of the Capi<strong>to</strong>l Corridor from<br />
Sacramen<strong>to</strong> <strong>to</strong> Reno/Sparks in 2008-09, and a second round-trip in 2010-11.<br />
• Sacramen<strong>to</strong> <strong>to</strong> Redding. One round-trip between Sacramen<strong>to</strong> and Redding in<br />
2009-10, with a second round-trip starting in 2013-14.<br />
• Los Angeles <strong>to</strong> Coachella Valley. One round-trip between Los Angeles and Indio in<br />
2010-11 and a second round-trip in 2013-14.<br />
The chapter also discusses potential intercity rail service from San Francisco <strong>to</strong><br />
Monterey and from Los Angeles <strong>to</strong> Las Vegas.<br />
HIGH-SPEED RAIL<br />
<strong>California</strong> High-Speed <strong>Rail</strong> Authority<br />
In 1996, The <strong>California</strong> High-Speed <strong>Rail</strong> Act established the <strong>California</strong> High-Speed<br />
<strong>Rail</strong> Authority (CHSRA) <strong>to</strong> direct the development and implementation of intercity<br />
high-speed rail service. In 2000, the CHSRA completed its Business <strong>Plan</strong>, “Building a<br />
High-Speed Train System for <strong>California</strong>.” The CHSRA certified the Final Environmental<br />
Impact Report/Environmental Impact Study (FEIR/EIS) on November 2, <strong>2005</strong>. The<br />
FEIR/EIS identifies a high-speed train system as the preferred system alternative <strong>to</strong> meet<br />
<strong>California</strong>’s future intercity travel demand. Service <strong>to</strong> urban centers would be on shared<br />
tracks with other passenger rail services at moderate speeds. Stations would be in close<br />
proximity <strong>to</strong> most major airports, and there would be station connections with major<br />
transit hubs in metropolitan areas. The FEIR/EIS identifies preferred alignments.<br />
13
MAGNETIC LEVITATION<br />
Southern <strong>California</strong> Maglev Project<br />
The Southern <strong>California</strong> Maglev Project’s initial operating segment that is under<br />
development extends 54 miles from West Los Angeles <strong>to</strong> the Ontario Airport. The<br />
Southern <strong>California</strong> Association of Governments (SCAG) is the project sponsor.<br />
Additional feasibility studies are focusing on other heavily congested corridors in the<br />
SCAG region.<br />
Las Vegas–Anaheim Maglev Project<br />
The <strong>California</strong>-Nevada Super Speed Train Commission was formed in 1988 <strong>to</strong> promote<br />
the development of a 269-mile maglev system connecting Las Vegas with Anaheim, and<br />
has completed several feasibility studies on this project. With Federal funding, Nevada is<br />
undertaking environmental studies of this proposed maglev route.<br />
Chapter XI–Amtrak<br />
AMTRAK STATE–SUPPORTED SERVICE<br />
The Federal <strong>Rail</strong> Passenger Service Act authorizes Amtrak <strong>to</strong> operate intercity rail<br />
passenger service beyond its basic system services when requested <strong>to</strong> do so by a state,<br />
group of states, or a regional or local agency. In <strong>California</strong>, Amtrak operates the<br />
Pacific Surfliners, San Joaquins, and the Capi<strong>to</strong>l Corridor and the Department provides<br />
operating funding. The Department directly administers the Pacific Surfliners and San<br />
Joaquins. Since July 1998, the CCJPA has administered the Capi<strong>to</strong>l Corridor service<br />
under an interagency transfer agreement with the <strong>State</strong>.<br />
AMTRAK PLANNING<br />
In April <strong>2005</strong>, Amtrak released its Amtrak Strategic Reform Initiatives and FY <strong>06</strong> Grant<br />
Request. This document included comprehensive reform initiatives the railroad is<br />
undertaking as corporate actions and others it intends <strong>to</strong> pursue in legislative actions<br />
<strong>to</strong> “revitalize U.S. passenger rail service.” Legislative initiatives included an 80 percent<br />
Federal/20 percent state capital grant program and competition among opera<strong>to</strong>rs,<br />
including Amtrak for route operation. Amtrak’s 2004 Strategic Business <strong>Plan</strong> released in<br />
June 2004, includes $90.1 million for projects which impact <strong>California</strong>, of which<br />
$41.5 million is for projects wholly in <strong>California</strong> and $48.6 million is for multi-state<br />
projects that partially impact <strong>California</strong>.<br />
AMTRAK FFY 20<strong>06</strong> FEDERAL FUNDING<br />
In late November, <strong>2005</strong>, the President signed the Transportation and Related Agencies<br />
Appropriations Bill for FFY <strong>06</strong>. It includes $1.315 billion in funding for Amtrak.<br />
14 Executive Summary <strong>California</strong> <strong>State</strong> <strong>Rail</strong> <strong>Plan</strong> <strong>2005</strong>-<strong>06</strong> <strong>to</strong> <strong>2015</strong>-<strong>16</strong>
Chapter XII–Intercity <strong>Rail</strong> Funding<br />
FUNDING SOURCES<br />
Public Transportation Account (PTA). The PTA is the exclusive source of intercity rail<br />
operating funds and a potential source of intercity rail capital funds. The TCRP, enacted<br />
in 2000, and then Proposition 42, passed in March 2002, added additional funds <strong>to</strong> the<br />
PTA.<br />
<strong>State</strong> Highway Account (SHA). The bulk of the SHA supports the <strong>State</strong>’s highway system,<br />
but a portion of the account also supports rail projects in the STIP. In the 1996 STIP<br />
through 2002 STIP biennial cycles, $468.6 million was programmed for intercity rail<br />
projects and $331.3 million has been allocated.<br />
Traffic Congestion Relief Fund (TCRF). The program established in 2000 included<br />
$2<strong>06</strong>.5 million for specific intercity rail capital projects, of which $129.4 million has<br />
been allocated.<br />
Tribal Compact Bonds. In 2004, the issuance of bonds secured by Indian gaming<br />
revenue was authorized. Although the revenue is uncertain, the PTA could receive<br />
additional funds.<br />
<strong>State</strong> Bond Funds. In 1990 the voters approved the Passenger <strong>Rail</strong> and Clean Air Bond<br />
Act (Proposition 108), which provided $1 billion in rail bonds, including $225 million<br />
for intercity rail capital projects. The Clean Air and Transportation Improvement Act<br />
of 1990 (Proposition 1<strong>16</strong>) provided a $1.99 billion one-time source of funding for rail<br />
and transit projects, including about $382 million for intercity rail passenger capital<br />
projects. Most of these bond funds have been allocated.<br />
<strong>State</strong> General Funds. The 1999-00 and 2000-01 <strong>State</strong> Budgets provided General Fund<br />
money for intercity rail capital projects. The 1999-00 and 2000-01 Budgets included<br />
$17.5 million and $30 million respectively for new intercity rail rolling s<strong>to</strong>ck.<br />
Local Funds. Although intercity rail passenger services are funded primarily by the<br />
<strong>State</strong>, a substantial amount of local funds have also been invested, mainly on the Pacific<br />
Surfliner Route, <strong>to</strong> fund commuter rail development. Further, intercity rail stations are<br />
often owned by cities and funded with local funds in addition <strong>to</strong> STIP funding.<br />
Federal Funds. Federal transportation funds from various programs benefit<br />
intercity rail service, particularly through station projects. However, Federal flexible<br />
transportation funds, like those provided through the Surface Transportation Program,<br />
are generally not available for intercity rail projects.<br />
Amtrak Funds. Amtrak develops and funds certain <strong>California</strong> intercity rail capital<br />
projects. The largest investment has been for maintenance facilities and rolling s<strong>to</strong>ck,<br />
including the purchase of 40 new passenger cars and 14 locomotives for the Pacific<br />
Surfliner Corridor at a cost of about $135 million.<br />
<strong>Rail</strong>road Funds. The <strong>State</strong> and the railroads owning the right-of-way of intercity rail<br />
passenger routes sometimes share in the cost of track and signal improvement projects.<br />
Executive Summary <strong>California</strong> <strong>State</strong> <strong>Rail</strong> <strong>Plan</strong> <strong>2005</strong>-<strong>06</strong> <strong>to</strong> <strong>2015</strong>-<strong>16</strong> 15
Chapter XIII–Environment and Land Use<br />
ENVIRONMENTAL GOALS<br />
By 20<strong>16</strong>, as the result of intercity rail travel:<br />
Congestion Relief–cut annual vehicle miles traveled in the <strong>State</strong> by a <strong>to</strong>tal of<br />
433 million miles (a net reduction of 178 million vehicle miles traveled compared with<br />
<strong>2005</strong>).<br />
Travel Mode Share–increase the intercity rail mode share by 2 1⁄2 <strong>to</strong> 3 times.<br />
Air Quality:<br />
• Continue <strong>to</strong> cause a net annual decrease in pollution from hydrocarbons and carbon<br />
monoxide in the <strong>State</strong>.<br />
• Continue <strong>to</strong> keep emissions below <strong>State</strong> and Federal maximum allowable levels<br />
for all pollutants, and pursue funding for research and development in<strong>to</strong> cleaner<br />
locomotive engines.<br />
Energy Efficiency–save the <strong>State</strong> a net of almost 11 million gallons of gasoline<br />
annually.<br />
LAND USE<br />
The Department supports efforts by cities and counties <strong>to</strong> promote transit-oriented<br />
development projects near Amtrak stations that enhance community livability by<br />
providing housing options, jobs, retail, and services within easy walking distance of the<br />
station. Recent or planned transit-oriented developments at 12 key Amtrak stations are<br />
described.<br />
PROGRESS IN MEETING ENVIRONMENTAL AND<br />
LAND USE GOALS<br />
The Department’s progress in meeting its environmental and land use goals is assessed<br />
for both current years and future years.<br />
<strong>16</strong><br />
Executive Summary <strong>California</strong> <strong>State</strong> <strong>Rail</strong> <strong>Plan</strong> <strong>2005</strong>-<strong>06</strong> <strong>to</strong> <strong>2015</strong>-<strong>16</strong>
PART II<br />
Freight <strong>Rail</strong> Element<br />
Chapter XIV–Introduction<br />
The freight rail element of the <strong>State</strong> <strong>Rail</strong> <strong>Plan</strong> provides a detailed account of <strong>California</strong>’s<br />
freight rail system, how it operates and serves the people living in the Golden <strong>State</strong>.<br />
This document was developed as part of the <strong>State</strong>’s overall planning process <strong>to</strong><br />
provide information <strong>to</strong> transportation officials, policy makers, railroad managers,<br />
and transportation planners. The freight rail element begins with an overview of the<br />
<strong>State</strong>’s rail system. It discusses the routes operated by the Union Pacific and Burling<strong>to</strong>n<br />
Northern and Santa Fe <strong>Rail</strong>roads. The plan looks at the one regional railroad and<br />
28 short line railroads operating on 28 percent of <strong>California</strong>’s rail mileage. It points<br />
out the important role they play in moving international freight <strong>to</strong> and from <strong>California</strong>’s<br />
seaports. The plan also discusses the various types of commodities shipped by rail in<br />
and out of <strong>California</strong>.<br />
Chapter XV–Major Freight Issues<br />
Go<strong>California</strong> is the Administration’s major effort <strong>to</strong> improve mobility and accessibility<br />
for people, goods, services, and information through a safe, integrated, multimodal,<br />
world-class transportation system. A significant element of Go<strong>California</strong> is <strong>to</strong> invest in<br />
rail infrastructure in partnership with public and private sec<strong>to</strong>r interests <strong>to</strong> enhance<br />
capacity of the freight rail system. Funding critical freight rail improvements <strong>to</strong><br />
allow more goods <strong>to</strong> be shipped by rail will produce substantial public benefits from<br />
congestion relief on freeways and local roads, environmental benefits, and continued<br />
economic growth. <strong>Rail</strong> improvements are a major element of the Goods Movement<br />
Action <strong>Plan</strong> (GMAP), a statewide strategy for goods movement capacity expansion.<br />
Freight rail system improvements with substantial public benefits will be identified in<br />
the GMAP and incorporated in<strong>to</strong> the <strong>California</strong> <strong>State</strong> <strong>Rail</strong> <strong>Plan</strong>.<br />
This chapter discusses issues that impact the railroads’ ability <strong>to</strong> move freight<br />
efficiently, including: mainline choke points caused by geographic restrictions, mainline<br />
congestion caused by growth in intermodal traffic, and the sharp increase in the<br />
number of passenger trains operating on freight railroads. <strong>California</strong> Ports show a<br />
doubling of container shipments over the past ten years from seven million in 1995<br />
<strong>to</strong> 15 million in 2004. Container shipments are expected <strong>to</strong> more than double again<br />
by 2025. Capacity issues are a growing concern among <strong>California</strong>’s railroads and rail<br />
shippers.<br />
Executive Summary <strong>California</strong> <strong>State</strong> <strong>Rail</strong> <strong>Plan</strong> <strong>2005</strong>-<strong>06</strong> <strong>to</strong> <strong>2015</strong>-<strong>16</strong><br />
17
Short line railroad issues include the industry’s movement <strong>to</strong> heavier rail cars <strong>to</strong> try<br />
<strong>to</strong> keep transportation costs down and take advantage of the economies of scale. The<br />
problem is most short line railroads do not have the infrastructure <strong>to</strong> accommodate<br />
these heavier 286,000-pound rail cars. Short line railroads operate on a very tight<br />
budget and do not have the revenue base <strong>to</strong> make these major capital improvements.<br />
Without some kind of financial assistance <strong>to</strong> make these capital improvements, these<br />
shipments will have <strong>to</strong> be moved by truck at a greater cost <strong>to</strong> the shipper and an<br />
increase in highway maintenance and congestion cost <strong>to</strong> the <strong>State</strong>.<br />
<strong>Rail</strong> shipper concerns are also discussed. Their issues include: congestion at<br />
intermodal terminals, lack of equipment, lost rail cars, delays <strong>to</strong> rail shipments due <strong>to</strong><br />
increased passenger trains, and grade crossing accidents.<br />
Chapter XVI–Short Line Analysis<br />
Short line railroads play an important role in <strong>California</strong>’s overall transportation system,<br />
especially for rural communities not served by Class I railroads. There are 28 short<br />
line railroads operating on 1,697 miles or 28 percent of the <strong>State</strong>’s rail mileage. The<br />
results of a survey of <strong>California</strong>’s short line railroads are included in this section. Key<br />
issues of concern include: the inability <strong>to</strong> upgrade their infrastructure <strong>to</strong> accommodate<br />
286,000-pound rail cars on their lightweight track and bridge infrastructure, the need<br />
for improved grade crossing protection devices, and the need for the <strong>State</strong> <strong>to</strong> take a<br />
more active role in preserving rail service <strong>to</strong> rural areas of <strong>California</strong>.<br />
Commodities shipped by short lines are identified in the survey with wood products<br />
making up the largest proportion at 24 percent followed by food products at<br />
22 percent. The survey estimated upgrade costs for all <strong>California</strong> short lines using a<br />
methodology developed specifically <strong>to</strong> handle 286,000-pound cars. The <strong>to</strong>tal statewide<br />
short line upgrade cost is estimated on the order of $190 million <strong>to</strong> $210 million.<br />
Potential impacts <strong>to</strong> highway congestion and maintenance costs due <strong>to</strong> railroad closures<br />
are also discussed.<br />
Chapter XVII–Funding<br />
In 1999, <strong>California</strong> short line railroads handled over 750,000 carloads of international<br />
freight. Many <strong>California</strong> short lines serve industries along the I-5, I-10, I-40 and I-80<br />
corridors. They also provide switching services <strong>to</strong> the Ports of Los Angeles, Long Beach,<br />
Oakland, Hueneme, and S<strong>to</strong>ck<strong>to</strong>n. Short line railroads also provide services <strong>to</strong> business<br />
in the rural portions of <strong>California</strong> who would otherwise have <strong>to</strong> rely strictly on trucks <strong>to</strong><br />
move their freight.<br />
The American Association of <strong>State</strong> Highway and Transportation Officials (AASHTO)<br />
estimates that the ten-year nationwide infrastructure needs for American short lines<br />
<strong>to</strong>tal between $8 and $12 billion, of which 19 <strong>to</strong> 23 percent can be funded by the<br />
railroads themselves. Federal rail funding programs include: Local Freight <strong>Rail</strong><br />
Assistance (LFRA), Light Density Line (LDL), <strong>Rail</strong> Rehabilitation and Improvement and<br />
Financing (RRIF), Congestion Mitigation and Air Quality Improvement (CMAQ), National<br />
Coordinated <strong>Plan</strong>ning and Development (NCPD), Coordinated Border Infrastructure<br />
18<br />
Executive Summary <strong>California</strong> <strong>State</strong> <strong>Rail</strong> <strong>Plan</strong> <strong>2005</strong>-<strong>06</strong> <strong>to</strong> <strong>2015</strong>-<strong>16</strong>
(CBI), Transportation and Community System Preservation (TCSP), Highway <strong>Rail</strong><br />
Crossing (Section 130) and Transportation Infrastructure Finance Assistance (TIFA).<br />
<strong>State</strong> funding programs for railroads are examined noting that when the LDL program<br />
was not funded under TEA 21, thirty other states began or continued <strong>to</strong> provide state<br />
funds for loan or grant programs <strong>to</strong> assist short line railroads in making infrastructure<br />
improvements. Of the $2.1 billion made available <strong>to</strong> short line railroads during the<br />
period of 1976 <strong>to</strong> 1995, 28 percent was from federal grants, 40 percent was from state<br />
grants, 24 percent from local funds and eight percent from state loans.<br />
Chapter XVIII–Environmental Review<br />
Environmental issues are discussed in detail <strong>to</strong> stress the need for an integrated<br />
planning effort <strong>to</strong> better address the needs of <strong>California</strong>’s transportation system. Topics<br />
include: noise impacts, vibration, at grade highway/railroad crossing incidents, and<br />
locomotive emission air quality. The impacts <strong>to</strong> local communities from locomotive<br />
horn blowing at grade crossings are discussed as well as the US Environmental<br />
Protection Administration’s (EPA) standards for noise emissions. The Federal <strong>Rail</strong>road<br />
Administration is charged with enforcing these noise standards.<br />
Delays at railroad crossings and accidents due <strong>to</strong> the increase in train traffic are also<br />
discussed. The Alameda Corridor project eliminated 200 grade crossings improving<br />
safety and reducing traffic delays between Long Beach and Los Angeles. Locomotive<br />
emissions are discussed in detail noting the new EPA standards.<br />
Chapter XIX–New Technology<br />
Eight new technology areas are discussed:<br />
• Global positioning system applications<br />
• Positive train control<br />
• Information technology applications<br />
• Electronic commerce<br />
• Alternating current locomotive<br />
technology<br />
• Electronic braking<br />
• Increased car capacity<br />
• Rolling s<strong>to</strong>ck improvements<br />
Chapter XX–Future Needs<br />
<strong>California</strong>’s rail system is rapidly running out of capacity due <strong>to</strong> a large increase in<br />
passenger train activity as well as tremendous growth in international trade moving by<br />
rail. While the needs of passenger rail operations are being addressed by the <strong>State</strong>,<br />
the landside freight transportation system is not. In order for <strong>California</strong> <strong>to</strong> remain<br />
competitive in a global economy, more funds need <strong>to</strong> be devoted <strong>to</strong> improving the <strong>State</strong>’s<br />
system of highways and railroads that handle this international cargo.<br />
The case for funding for short line railroads is a compelling one. Without outside<br />
assistance, many of the <strong>State</strong>’s short line railroads will be unable <strong>to</strong> accommodate the<br />
heavier rail cars forcing more freight <strong>to</strong> move by truck and impacting the railroads<br />
ability <strong>to</strong> stay in business. The environmental, economic, safety, and mobility benefits<br />
need <strong>to</strong> be considered when evaluating infrastructure projects.<br />
Executive Summary <strong>California</strong> <strong>State</strong> <strong>Rail</strong> <strong>Plan</strong> <strong>2005</strong>-<strong>06</strong> <strong>to</strong> <strong>2015</strong>-<strong>16</strong> 19
Contact:<br />
William D. Bronte, Chief<br />
Division of <strong>Rail</strong><br />
<strong>California</strong> Department of Transportation<br />
1120 N Street, Sacramen<strong>to</strong><br />
Mailing Address: P.O. Box 942874, Sacramen<strong>to</strong> CA 94274-0001
INTRODUCTION<br />
Government Code Section 14036 requires the <strong>California</strong> Department of<br />
Transportation (the Department) <strong>to</strong> complete a ten-year <strong>State</strong> <strong>Rail</strong> <strong>Plan</strong> with both<br />
passenger rail and freight rail elements. The law also provides that the <strong>State</strong> <strong>Rail</strong><br />
<strong>Plan</strong> be submitted <strong>to</strong> the <strong>California</strong> Transportation Commission by Oc<strong>to</strong>ber of<br />
odd-numbered years, and <strong>to</strong> the Legislature, Governor, and the Public Utilities<br />
Commission by March 1, of the following year.<br />
Part I of the <strong>California</strong> <strong>State</strong> <strong>Rail</strong> <strong>Plan</strong> <strong>2005</strong>-<strong>06</strong> <strong>to</strong> <strong>2015</strong>-<strong>16</strong> (<strong>State</strong> <strong>Rail</strong> <strong>Plan</strong>) is the<br />
Passenger <strong>Rail</strong> Element and examines intercity and commuter passenger rail<br />
services in <strong>California</strong> and reviews their current operations. It also outlines tenyear<br />
plans for capital improvements and service expansions. The Passenger <strong>Rail</strong><br />
Element is covered in Part I, Chapters I through XIII.<br />
Part II of the <strong>State</strong> <strong>Rail</strong> <strong>Plan</strong> is the Freight <strong>Rail</strong> Element. It provides an<br />
explanation of freight railroads in <strong>California</strong> – including short line railroads,<br />
discusses major freight issues, funding, environmental issues related <strong>to</strong> freight<br />
railroads, and new technology – particularly for equipment. The Freight <strong>Rail</strong><br />
element is covered in Part II, Chapters XIV through XX.<br />
1
<strong>2005</strong>-<strong>06</strong> – <strong>2015</strong>-<strong>16</strong> <strong>California</strong> <strong>State</strong> <strong>Rail</strong> <strong>Plan</strong><br />
2
PART I<br />
PASSENGER RAIL ELEMENT<br />
3
<strong>2005</strong>-<strong>06</strong> – <strong>2015</strong>-<strong>16</strong> <strong>California</strong> <strong>State</strong> <strong>Rail</strong> <strong>Plan</strong><br />
4
Chapter I - <strong>California</strong>’s Vision for Intercity Passenger <strong>Rail</strong><br />
CHAPTER I<br />
CALIFORNIA’S VISION FOR INTERCITY<br />
PASSENGER RAIL<br />
This chapter provides an overview of the Administration’s comprehensive<br />
Go<strong>California</strong> vision for <strong>California</strong>’s transportation system, the <strong>California</strong><br />
Department of Transportation’s (Department) vision, mission, and goals and their<br />
relationship <strong>to</strong> the Department’s vision for intercity passenger rail service.<br />
GOCALIFORNIA<br />
Transportation in <strong>California</strong> is guided by the Administration’s comprehensive<br />
“Go<strong>California</strong>” vision for <strong>California</strong>’s transportation system. This vision guides<br />
the Fiscal Year (FY) <strong>2005</strong>-<strong>06</strong> transportation budget and capital and operating<br />
programs.<br />
Go<strong>California</strong>’s vision statement is:<br />
Improve mobility and accessibility for people, goods, services, and information<br />
through a safe, integrated, multimodal, world-class transportation system that<br />
achieves the “3-Es”:<br />
• Prosperous Economy<br />
• Quality Environment<br />
• Social Equity<br />
Go<strong>California</strong>’s goal is:<br />
Mobility that continues <strong>to</strong> attract capital investment in <strong>California</strong> <strong>to</strong> generate<br />
jobs.<br />
Go<strong>California</strong>’s objectives in its ten-year investment plan for mobility are:<br />
• Address 20-year needs and reduce congestion below <strong>to</strong>day’s levels.<br />
• Deploy demand-management strategies, use existing capacity more<br />
efficiently, and expand capacity.<br />
• Build a world-class transportation system that incorporates best research<br />
and technology.<br />
The linkage between transportation, housing, and land use are also important<br />
themes in the strategies and implementation of the Go<strong>California</strong> vision.<br />
5
<strong>2005</strong>-<strong>06</strong> – <strong>2015</strong>-<strong>16</strong> <strong>California</strong> <strong>State</strong> <strong>Rail</strong> <strong>Plan</strong><br />
THE DEPARTMENT’S MISSION AND GOALS<br />
The Department’s mission, “Caltrans Improves Mobility across <strong>California</strong>”,<br />
supports the Go<strong>California</strong> vision.<br />
The Department has five strategic goals <strong>to</strong> implement its mission.<br />
• Safety<br />
• Mobility<br />
• Delivery<br />
• Flexibility<br />
• Stewardship<br />
The relationship of the Department’s five strategic goals <strong>to</strong> the intercity rail vision<br />
is detailed below.<br />
INTERREGIONAL STRATEGIC PLANNING<br />
The Department’s Interregional Transportation Strategic <strong>Plan</strong> (ITSP) is the<br />
strategic planning document for interregional capital projects and the framework<br />
for implementing the Department’s interregional transportation funding program.<br />
The Department’s Intercity <strong>Rail</strong> Program, as described in this <strong>Plan</strong>, furthers the<br />
goals and objectives of the ITSP. The ITSP addresses the development of both the<br />
<strong>State</strong> highway interregional road and intercity rail systems in <strong>California</strong>;<br />
it includes strategies for other eligible fund uses such as interregional mass transit<br />
guideways and grade separations. The ITSP relies heavily upon the <strong>State</strong> <strong>Rail</strong><br />
<strong>Plan</strong> for its intercity rail portion. The ITSP framework and continuing statewide<br />
and interregional mobility studies and assessments, as well as moni<strong>to</strong>ring progress<br />
in meeting the ITSP objectives, serve <strong>to</strong> keep the importance of sustained, strong<br />
interregional transportation systems in the forefront as the <strong>State</strong> experiences rapid<br />
growth and development.<br />
THE DEPARTMENT’S VISION FOR INTERCITY PASSENGER<br />
RAIL<br />
The Department’s Intercity Passenger <strong>Rail</strong> Vision as shown in this <strong>Plan</strong>, supports<br />
Go<strong>California</strong>, the Department’s mission and goals, the ITSP, and summarizes and<br />
guides the Department’s efforts in relation <strong>to</strong> intercity rail.<br />
To achieve the vision for intercity rail in <strong>California</strong>, service must be frequent and<br />
reliable, and available for trips <strong>to</strong> major intercity destinations with travel times<br />
competitive with the au<strong>to</strong>. Capital projects <strong>to</strong> increase capacity allow frequencies<br />
<strong>to</strong> be added; projects <strong>to</strong> improve on-time performance (OTP), increase reliability<br />
and <strong>to</strong> reduce running time attract riders and provide an effective service.<br />
6
Chapter I - <strong>California</strong>’s Vision for Intercity Passenger <strong>Rail</strong><br />
The vision for intercity passenger rail has three key goals that are discussed as<br />
follows:<br />
Provide Relief <strong>to</strong> Highway and Airway Congestion – In many intercity<br />
corridors highway demand is near or has already exceeded capacity, and in many<br />
instances, it is not financially or environmentally feasible <strong>to</strong> add capacity.<br />
Intercity rail currently provides congestion relief in corridors where capacity has<br />
already been exceeded, and rail service can be expanded <strong>to</strong> provide additional<br />
congestion relief. Intercity rail thus provides an alternative <strong>to</strong> building new<br />
highway capacity. Current investment in rail facilities and infrastructure will<br />
protect rail capacity so it is available in the future <strong>to</strong> provide critical relief <strong>to</strong><br />
highway and airway systems.<br />
Concerning the air transportation network, it is also environmentally and<br />
financially difficult <strong>to</strong> build additional airport capacity. Intercity rail provides an<br />
effective alternative <strong>to</strong> short haul air travel, such as from the Central Valley <strong>to</strong> the<br />
Bay Area and Southern <strong>California</strong>, helping <strong>to</strong> relieve congestion at airports by<br />
eliminating the need for some short distance flights.<br />
Provide a <strong>Rail</strong> Transportation Alternative <strong>to</strong> Other Travel Modes –<br />
<strong>Rail</strong> service provides a safe, efficient and cost-effective alternative <strong>to</strong> au<strong>to</strong>, bus<br />
and air travel. There has never been a passenger fatality on <strong>State</strong>-supported<br />
Amtrak service in <strong>California</strong>. For trips between certain cities, rail provides the<br />
only alternative travel mode <strong>to</strong> the au<strong>to</strong>. <strong>Rail</strong> travel often provides the only viable<br />
mode of travel for disabled, senior and low-income travelers. Business and leisure<br />
travelers may choose rail for cost efficiency, and ease of travel. <strong>Rail</strong> can provide a<br />
cost-effective alternative <strong>to</strong> all travelers in some short haul air markets<br />
characterized by high fares, such as for air travel within the San Joaquin Valley.<br />
Improve Air Quality, Conserve Fuel, and Contribute <strong>to</strong> Efficient and<br />
Environmentally Superior Land Use – <strong>Rail</strong> service contributes <strong>to</strong> improved air<br />
quality by reducing vehicle miles traveled and vehicle emissions, by reducing fuel<br />
consumption, and by helping <strong>to</strong> limit dependence on foreign petroleum. It also<br />
helps <strong>to</strong> reduce the need for highway construction, which often causes the loss of<br />
economically, environmentally, and his<strong>to</strong>rically valuable land, and can contribute<br />
<strong>to</strong> inefficient land use patterns.<br />
7
<strong>2005</strong>-<strong>06</strong> – <strong>2015</strong>-<strong>16</strong> <strong>California</strong> <strong>State</strong> <strong>Rail</strong> <strong>Plan</strong><br />
RELATIONSHIP OF DEPARTMENT’S GOALS TO<br />
INTERCITY PASSENGER RAIL<br />
The five Department-wide transportation goals relate <strong>to</strong> the intercity passenger rail<br />
vision as follows:<br />
• SAFETY – Provide the safest transportation system in the nation for users<br />
and workers.<br />
The <strong>Rail</strong> Program strives for an excellent safety record on its intercity<br />
passenger rail services. All capital and equipment projects and operational<br />
initiatives have a strong safety component. The Operation Lifesaver rail<br />
safety campaign’s goal is improved safety at rail crossings. The Federal<br />
Section 130 Crossing Improvement Program and the Section 190 <strong>State</strong><br />
Grade Separation Program <strong>to</strong> improve and construct rail/vehicle crossings<br />
also increase safety.<br />
• MOBILITY – Optimize transportation system throughput and provide<br />
dependable travel times.<br />
The <strong>Rail</strong> Program strives <strong>to</strong> enhance throughput in two ways: first, capital<br />
projects and service improvements make the intercity passenger rail system<br />
more efficient; and second, intercity passenger rail travel improves the<br />
efficiency of the highway system by reducing highway travel. The <strong>Rail</strong><br />
Program has OTP goals for its intercity passenger rail routes; most capital<br />
projects and many operating initiatives are focused on improving OTP.<br />
• DELIVERY – Improve delivery of projects and services.<br />
The <strong>Rail</strong> Program delivers excellent performance in its capital program.<br />
The <strong>State</strong>’s intercity rail capital program is by far the largest of any <strong>State</strong>funded<br />
program in the nation.<br />
• FLEXIBILITY – Provide mobility choices through strategic partnerships.<br />
The <strong>Rail</strong> Program focuses on the goal of flexibility, by developing the<br />
intercity passenger rail travel option as one of several mass transit options<br />
available <strong>to</strong> the traveling public and improving intercity rail connectivity <strong>to</strong><br />
other transportation options.<br />
• STEWARDSHIP – Preserve and enhance <strong>California</strong>’s resources and<br />
investments.<br />
The <strong>Rail</strong> Program preserves <strong>California</strong>’s investment in <strong>State</strong>-owned rail<br />
cars and locomotives. <strong>California</strong> has the largest fleet of <strong>State</strong>-owned rail<br />
equipment in the country.<br />
8
Chapter II – Capital Program<br />
CHAPTER II<br />
CAPITAL PROGRAM<br />
This chapter describes the intercity rail capital program which includes the<br />
unconstrained and constrained ten-year capital program funding levels and project<br />
list, a discussion of his<strong>to</strong>rical funding for the capital program, and a discussion of<br />
the equipment, grade-crossing, and station programs.<br />
CAPITAL PROGRAM GOALS<br />
The Department’s goals for its Capital Program are as follows:<br />
• Increase capacity on existing routes <strong>to</strong> allow increased frequencies and<br />
improved reliability as a result of better on-time performance.<br />
• Reduce train-running times <strong>to</strong> attract riders and <strong>to</strong> provide an efficient<br />
service, with travel times directly competitive with the au<strong>to</strong>mobile.<br />
• Improve operational functioning and attractiveness of equipment, stations<br />
and facilities, including improved multimodal connectivity.<br />
• Increase the farebox ratio <strong>to</strong> reach or exceed the Department’s 50 percent<br />
standard. (Furtherance of the three above goals will result in improved costeffectiveness<br />
through an increase in revenues and a reduction in costs, with<br />
the resulting increase in farebox ratio.)<br />
• Improve the safety of <strong>State</strong>-supported intercity rail service, including grade<br />
crossings.<br />
• Implement projects <strong>to</strong> allow new cost-effective routes.<br />
These goals are used <strong>to</strong> guide the development of the ten-year capital program<br />
described below. Every capital project furthers one or more of these goals.<br />
UNCONSTRAINED TEN-YEAR CAPITAL PROGRAM<br />
Figure 2A presents the Department’s ten-year capital program for the three<br />
existing <strong>State</strong>-supported routes and for new routes. This $3.1 billion capital<br />
program represents an unconstrained program based on project needs, and not<br />
funding expectations. (See Figure 2B below for a constrained capital program<br />
consistent with prior <strong>State</strong> funding levels.)<br />
The unconstrained Ten-Year Intercity <strong>Rail</strong> Capital Program was developed from a<br />
number of sources. The first five-year increment of the program (20<strong>06</strong>-2010) is<br />
based on the latest Corridor Assessment Initatives prepared for Amtrak by the<br />
Department for the Pacific Surfliner and San Joaquin Routes and the Capi<strong>to</strong>l<br />
Corridor Joint Powers Authority (CCJPA) for the Capi<strong>to</strong>l Corridor. The Amtrak<br />
Corridor Initiatives is a five-year capital program that will become part of the next<br />
9
<strong>2005</strong>-<strong>06</strong> – <strong>2015</strong>-<strong>16</strong> <strong>California</strong> <strong>State</strong> <strong>Rail</strong> <strong>Plan</strong><br />
Amtrak Strategic <strong>Plan</strong>. The initiative assumes an 80 percent Federal, 20 percent<br />
state match Federal intercity passenger rail capital grant program is initiated. The<br />
program was developed by the <strong>State</strong> and the CCJPA based on reasonably expected<br />
<strong>State</strong> funds <strong>to</strong> satisfy the 20 percent <strong>State</strong> match over the next five years. Funding<br />
programs include the <strong>State</strong> Transportation Improvement Program (STIP) [Public<br />
Transportation Account (PTA) and <strong>State</strong> Highway Account (SHA)], Traffic<br />
Congestion Relief Program (TCRP), and the remaining funding from Proposition<br />
1<strong>16</strong>. The <strong>State</strong> funds included have been programmed, appropriated, allocated, or<br />
reserved, but not yet expended. (See Chapter XI for more detail on the <strong>State</strong><br />
Corridor Initiatives and proposed Federal intercity rail capital grant programs.)<br />
For the Pacific Surfliner Route, the second five-year increment of the program<br />
(2011-<strong>2015</strong>) is based on the LOSSAN Corridor Strategic <strong>Plan</strong> (Los Angeles <strong>to</strong><br />
San Diego) and the LOSSAN North Corridor Strategic <strong>Plan</strong> (both of which are<br />
discussed below in more detail). For the San Joaquin Route, until the Route<br />
Strategic <strong>Plan</strong> is completed (see below for more detail), no new projects are<br />
anticipated beyond the first five-year increment. For the Capi<strong>to</strong>l Corridor, the<br />
second five-year increment was based on the CCJPA’s Vision <strong>Plan</strong> updated<br />
June <strong>2005</strong>.<br />
Receipt of a large portion of the Federal funding and/or receipt of funds from tax<br />
credit bonds is critical for timely implementation of this $3.1 billion ten-year<br />
capital program. If such Federal funding is unavailable, implementation of this<br />
capital program will have <strong>to</strong> be delayed <strong>to</strong> reflect the level of <strong>State</strong> funding made<br />
available from future STIP programming cycles, as supplemented by any other<br />
available funding sources.<br />
Figure 2A<br />
Route<br />
Ten-Year Intercity <strong>Rail</strong> Capital Program Project Costs<br />
FY 20<strong>06</strong>-07 through FY <strong>2015</strong>-<strong>16</strong><br />
($ in millions)<br />
Track and<br />
Signal<br />
Stations<br />
Grade<br />
Crossings<br />
Rolling S<strong>to</strong>ck<br />
and<br />
Maintenance<br />
Facilities<br />
Total Cost<br />
EXISTING ROUTES<br />
Pacific Surfliner - North $ 497.0 $ 18.0 $ - 1 $ 515.0<br />
Pacific Surfliner - South $ 725.4 $ 46.7 $ 295.6 $ 110.6 $ 1,178.3<br />
San Joaquin $ 298.9 $ 45.2 $ - $ 43.8 $ 387.9<br />
Capi<strong>to</strong>l Corridor $ 2<strong>16</strong>.0 $ 105.8 $ 60.0 $ 56.0 $ 437.8<br />
Sub<strong>to</strong>tal $ 1,737.3 $ 215.7 $ 355.6 $ 210.4 $ 2,519.0<br />
PROPOSED ROUTES 2<br />
Coast $ 494.2 $ 9.4 $ <strong>16</strong>.4 $ 30.0 $ 550.0<br />
TOTAL $ 2,231.5 $ 225.1 $ 372.0 $ 240.4 $ 3,<strong>06</strong>9.0<br />
1 Included in Pacific Surfliner - South.<br />
2 Based on Amtrak's <strong>California</strong> Passenger <strong>Rail</strong> 20-Year Improvement <strong>Plan</strong>.<br />
Capital Costs for other proposed routes (Redding, Reno, and Coachella Valley) were not<br />
studied in the Amtrak <strong>Plan</strong>, and current comparable cost estimates are not available.<br />
10
Chapter II – Capital Program<br />
PROJECTED CAPITAL PROJECTS<br />
The following is a summary of key projects in the unconstrained ten-year capital<br />
program on the three existing <strong>State</strong>-supported routes (summarized in Figure 2A<br />
above). This list does not represent a priority listing of projects. The constrained<br />
program would include the higher priority projects on this list, as funding allows.<br />
Pacific Surfliner Route<br />
• Three new sets of train equipment<br />
• San Luis Obispo-Santa Barbara signal upgrades<br />
• Santa Barbara County new siding and siding extension projects<br />
• Moorpark-Simi Valley rail replacement<br />
• Ventura County second main track projects<br />
• Second main track near Chatsworth<br />
• Los Angeles Union Station (LAUS) run-through tracks and fifth lead track<br />
• Los Angeles, Orange, and San Diego County grade separation projects<br />
• Los Angeles-Orange County double and triple-track projects<br />
• San Diego County bridge and grade separation projects<br />
• Del Mar Bluffs stabilization project<br />
• San Diego County double-track projects<br />
• San Diego layover facility<br />
• Station improvement projects (including parking)<br />
• Ticket vending machines<br />
San Joaquin Route<br />
• Two new sets of train equipment<br />
• Port Chicago-Oakley double-track<br />
• Figarden and Belmont sidings<br />
• Sidings and siding extensions (near Fresno)<br />
• Second main track Shafter <strong>to</strong> Jastro (near Bakersfield)<br />
• Track and signal improvements in various locations<br />
• New Elk Grove, S<strong>to</strong>ck<strong>to</strong>n, and Madera stations<br />
• Station improvement projects (including parking)<br />
11
<strong>2005</strong>-<strong>06</strong> – <strong>2015</strong>-<strong>16</strong> <strong>California</strong> <strong>State</strong> <strong>Rail</strong> <strong>Plan</strong><br />
Capi<strong>to</strong>l Corridor<br />
• Three new sets of train equipment<br />
• Grade separation and crossing projects in Alameda County<br />
• Sacramen<strong>to</strong>-Roseville-Auburn track improvements<br />
• Solano County track improvements<br />
• Embarcadero (Oakland) third main track<br />
• Hayward double-track<br />
• Dumbar<strong>to</strong>n <strong>Rail</strong> Project/Union City Intermodal Station<br />
• Santa Clara double-track<br />
• San Jose fourth track<br />
• New Hercules, Swans<strong>to</strong>n (Sacramen<strong>to</strong> light-rail connection) and<br />
Fairfield/Vacaville (Peabody Road) stations<br />
• Station improvement projects<br />
CORRIDOR STRATEGIC PLANNING<br />
Pacific Surfliner Route<br />
In November 2003, the Department released the LOSSAN Corridor Strategic <strong>Plan</strong><br />
Los Angeles <strong>to</strong> San Diego Proposed <strong>Rail</strong> Corridor Improvement Studies.<br />
This <strong>Plan</strong> analyzes rail improvements from a corridor wide perspective and is<br />
meant <strong>to</strong> complement the Environmental Impact Report/Environmental Impact<br />
<strong>State</strong>ment (EIR/EIS) process discussed below. The <strong>Plan</strong> included background on<br />
the corridor and served as the project screening process <strong>to</strong> determine which<br />
alternatives and design options should be examined in the EIR/EIS.<br />
The work on the EIR/EIS started in 2002, when the Department, in cooperation<br />
with the Federal <strong>Rail</strong>road Administration (FRA), <strong>California</strong> High-Speed <strong>Rail</strong><br />
Authority (CHSRA), Amtrak and regional and local planning agencies,<br />
participated in technical studies that analyzed alternatives and opportunities for<br />
rail corridor improvements between Los Angeles and San Diego. As part of these<br />
studies, the Department and FRA jointly under<strong>to</strong>ok a program level EIR/EIS <strong>to</strong><br />
evaluate potential rail corridor improvements. The EIR/EIS was completed in the<br />
Spring <strong>2005</strong>. This document will facilitate environmental reviews of specific<br />
project improvements under both the <strong>California</strong> Environmental Quality Act<br />
(CEQA) and the National Environmental Policy Act (NEPA).<br />
In June <strong>2005</strong>, the Draft LOSSAN North Corridor Strategic <strong>Plan</strong> was prepared;<br />
it covers the Route from Los Angeles <strong>to</strong> San Luis Obispo. The Department,<br />
in cooperation with regional planning agencies, Amtrak, Southern <strong>California</strong><br />
Regional <strong>Rail</strong> Authority (SCRRA), Union Pacific <strong>Rail</strong>road (UP) and other<br />
12
Chapter II – Capital Program<br />
stakeholders, completed this <strong>Plan</strong>. The <strong>Plan</strong> outlines a list of capital projects<br />
required <strong>to</strong> improve rail service for the immediate period (up <strong>to</strong> three years),<br />
near-term (four <strong>to</strong> eight year), and vision (nine <strong>to</strong> 20 years). A series of public<br />
workshops and agency meetings were held <strong>to</strong> obtain input for rail service<br />
improvements and <strong>to</strong> identify community issues and concerns.<br />
Please note that the term LOSSAN now refers <strong>to</strong> the entire Pacific Surfliner<br />
corridor from San Diego <strong>to</strong> San Luis Obispo, even though the term originally<br />
referred <strong>to</strong> only the Los Angeles-San Diego segment. LOSSAN also refers <strong>to</strong> the<br />
Los Angeles-San Diego-San Luis Obispo <strong>Rail</strong> Corridor Agency.<br />
San Joaquin Route<br />
In the fall of <strong>2005</strong>, the Department was in the process of developing a San Joaquin<br />
Strategic Business <strong>Plan</strong>. The Department issued a request for proposal for the<br />
preparation of this <strong>Plan</strong>. The <strong>Plan</strong> is expected <strong>to</strong> be completed by the end of 2007.<br />
Capi<strong>to</strong>l Corridor Route<br />
The CCJPA has issued a new Vision <strong>Plan</strong>, updated June <strong>2005</strong>. This updates the<br />
original Vision <strong>Plan</strong>, issued in May 2002. The <strong>Plan</strong> provides objectives,<br />
implementing strategies and actions for continued growth and expansion on the<br />
Corridor. The <strong>Plan</strong>, in conjunction with the <strong>2005</strong>-<strong>06</strong> CCJPA Business <strong>Plan</strong><br />
includes Tier I (1-5 year) capital projects and Tier II (6-20 year) capital projects.<br />
(The CCJPA identified which Tier II projects are within the ten-year timeframe of<br />
the <strong>State</strong> <strong>Rail</strong> <strong>Plan</strong>.)<br />
CONSTRAINED CAPITAL PROGRAM<br />
Figure 2B shows the constrained $770 million ten-year capital program.<br />
This program funding level assumes:<br />
• $60 million a year in STIP funding is made available over the ten-year<br />
period (from 20<strong>06</strong> through 2014 STIP cycles).<br />
• $170 million in remaining TCRP intercity rail project funding is made<br />
available.<br />
This annual projected STIP amount is less than the average annual STIP funding<br />
programmed since 1996. The 1996 STIP provided $117 million in funding for<br />
intercity rail projects, while the 1998 STIP, as augmented, provided an additional<br />
$181 million. However, the 2000 STIP provided $46 million more. The 2002<br />
STIP increased funding by $1<strong>06</strong> million. But no additional funds were made<br />
available in the 2004 STIP.<br />
The TCRP specified a list of projects <strong>to</strong> be funded, including over $200 million for<br />
specific intercity rail capital projects. Through July <strong>2005</strong>, $43 million was<br />
allocated from the Traffic Congestion Relief Fund (TCRF) <strong>to</strong> intercity rail<br />
projects. Then, in August <strong>2005</strong>, an additional $86.8 million was allocated.<br />
13
<strong>2005</strong>-<strong>06</strong> – <strong>2015</strong>-<strong>16</strong> <strong>California</strong> <strong>State</strong> <strong>Rail</strong> <strong>Plan</strong><br />
As a result of the Proposition 42 transfer in <strong>2005</strong>-<strong>06</strong> (see Chapter XII for more<br />
detail), it is expected that other TCRP rail projects will be funded. Thus the<br />
constrained program includes $170 million in TCRP funds, which includes the<br />
August <strong>2005</strong> allocation and unallocated funds.<br />
Figure 2B<br />
Route<br />
Constrained Ten-Year Intercity <strong>Rail</strong> Capital Program Project Costs<br />
FY 20<strong>06</strong>-07 through FY <strong>2015</strong>-<strong>16</strong><br />
($ in millions)<br />
Track and<br />
Signal<br />
Stations<br />
Grade<br />
Crossings<br />
Pacific Surfliner - North $ 156.4 $ 5.5 $ -<br />
-<br />
Pacific Surfliner - South $ 220.2 $ 14.2 $ 89.7 33.6<br />
San Joaquin $ 90.7 $ 13.7 $ -<br />
13.3<br />
Capi<strong>to</strong>l Corridor $ 65.5 $ 32.1 $ 18.2 <strong>16</strong>.9<br />
Rolling S<strong>to</strong>ck<br />
and<br />
Maintenance<br />
Total Cost<br />
Facilities<br />
$ $ <strong>16</strong>1.9<br />
$ $ 357.7<br />
$ $ 117.7<br />
$ $ 132.7<br />
Total $ 532.8 $ 65.5 $ 107.9 $ 63.8 $ 770.0<br />
CAPITAL PROGRAM FUNDING<br />
BACKGROUND<br />
Figure 2C provides a summary of all capital funding for intercity rail in <strong>California</strong><br />
since the beginning of <strong>State</strong>-supported rail service. The summary reflects all<br />
expended and allocated funds, including funds from Propositions 108 and 1<strong>16</strong>,<br />
funds provided by the TCRP, and funds from all sources programmed in the 1996,<br />
1998, 2000, and 2002 STIPs and carried over <strong>to</strong> the 2004 STIP. To date, over<br />
$2.8 billion has been invested or reserved, including projects for stations, track<br />
and signal improvements, maintenance and layover facilities and rolling s<strong>to</strong>ck.<br />
Although the <strong>State</strong> has provided about 63 percent of the <strong>to</strong>tal investment, local<br />
entities, the Federal government, Amtrak, and the private railroads have made<br />
major contributions. The Department’s publication, the <strong>California</strong> Intercity <strong>Rail</strong><br />
Capital Program, December 1, <strong>2005</strong> (IRCP), details the projects shown in<br />
Figure 2C.<br />
The intercity rail capital program was originally funded from special legislation<br />
and the Intermodal Facilities Program. This program was then broadened <strong>to</strong><br />
become the Transit Capital Improvement (TCI) Program, which used both<br />
Transportation <strong>Plan</strong>ning and Development Account funds (which subsequently<br />
became the PTA) and SHA funds. In the late 1980s, some capital funding was<br />
provided through direct appropriations in the Budget Act or in other legislation.<br />
14
Chapter II – Capital Program<br />
Figure 2C<br />
Intercity <strong>Rail</strong> Capital Program Funding His<strong>to</strong>ry<br />
July 1976 through December <strong>2005</strong><br />
Expended and Reserved Funds<br />
SUMMARY OF PROJECTS BY PROJECT TYPE<br />
($ in Millions)<br />
Project Type<br />
Maintenance<br />
Route<br />
Stations<br />
Track and<br />
Signal<br />
and Layover<br />
Facilities Rolling S<strong>to</strong>ck Total<br />
Pacific Surfliner - North $ 103.8 $ 240.6<br />
$ 344.4<br />
Pacific Surfliner - South $ 143.9 $ 666.1<br />
$ 810.0<br />
Total Pacific Surfliner $ 247.7 $ 9<strong>06</strong>.7<br />
$ 1,154.4<br />
San Joaquin $ 150.5 $ 392.7<br />
$ 543.2<br />
Capi<strong>to</strong>l Corridor $ 100.0 $ 196.9<br />
$ 296.9<br />
Other Routes $ 44.3 $ 24.4<br />
$ 68.7<br />
Maintenance and Layover<br />
Facilities $ 143.8<br />
$ 143.8<br />
Rolling S<strong>to</strong>ck $ 609.6 $ 609.6<br />
Grand Total $ 542.5 $ 1,520.7 $ 143.8 $ 609.6 $ 2,8<strong>16</strong>.6<br />
SUMMARY OF PROJECTS BY FUNDING SOURCE<br />
($ in Millions)<br />
Funding Source<br />
Route <strong>State</strong> Local Federal Amtrak <strong>Rail</strong>road Other Total<br />
Pacific Surfliner - North $ 229.5 $ 85.4 $ 25.1 $ 3.1 $ 1.3<br />
$ 344.4<br />
Pacific Surfliner - South $ 5<strong>16</strong>.2 $ 104.9 $ 153.3 $ <strong>16</strong>.1 $ 7.1 $ 12.4 $ 810.0<br />
Total Pacific Surfliner $ 745.7 $ 190.3 $ 178.4 $ 19.2 $ 8.4 $ 12.4 $ 1,154.4<br />
San Joaquin $ 395.3 $ 33.1 $ 32.7 $ 2.0 $ 78.4 $ 1.7 $ 543.2<br />
Capi<strong>to</strong>l Corridor $ 198.6 $ 51.4 $ 31.1 $ 1.2 $ 14.5 $ 0.1 $ 296.9<br />
Other Projects $ 30.3 $ 7.8 $ 21.4 $ 3.0 $ 6.2<br />
$ 68.7<br />
Maintenance and Layover<br />
Facilities $ 80.8 $ 0.5<br />
$ 62.5<br />
$ 143.8<br />
Rolling S<strong>to</strong>ck $ 3<strong>06</strong>.3<br />
$ 0.5 $ 296.5<br />
$ 6.3 $ 609.6<br />
Grand Total $ 1,757.0 $ 283.1 $ 264.1 $ 384.4 $ 107.5 $ 20.5 $ 2,8<strong>16</strong>.6<br />
In 1990, capital funding for intercity rail increased dramatically. First, legislation<br />
passed that authorized the placement on the ballot of a bond measure in 1990,<br />
identified as Proposition 108, for $1 billion in bond funds for rail projects,<br />
including about $225 million for intercity rail. This bond issue passed.<br />
In addition, another measure was placed on the same ballot, Proposition 1<strong>16</strong>,<br />
an initiative measure, and it also was approved. It provided $2 billion for rail,<br />
including about $382 million for intercity rail. To date, practically all available<br />
Proposition 108 and 1<strong>16</strong> funds for intercity rail have been used.<br />
The new bond programs allowed the Department <strong>to</strong> begin its intercity rail<br />
equipment acquisition program. Proposition 1<strong>16</strong> specifically required that the<br />
Department design and acquire intercity rail equipment and provided a source of<br />
funding for rail equipment. Before the bond measures were enacted, there was<br />
limited available funding for rail equipment. This is because Article XIX of the<br />
<strong>State</strong> Constitution does not allow rail equipment <strong>to</strong> be funded from SHA funds<br />
15
<strong>2005</strong>-<strong>06</strong> – <strong>2015</strong>-<strong>16</strong> <strong>California</strong> <strong>State</strong> <strong>Rail</strong> <strong>Plan</strong><br />
that are generated by excise taxes on fuel. The SHA is the primary funding source<br />
for the STIP and transportation capital projects.<br />
Then Chapter 622, Statutes of 1997 [Senate Bill (SB) 45-Kopp], was passed which<br />
gives intercity rail projects a minimum of nine percent of the interregional portion<br />
of the STIP as part of the Interregional Transportation Improvement Program<br />
(ITIP). Intercity rail projects can also be funded in the Regional Transportation<br />
Improvement Program (RTIP). As a result, in the 1996 STIP, 1998 STIP,<br />
the 1998 STIP Augmentation, the 2000 STIP, and the 2002 STIP a <strong>to</strong>tal of<br />
$450 million was programmed for intercity rail projects. Of that amount,<br />
$323 million has been allocated. Due <strong>to</strong> severe funding constraints, the 2004 STIP<br />
did not program any new funding for intercity rail projects. It includes only<br />
projects previously programmed in the 2002 STIP, but not yet allocated.<br />
Since the passage of SB 45 in 1997, most intercity rail funding provided by the<br />
<strong>State</strong> has come from projects proposed by the Department in the ITIP, which<br />
receives only 25 percent of all STIP funding. The RTIP, for which projects are<br />
proposed by the Regional Transportation <strong>Plan</strong>ning Agencies (RTPAs), receives<br />
the remaining 75 percent of STIP funding. However, as part of the partnership<br />
between the Department and the RTPAs, significant intercity rail expansions will<br />
require funding commitments from RTPAs in the RTIP.<br />
Chapter 91, Statutes of 2000 [Assembly Bill (AB) 2928 – Torlakson], established<br />
the Governor’s TCRP <strong>to</strong> be funded from the TCRF. The TCRP contained<br />
$201.5 million for specific intercity rail capital projects, including $148.5 million<br />
for the Pacific Surfliners for the Los Angeles run-through tracks project <strong>to</strong> reduce<br />
running times through Union Station in Los Angeles, a triple-track project in<br />
Los Angeles County, double-track projects in San Diego County, a new San Diego<br />
area maintenance facility, and a parking structure at Oceanside. Also, $25 million<br />
was reserved <strong>to</strong> double-track portions of the San Joaquins, and $28 million was<br />
reserved for the Capi<strong>to</strong>l Corridor for track and signal improvements between<br />
Oakland and San Jose, for track improvements at the Emeryville and Oakland<br />
stations, and for a new station at Hercules.<br />
Two recent <strong>State</strong> Budgets provided funding from the General Fund (GF) for<br />
intercity rail capital projects. The 1999-00 Budget provided $17.5 million for<br />
equipment acquisition. The 2000-01 Budget included $30 million for equipment,<br />
and $20 million for track improvements on the San Joaquin Route.<br />
Also in 1999-00, $17 million in proceeds from leveraged leaseback of the existing<br />
<strong>California</strong> Car and locomotive fleet was received for purchase of new intercity rail<br />
equipment. The 2001-02 Budget included $91 million in PTA funds for track<br />
improvements on all three <strong>State</strong>-supported routes.<br />
<strong>16</strong>
Chapter II – Capital Program<br />
OUTLOOK<br />
The intercity rail program has received significant capital funding, as is discussed<br />
above. However, as it also mentioned above, adequate <strong>State</strong> funding is not<br />
projected <strong>to</strong> be available <strong>to</strong> fund the unconstrained capital program presented in<br />
Figure 2A. The only ongoing and guaranteed capital funding source is the nine<br />
percent of the ITIP that was provided by SB 45. Other major intercity rail capital<br />
funding sources, such as Proposition 108 and 1<strong>16</strong> bond funds and TCRP funds did<br />
not provide ongoing funding. And funding from sources such as the GF was on<br />
a project specific basis. There have been a number of proposals on the Federal<br />
level for an ongoing intercity rail capital grant program, but <strong>to</strong> date, no program<br />
has been enacted.<br />
The lack of a stable and adequate ongoing funding source for the intercity rail<br />
capital program is a major concern. It is difficult <strong>to</strong> develop long-range service<br />
plans that are dependant upon new equipment and capital projects when funding<br />
levels are uncertain. Also, it is difficult <strong>to</strong> determine what are the most costeffective<br />
capital projects in the short-term, when the magnitude of the long-term<br />
capital program is uncertain. The Department will continue <strong>to</strong> explore<br />
mechanisms for a stable intercity rail capital funding source.<br />
Stable funding for equipment acquisition is of particular concern. This is because<br />
Article XIX of the <strong>State</strong> Constitution does not allow rail equipment <strong>to</strong> be funded<br />
from SHA funds that are generated by excise taxes on fuel. Equipment has in the<br />
past been funded from special sources, such as one-time budget appropriations<br />
from sources such as the GF. Currently, virtually all new frequencies or<br />
extensions of the existing three intercity rail routes and any new routes will require<br />
new equipment. As there is a very limited supply of existing equipment that could<br />
be available for lease, new intercity rail service is dependant on the <strong>State</strong><br />
purchasing new equipment.<br />
Additionally, existing equipment requires funding for maintenance and overhaul.<br />
To date, PTA funds have been used for this purpose. However, as existing<br />
equipment ages and new equipment is acquired, overhaul needs will increase,<br />
and additional funds will be needed.<br />
Funding for intercity rail operations is considerably more stable than capital<br />
funding. The PTA, which is designed under law as a trust fund for transportation<br />
planning and mass transportation purposes, has been the exclusive source for<br />
intercity rail operations. Under Proposition 42, enacted in March 2002,<br />
the transfer of certain gasoline sales tax revenue <strong>to</strong> the PTA will significantly<br />
increase PTA funding available for expansion of intercity rail operations.<br />
17
<strong>2005</strong>-<strong>06</strong> – <strong>2015</strong>-<strong>16</strong> <strong>California</strong> <strong>State</strong> <strong>Rail</strong> <strong>Plan</strong><br />
ROLLING STOCK PROGRAM<br />
ROLLING STOCK FLEET<br />
The <strong>State</strong> has an intercity rail rolling s<strong>to</strong>ck program unparalleled by any other state<br />
in the nation. The <strong>State</strong> owns its own fleet of 88 cars and 17 locomotives.<br />
The <strong>State</strong> has spent over $300 million on the design and acquisition of cars and<br />
locomotives since the early 1990’s. Proposition 1<strong>16</strong>, passed by the voters in 1990,<br />
provided the initial funds for the design and purchase of equipment. This fleet has<br />
allowed significant frequency increased on all three routes.<br />
In the mid-1990s, the <strong>State</strong> designed and acquired the innovative 66 unit<br />
<strong>California</strong> Car fleet, plus nine locomotives. The cars were delivered between 1995<br />
and 1997, and the locomotives were delivered between 1994 and 1995. The cars<br />
are bi-level cars, and were some of the first rail cars <strong>to</strong> bring a new level of<br />
comfort <strong>to</strong> passengers with many improved amenities. The cars are fully<br />
compliant with the Americans with Disabilities Act (ADA). The General Mo<strong>to</strong>rs<br />
F59PHI locomotives have a maximum operating speed of 110 mph, emission<br />
reduction technology, and features <strong>to</strong> improve operational and functional safety.<br />
Two additional General Electric Dash-8 locomotives were purchased from Amtrak<br />
in 1994.<br />
In 2002, the <strong>State</strong> purchased and placed in service an additional 22 cars and<br />
six locomotives. The cars were acquired as an option <strong>to</strong> Amtrak’s 40-car<br />
Pacific Surfliner fleet order for Southern <strong>California</strong>. Twelve of the <strong>State</strong>-owned<br />
cars were for Northern <strong>California</strong> operations, and ten cars were for<br />
Pacific Surfliner operations. The locomotives are General Mo<strong>to</strong>rs model F59PHI.<br />
The Northern <strong>California</strong> fleet, which is used on both the San Joaquins and<br />
Capi<strong>to</strong>l Corridor, is entirely <strong>State</strong>-owned. It includes 78 cars – the original<br />
66 <strong>California</strong> cars and 12 new Pacific Surfliner cars, and 17 locomotives –<br />
15 General Mo<strong>to</strong>rs F59PHI and two General Electric Dash-8.<br />
The Pacific Surfliner fleet includes 50 cars and 14 locomotives. Only ten cars,<br />
and none of the locomotives of this fleet are <strong>State</strong>-owned.<br />
ROLLING STOCK MAINTENANCE AND OVERHAUL PROGRAM<br />
In addition <strong>to</strong> equipment procurement, the equipment program also includes<br />
warranty, rework, and modification of procured equipment; scheduled<br />
maintenance; heavy equipment overhaul; equipment modernization; inspection<br />
and safety moni<strong>to</strong>ring; and repair of damaged equipment.<br />
In 2001-02, the Department started its heavy equipment overhaul program for its<br />
fleet of <strong>California</strong> Cars and locomotives. Different components of the equipment<br />
need <strong>to</strong> be overhauled on a cyclical basis. The overhaul cycle varies from two <strong>to</strong><br />
eight years depending on the component being serviced. The principal overhaul is<br />
18
Chapter II – Capital Program<br />
at eight years and is called the mid-life overhaul. Thus, the overhaul program is<br />
ongoing, and in each year different cars and components receive an overhaul.<br />
Funding for the overhaul program varies by budget year based on the specific<br />
overhauls planned for that particular budget year. The overhaul program has been<br />
funded through PTA funds appropriated each year by the Budget Act. Article XIX<br />
of the <strong>State</strong> Constitution prohibits the use of SHA funds for mass transit vehicle<br />
acquisition or maintenance. Thus, SHA funds cannot be used for the overhaul<br />
program, nor is there any dedicated funding source for the overhaul work needed<br />
in the future as the equipment ages.<br />
In 2003-04, the Department contracted for the mid-life (eight-year) overhaul of the<br />
original 66 <strong>California</strong> Cars. Design, engineering and the completion of the<br />
overhaul and testing of the four pilot (pro<strong>to</strong>type) cars (cab, coach, foodservice and<br />
baggage) was completed in 2004-05. Regular production completed in 2007.<br />
This overhaul cycle includes many mechanical components; heavy cleaning of<br />
vehicle interior including upholstery and carpets; rebuilding and new flooring in<br />
<strong>to</strong>ilet rooms; new side door and end door operating systems; 110 volt convenience<br />
outlets at every seat; as well as other additions and improvements <strong>to</strong> the cars.<br />
The Department oversees and inspects the contrac<strong>to</strong>r’s overhaul work.<br />
In early 2004, the Department completed the mid-life overhaul of the nine original<br />
F59PHI locomotives acquired in 1994-95. This project improved both the<br />
reliability and appearance of the locomotives, with graphics that match the new<br />
F59PHIs. Additionally, the locomotives were upgraded <strong>to</strong> the same standard as<br />
the new locomotives. Also, the remote locomotive health moni<strong>to</strong>ring system<br />
currently in place on the six new F59PHI locomotives was installed on the nine<br />
locomotives in 2003-04.<br />
In future years, the newer 22 cars (12 in the Northern <strong>California</strong> fleet and ten in<br />
the Southern <strong>California</strong> fleet) will need their mid-life overhaul as will the<br />
remaining eight locomotives.<br />
Figure 2D provides information on the overhaul program. For the ten-year period,<br />
it shows annual funding needs and the number of vehicles needing overhaul.<br />
The funding includes costs for all overhaul cycles – the eight year mid-life cycle<br />
as well as other cycles for specific components. The figure also shows the number<br />
of cars and locomotives scheduled for heavy overhaul each year under the various<br />
overhaul cycles. The figure assumes that equipment purchases projected in the<br />
ten-year capital plan will be made and overhaul of this equipment will begin<br />
within the ten-year period.<br />
19
<strong>2005</strong>-<strong>06</strong> – <strong>2015</strong>-<strong>16</strong> <strong>California</strong> <strong>State</strong> <strong>Rail</strong> <strong>Plan</strong><br />
Figure 2D<br />
Intercity <strong>Rail</strong> Rolling S<strong>to</strong>ck Overhaul Program<br />
Fiscal Year<br />
($ in millions)<br />
Projected Overhaul<br />
Funding Needs<br />
Projected Number<br />
of Units for<br />
Overhaul<br />
<strong>2005</strong>-<strong>06</strong> $ 13.8 48<br />
20<strong>06</strong>-07 $ 14.4 52<br />
2007-08 $ 13.8 66<br />
2008-09 $ 9.3 43<br />
2009-10 $ 13.2 36<br />
2010-11 $ 12.7 72<br />
2011-12 $ 13.5 53<br />
2012-13 $ 13.8 58<br />
2013-14 $ 14.1 64<br />
2014-15 $ 14.5 66<br />
<strong>2015</strong>-<strong>16</strong> $ <strong>16</strong>.5 74<br />
In addition <strong>to</strong> the mid-life overhaul and separate overhaul of specific components,<br />
the Department periodically updates or replaces specific equipment systems <strong>to</strong><br />
improve passenger amenities, safety, or function of the equipment. For example,<br />
the Department is planning <strong>to</strong> replace the outdated destination sign system on the<br />
<strong>California</strong> Car fleet with a new destination sign and au<strong>to</strong>mated passenger<br />
information system that incorporates up-<strong>to</strong>-date passenger information system<br />
technology. These new signs meet all current standards for audible and visual<br />
messaging (including ADA requirements), real-time service messages, au<strong>to</strong>mated<br />
train location and text uploading, diagnostics, and animated graphics. This system<br />
will be applied <strong>to</strong> all 78 railcars in the Northern <strong>California</strong> fleet by 20<strong>06</strong>-07.<br />
The 22 new Pacific Surfliner cars will have completed their three-year warranty<br />
period in <strong>2005</strong>. During the warranty period, the Department conducts regular<br />
inspections, documents equipment failures, evaluates defects <strong>to</strong> determine fleetwide<br />
impacts, and coordinates with Amtrak for repairs. In <strong>2005</strong>, the Department<br />
conducted a final three-year audit on the cars.<br />
After the warranty period, the cars enter in<strong>to</strong> Amtrak’s preventative maintenance<br />
program with overhauls at four, six, and eight years. The Department oversees<br />
this program.<br />
20
Chapter II – Capital Program<br />
RAIL-HIGHWAY GRADE CROSSING IMPROVEMENT AND<br />
SEPARATION PROGRAMS<br />
The Department has a number of programs <strong>to</strong> improve safety at rail-highway<br />
grade crossings as well as improve rail and road operations. Locations where a<br />
railroad track and a street or road cross each other at the same grade are called railhighway<br />
grade crossings. The Federal Section 1010/1103 Program and the<br />
Federal Section 130 Program focus on improving safety and operations at grade<br />
crossings. Locations where a railroad track and a street or road cross each other at<br />
separate grades are called rail-highway grade separations. The <strong>State</strong> Section 190<br />
Program focuses on constructing grade separations. These programs combined<br />
receive, approximately $35 million a year in funds.<br />
FEDERAL SECTION 1010/1103(C) RAILWAY-HIGHWAY CROSSING<br />
HAZARD ELIMINATION IN HIGH SPEED RAIL CORRIDORS<br />
PROGRAM<br />
Section 1010 of the Intermodal Surface Transportation Efficiency Act (ISTEA)<br />
(23 U.S.C. 104(d)), which was enacted in 1991, provides $5 million per year for<br />
elimination of hazards at railway-highway crossings. When ISTEA was<br />
reauthorized in 1998 as the Transportation Efficiency Act for the 21st Century, or<br />
TEA-21, Section 1010 was revised as Section 1103(c). In order for rail corridors<br />
<strong>to</strong> be eligible <strong>to</strong> compete for Section 1010 funding, they must include rail lines<br />
where railroad speeds of 90 mph are occurring or can reasonably be expected <strong>to</strong><br />
occur in the future. <strong>California</strong>’s existing <strong>State</strong>-supported intercity passenger rail<br />
routes, plus the Coast Route between San Jose and San Luis Obispo, <strong>to</strong>gether<br />
comprise one of the nationally designated corridors eligible <strong>to</strong> compete for the<br />
Section 1010 funding. Since FY 1992-93, the Department has received<br />
$6.3 million in Federal funds from the program. The Department uses the<br />
Section 1010 funds for improvements in signaling at grade crossings, private grade<br />
crossing closures, and other grade crossing safety improvements.<br />
FEDERAL SECTION 130 CROSSING IMPROVEMENT PROGRAM<br />
Section 14036.4 of the Government Code requires the Department <strong>to</strong> report on the<br />
amount of funds available <strong>to</strong> the <strong>State</strong> under the Federal rail-highway crossing<br />
program (23 U.S.C. 130), including the cash balance, funds encumbered during<br />
the last year, and amounts anticipated <strong>to</strong> be received during the subsequent year.<br />
This information is included in Figure 2E.<br />
Prior <strong>to</strong> Federal Fiscal Year (FFY) <strong>2005</strong>-<strong>06</strong>, the Federal Section 130 Program<br />
provided about $10.2 million per year in Federal highway funds for grade crossing<br />
safety projects. Starting in FFY <strong>2005</strong>-<strong>06</strong>, pursuant <strong>to</strong> the Safe, Accountable,<br />
Flexible, Efficient Transportation Equity Act: a Legacy for Users<br />
(SAFETEA-LU), this amount increased <strong>to</strong> $<strong>16</strong>.2 million. The Department<br />
supplements this program each year with other Federal funds <strong>to</strong> pay for grade<br />
21
<strong>2005</strong>-<strong>06</strong> – <strong>2015</strong>-<strong>16</strong> <strong>California</strong> <strong>State</strong> <strong>Rail</strong> <strong>Plan</strong><br />
crossing improvements on <strong>State</strong> routes. With the supplemental Federal funds, the<br />
<strong>to</strong>tal statewide financial commitment <strong>to</strong> grade crossing improvements will range<br />
from about $19 million <strong>to</strong> $21 million per year, with $<strong>16</strong> million allocated <strong>to</strong><br />
projects <strong>to</strong> eliminate hazards at rail crossings on local streets and roads and the<br />
balance (three <strong>to</strong> five million) allocated <strong>to</strong> projects on <strong>State</strong> routes. Improvements<br />
include the installation of grade crossing safety devices such as flashers, gates,<br />
cantilevered flashing lights, constant time warning devices, surface improvements,<br />
crossing closures and coordinated traffic signal preemption at crossings.<br />
Figure 2E<br />
Section 130 Federal Crossing Improvement Program Funding Status<br />
Federal Fiscal Year 2004-05 – <strong>2005</strong>-<strong>06</strong><br />
($ in thousands)<br />
Total<br />
Apportionment<br />
Funds Available on<br />
Oct. 1, 2004 (Roll-<br />
Over and New<br />
Funds)<br />
Cumulative<br />
Obligations<br />
(Obligations and<br />
Deobligations)<br />
Total Unobligated<br />
Balance Sept. 30,<br />
<strong>2005</strong><br />
Anticipated<br />
Apportionments<br />
Oct. 1, <strong>2005</strong><br />
through Sept. 30,<br />
20<strong>06</strong><br />
Total<br />
Apportionment<br />
Funds Available<br />
on Oct. 1, <strong>2005</strong><br />
(Roll-Over and<br />
New Funds)<br />
$ 14,123 $ 2,744 $ 11,380 $ <strong>16</strong>,263 $ 27,643<br />
The <strong>California</strong> Public Utilities Commission (CPUC), in consultation with the<br />
railroads, the Department and the appropriate <strong>State</strong> and local agencies, determines<br />
proposed improvements and priority order. Based on available funds, the<br />
Department selects projects from the prioritized list for inclusion in the Multi-Year<br />
Section 130 Program Funding <strong>Plan</strong> approved by the CPUC and the Department.<br />
The program funds 90 percent of the cost of the improvements, including all signal<br />
and surfacing work projects. The other ten percent is usually paid by the local<br />
entity responsible for the road or highway involved, generally a city or county.<br />
On <strong>State</strong> highways, the <strong>State</strong> will pay the ten percent non-Federal share.<br />
However, projects involving railroad-protective devices only are 100 percent<br />
federally funded. Under Federal law, the annual grade crossing improvement<br />
program must be included in the Transportation Improvement Programs (TIPs) of<br />
the appropriate Metropolitan <strong>Plan</strong>ning Organizations prior <strong>to</strong> obligation of<br />
funding.<br />
The Department administers Section 130 funding for projects involving railroad<br />
crossings of both <strong>State</strong> highways and local streets and roads. Program staff<br />
develops the financing for the construction of eligible projects; ensures that<br />
Federal and <strong>State</strong> law, policies, practices and standards are observed; issues<br />
agreements <strong>to</strong> railroad companies and local agencies; provides follow-up on<br />
project delivery for grade crossing projects; moni<strong>to</strong>rs Section 130 expenditures;<br />
and publishes a listing of planned Section 130 projects.<br />
22
Chapter II – Capital Program<br />
STATE SECTION 190 GRADE SEPARATION PROGRAM<br />
The Section 190 Grade Separation Program is a <strong>State</strong>-funded safety program that<br />
provides for the elimination of existing at-grade railroad crossings. Most projects<br />
funded under this program are grade separations. However, consolidations or<br />
track removal projects that eliminate grade crossings can also be considered.<br />
Eligible projects are identified on the basis of the priority list established by the<br />
CPUC. This list is developed every two years, and becomes effective in July of<br />
even numbered years. Local agencies, railroad companies or the Department can<br />
nominate projects. Nominated projects are prioritized on the basis of a formula<br />
that incorporates such fac<strong>to</strong>rs as traffic volumes (both roadway and railroad),<br />
projected <strong>State</strong> contribution, accident his<strong>to</strong>ry, and physical conditions at the<br />
crossing <strong>to</strong> be eliminated.<br />
Once the CPUC list has been established, the Department administers the<br />
program. The annual amount of <strong>State</strong> funding for the program is $15 million, with<br />
a maximum amount of $5 million per project. In general, the <strong>State</strong> contribution<br />
for any one project is limited <strong>to</strong> 80 percent of the project cost if the grade crossing<br />
<strong>to</strong> be eliminated has been in existence for at least ten years prior <strong>to</strong> the date of<br />
allocation of the funds. The railroad must contribute a minimum of ten percent of<br />
the <strong>to</strong>tal cost of the project, and the lead agency must cover the rest. (Note: if the<br />
lead agency elects <strong>to</strong> use Federal funding for a portion of the project, the railroad<br />
contribution requirement is reduced <strong>to</strong> five percent, in accordance with Federal<br />
regulations.) If the grade crossing <strong>to</strong> be eliminated has been in existence for less<br />
than ten years prior <strong>to</strong> the allocation date, the project may receive up <strong>to</strong> 50 percent<br />
<strong>State</strong> funding, with a 50 percent matching-fund requirement. As above, the<br />
railroad must contribute a minimum of ten percent of the <strong>to</strong>tal cost of the project.<br />
The <strong>to</strong>tal project cost includes design, right-of-way (ROW) acquisition, utility<br />
relocation, environmental clearance, and all construction elements (structures,<br />
approaches, ramps, connections, drainage, etc.) required <strong>to</strong> make the grade<br />
separation operable.<br />
Projects that include multiple grade separations are eligible <strong>to</strong> receive up <strong>to</strong><br />
$20 million if they provide projected cost savings of at least 50 percent <strong>to</strong> the <strong>State</strong><br />
and/or local jurisdiction by eliminating the need for future projects, and if they<br />
alleviate traffic and safety problems or provide improved rail service not otherwise<br />
possible. Such projects are funded over a multiyear period lasting up <strong>to</strong> five years,<br />
with up <strong>to</strong> $5 million allocated each year.<br />
Requests for allocations are due <strong>to</strong> the Department on April 1 of each FY. Within<br />
the limits of available funding, allocations are made by the Department, pursuant<br />
<strong>to</strong> a delegation from the <strong>California</strong> Transportation Commission, in priority order <strong>to</strong><br />
all projects that meet the requirements. If a project only receives a partial<br />
allocation because of limited funding, it will be au<strong>to</strong>matically eligible for the<br />
balance of its funding in the following FY. Projects that do not receive an<br />
23
<strong>2005</strong>-<strong>06</strong> – <strong>2015</strong>-<strong>16</strong> <strong>California</strong> <strong>State</strong> <strong>Rail</strong> <strong>Plan</strong><br />
allocation within the two-year life of the CPUC priority list must be re-nominated<br />
in order <strong>to</strong> remain eligible. Grade separation projects are also eligible for STIP<br />
funding.<br />
STATION PROGRAMS<br />
PARKING FACILITIES AT INTERCITY RAIL STATIONS<br />
Section 14036.2 of the Government Code requires the identification of those rail<br />
passenger stations which require upgraded parking facilities <strong>to</strong> encourage<br />
au<strong>to</strong>mobile drivers <strong>to</strong> utilize available rail passenger service. Below is a<br />
description of the status of parking facilities at stations on the three intercity<br />
passenger rail routes.<br />
Much progress has been made in providing additional parking at stations on the<br />
San Joaquin Route. Projects were completed in conjunction with the construction<br />
of new stations at Modes<strong>to</strong> in 1999, Bakersfield and Merced in 2000, and<br />
Martinez in 2001. A new parking structure was completed at Lodi in 2002.<br />
A number of parking projects are now planned for San Joaquin stations. For the<br />
Emeryville station, funds are programmed <strong>to</strong> construct a 337-space parking<br />
garage. For the Richmond station, funds have been allocated <strong>to</strong> design a new<br />
800-space parking garage. For the Martinez station, funds are programmed <strong>to</strong><br />
acquire land for additional parking. At the Sacramen<strong>to</strong> station, a project started in<br />
the spring <strong>2005</strong> <strong>to</strong> upgrade surface parking lots, au<strong>to</strong> and bus circulation, and<br />
security and lighting <strong>to</strong> support the new extension of light rail service <strong>to</strong> the<br />
Amtrak station, scheduled <strong>to</strong> begin by late 20<strong>06</strong>.<br />
On the Pacific Surfliners progress has also been made in adding parking.<br />
At existing stations, additional parking was completed in 2000 in Santa Ana, and<br />
Oceanside, and in 2001 at San Luis Obispo. The Surf station, opened in 2000,<br />
included parking. A number of parking projects are now planned for<br />
Pacific Surfliner stations. The Camarillo station improvement project, scheduled<br />
<strong>to</strong> be completed in 20<strong>06</strong>, includes parking improvements. For the Fuller<strong>to</strong>n<br />
station, funds are programmed for a multi-level parking structure. At Irvine, funds<br />
are reserved <strong>to</strong> construct a parking structure at the station. For the Oceanside<br />
station, funds are programmed for a 450-space parking structure. And Oxnard has<br />
received funds <strong>to</strong> add additional parking <strong>to</strong> the station.<br />
On the Capi<strong>to</strong>l Corridor, significant additional parking capacity has also been<br />
added in the recent past <strong>to</strong> meet growing ridership. A satellite parking facility of<br />
about 80 spaces was constructed at the Roseville station in summer 2004.<br />
The interim parking lot at the Rocklin station was replaced in fall 2004 with<br />
70 permanent parking spaces and an improved access road. A new parking lot<br />
with over 100 spaces and an improved access road were constructed at the<br />
Santa Clara/Great America station in summer 2004. At the Auburn station, the<br />
24
Chapter II – Capital Program<br />
second phase of parking (about 50 spaces) was added in summer <strong>2005</strong>. While the<br />
primary upgrades at the Berkeley station that were completed in August <strong>2005</strong><br />
focused on a new platform and landscaping, the project also includes improved<br />
access for transit and parking. The new Oakland Coliseum station opened in<br />
June <strong>2005</strong> and includes parking as well as connections <strong>to</strong> Bay Area Rapid Transit<br />
(BART) and the Oakland International Airport. Funds are also programmed for a<br />
second parking lot at the Fremont-Centerville station.<br />
DECREPIT STATIONS<br />
Section 14036.2 of the Government Code requires the identification of the three<br />
most decrepit intercity rail passenger stations in the <strong>State</strong> used by trains operated<br />
by Amtrak. Webster’s New World Dictionary, Third College Edition, copyright<br />
1988, defines decrepit as "broken down or worn out by old age or long use.”<br />
The following stations are those identified by the Department as the three most<br />
decrepit:<br />
Dunsmuir (5750 Sacramen<strong>to</strong> Avenue): This station serves Amtrak’s<br />
Coast Starlight. It is an old building with the paint peeling extensively on the<br />
outside. The rain gutters are rusty and deteriorating. One of the walls has a brick<br />
section that looks deteriorated. The waiting room has two chairs and the only<br />
heater visible is in the restroom.<br />
Madera (Avenue 15½ at 29th Road): This station is a shelter in a residential<br />
industrial area. It is unattractive, with only a transit-type bench in disrepair and<br />
covered with graffiti. There is no lighting in the shelter or landscaping at the<br />
station. The parking lot is paved but deteriorated with many potholes, and many<br />
of the lights are broken. Representatives of the City, County, Amtrak and the<br />
Department are planning <strong>to</strong> move the station <strong>to</strong> a new location that is near a major<br />
road serving Madera’s population center and is more convenient for passengers<br />
than the existing station location in a warehouse area. The project will include<br />
purchase of ROW, construction of a two-lane access road, a new parking lot,<br />
platform, and shelter for the new station. The project is planned for completion in<br />
20<strong>06</strong>-07.<br />
Needles (900 Front Street): This station serves Amtrak’s Southwest Chief.<br />
The station is boarded up and fenced off from the adjacent park.<br />
Nearly $1.2 million in <strong>State</strong> and other funds are available for the planned<br />
rehabilitation of the station. Additional funding, however, is needed and is being<br />
pursued for the rehabilitation. Under Amtrak’s operating agreement, only the<br />
platform is used for passenger service at this station.<br />
25
<strong>2005</strong>-<strong>06</strong> – <strong>2015</strong>-<strong>16</strong> <strong>California</strong> <strong>State</strong> <strong>Rail</strong> <strong>Plan</strong><br />
26
Chapter III – Operations Program<br />
CHAPTER III<br />
OPERATIONS PROGRAM<br />
This chapter describes the <strong>State</strong>’s intercity rail operations program, which includes<br />
ten-year service levels and the operations financial plan. The program includes<br />
the following four components: operational efficiency and schedule planning,<br />
passenger amenities, connecting Amtrak bus services, and multimodal<br />
connectivity.<br />
OPERATIONS PROGRAM GOALS<br />
The Department’s goals for its Operations Program are as follows:<br />
• Provide cost-effective service that will reach or exceed the Department’s<br />
50 percent farebox ratio standard. (Furtherance of the three goals below<br />
will increase revenues and reduce costs, with the resulting increase in<br />
farebox ratio.)<br />
• Provide safe, reliable, and convenient intercity rail and connecting bus<br />
service on the three existing routes with enough schedule flexibility <strong>to</strong> meet<br />
a wide range of travelers’ needs; this means frequent service (up <strong>to</strong> hourly<br />
as demand requires) during business hours, and adequate coverage for<br />
leisure travelers in the evenings and weekends.<br />
• Increase service attractiveness and cus<strong>to</strong>mer satisfaction through improved<br />
OTP, and operations and service amenities.<br />
• Create a “seamless” network where intercity rail services and schedules are<br />
well connected <strong>to</strong> commuter and urban rail, transit, and airports <strong>to</strong> provide<br />
feasible trips <strong>to</strong> all major urban destinations and many <strong>to</strong>urist and rural<br />
destinations.<br />
These goals are used <strong>to</strong> guide the development of the Operations Program<br />
described below. Operations projects further one or more of these goals.<br />
TEN-YEAR INTERCITY RAIL SERVICE LEVELS AND<br />
OPERATIONS FINANCIAL PLAN<br />
Figure 3A presents the Department’s ten-year projected intercity passenger rail<br />
ridership and service levels (as well as actual ridership and service levels for<br />
2003-04 and 2004-05). The Department developed the service levels for the<br />
Pacific Surfliners, San Joaquins, and in conjunction with the CCJPA for the<br />
Capi<strong>to</strong>l Corridor. The Department is proposing the service levels for route<br />
extensions and new routes. The ridership estimates for the three existing routes<br />
were developed with Amtrak.<br />
27
<strong>2005</strong>-<strong>06</strong> – <strong>2015</strong>-<strong>16</strong> <strong>California</strong> <strong>State</strong> <strong>Rail</strong> <strong>Plan</strong><br />
Figure 3A shows that in <strong>2015</strong>-<strong>16</strong>, combined ridership on the three routes is<br />
projected <strong>to</strong> be 7.2 million. Projected service frequencies are: 13 San Diego-<br />
Los Angeles round-trips on the Pacific Surfliner, eight round-trips on the<br />
San Joaquins and 18 Oakland-Sacramen<strong>to</strong> round-trips on the Capi<strong>to</strong>l Corridor.<br />
In developing increased service levels, service extensions, and new services the<br />
Department considers:<br />
• Identified ridership demand based on actual train ridership, or in the case of<br />
extensions or new routes, based on bus ridership and overall travel demand<br />
in the corridor.<br />
• Improved cost-effectiveness of existing services, and positive<br />
cost-effectiveness of new routes.<br />
• Feasibility of increased service based on route capacity, equipment<br />
availability, and infrastructure quality.<br />
• Local support for the service.<br />
It is important <strong>to</strong> note that implementation is subject <strong>to</strong> demonstrated ridership<br />
demand, approval from Amtrak and the relevant railroad(s), availability of<br />
operating and capital funding and equipment, and completion of necessary capital<br />
projects. The service expansions are described in more detail in later chapters.<br />
Chapters VI, VII, and VIII describe the increased frequencies and service<br />
expansions for each route. Chapter X describes the new routes the Department is<br />
recommending.<br />
Figure 3B summarizes the ten-year operations financial plan. Figure 3B presents:<br />
revenue, expense and farebox ratio for existing routes; and projected <strong>State</strong> costs<br />
for existing and new routes for the ten-year period from 20<strong>06</strong>-07 through <strong>2015</strong>-<strong>16</strong>.<br />
This data was developed based on the Department’s service levels shown in<br />
Figure 3A. (Lease costs for required new equipment are included in operations<br />
costs.) The Figure also shows actual data for 2003-04 and 2004-05 and current<br />
data for <strong>2005</strong>-<strong>06</strong>. Figure 3B shows that combined revenue is projected <strong>to</strong> be<br />
$115.9 million. The farebox ratio on the Pacific Surfliners is projected <strong>to</strong> be<br />
65 percent, on the San Joaquins 49.1 percent and on the Capi<strong>to</strong>l Corridor<br />
44.6 percent. <strong>State</strong> costs for the three existing routes are projected <strong>to</strong> be<br />
$115.9 million, and new routes, $38.4 million.<br />
Figure 3C shows in graph form the projected trend of the three key performance<br />
measures (ridership, revenue and farebox ratio) on each route. These performance<br />
measures are projected <strong>to</strong> improve on all three routes over the ten-year period.<br />
Figure 3D shows in graph form the <strong>State</strong> cost per passenger, per passenger mile<br />
and per train mile for each of the three <strong>State</strong>-supported routes over the ten-year<br />
period. During this period <strong>State</strong>-cost per passenger is projected <strong>to</strong> increase<br />
slightly on the San Joaquins and decrease slightly on the Pacific Surfliners and<br />
28
Chapter III – Operations Program<br />
Capi<strong>to</strong>l Corridor. The cost per passenger is projected <strong>to</strong> be highest on the<br />
San Joaquins because the average trip length per passenger on this Route is the<br />
longest of the three routes. The <strong>State</strong> cost per passenger mile and per train mile is<br />
projected <strong>to</strong> decrease on all three routes over the ten-year period.<br />
PROGRESS IN MEETING ROUTE OBJECTIVES<br />
Figure 3E assesses the Department’s progress in meeting its principal route<br />
objectives. The Figure first compares the route objectives in the 2003-04 <strong>Plan</strong> for<br />
the <strong>2005</strong>-<strong>06</strong> year with actual results. In general, the goals for <strong>2005</strong>-<strong>06</strong> and actual<br />
results were consistent. However, actual OTP on the Pacific Surfliners and<br />
San Joaquins was below projected OTP, primarily as the result of increased<br />
freight traffic on the routes. On the Capi<strong>to</strong>l Corridor, three additional Oakland-<br />
San Jose trains were projected for <strong>2005</strong>-<strong>06</strong> that are now projected <strong>to</strong> start in<br />
20<strong>06</strong>-07. Projected ridership for <strong>2005</strong>-<strong>06</strong> was higher than actual on the<br />
Capi<strong>to</strong>l Corridor, in part due <strong>to</strong> the delay in the start of the Oakland-San Jose<br />
trains.<br />
Next, the figure compares the route objectives for 2013-14 presented in the<br />
2003-04 <strong>California</strong> <strong>State</strong> <strong>Rail</strong> <strong>Plan</strong> with those in the current <strong>2005</strong>-<strong>06</strong> <strong>California</strong><br />
<strong>State</strong> <strong>Rail</strong> <strong>Plan</strong>. These objectives are similar, although on the Pacific Surfliner<br />
Route, one less Los Angeles <strong>to</strong> San Diego round-trip is projected for 2013-14 in<br />
the <strong>2005</strong>-<strong>06</strong> <strong>Plan</strong> than in the 2003-04 <strong>Plan</strong>. On the San Joaquins one less Oakland<br />
<strong>to</strong> Bakersfield round-trip is projected for 2013-14 in the <strong>2005</strong>-<strong>06</strong> <strong>Plan</strong> than in the<br />
2003-04 <strong>Plan</strong>. And on the Capi<strong>to</strong>l Corridor, four more Oakland <strong>to</strong> San Jose<br />
round-trips are projected in the <strong>2005</strong>-<strong>06</strong> <strong>Plan</strong> than in the 2003-04 <strong>Plan</strong>.<br />
29
<strong>2005</strong>-<strong>06</strong> - <strong>2015</strong>-<strong>16</strong> <strong>California</strong> <strong>State</strong> <strong>Rail</strong> <strong>Plan</strong><br />
Figure 3A<br />
INTERCITY RAIL RIDERSHIP AND SERVICE LEVELS<br />
Federal Fiscal Years 2003-04 - <strong>2015</strong>-<strong>16</strong><br />
Actual Current Projected<br />
2003-04 2004-05 <strong>2005</strong>-<strong>06</strong> 20<strong>06</strong>-07 2007-08 2008-09 2009-10 2010-11 2011-12 2012-13 2013-14 2014-15 <strong>2015</strong>-<strong>16</strong><br />
RIDERSHIP (thousands) #<br />
Pacific Surfliners (<strong>to</strong>tal) 2,345 2,520 2,578 2,637 2,698 2,760 2,912 2,979 3,048 3,213 3,451 3,530 3,611<br />
San Joaquins 739 756 773 791 809 828 847 943 965 987 1,010 1,108 1,133<br />
Capi<strong>to</strong>l Corridor 1,<strong>16</strong>5 1,260 1,323 1,429 1,500 1,650 1,733 1,9<strong>06</strong> 2,001 2,201 2,311 2,427 2,483<br />
Total Ridership 4,249 4,536 4,674 4,857 5,007 5,238 5,492 5,828 6,014 6,401 6,772 7,<strong>06</strong>5 7,227<br />
FREQUENCIES<br />
Pacific Surfliners (<strong>to</strong>tal)<br />
San Diego-Los Angeles 11 11 11 11 11 11 12 12 12 13 13 13 13<br />
Los Angeles-Goleta 4 5 5 5 5 5 5 5 5 5 6 6 6<br />
Goleta-San Luis Obispo 1 2 2 2 2 2 2 2 2 2 3 3 3<br />
Total 11 11 11 11 11 11 12 12 12 13 13 13 13<br />
San Joaquins<br />
Oakland-Bakersfield 4 4 4 4 4 4 4 4 4 4 4 5 5<br />
Sacramen<strong>to</strong>-Bakersfield 2 2 2 2 2 2 2 3 3 3 3 3 3<br />
Total 6 6 6 6 6 6 6 7 7 7 7 8 8<br />
Capi<strong>to</strong>l Corridor<br />
San Jose-Oakland 4 4 4 7 7 9 9 11 11 13 13 <strong>16</strong> <strong>16</strong><br />
Oakland-Sacramen<strong>to</strong> 12 12 12 12 12 14 14 <strong>16</strong> <strong>16</strong> 18 18 18 18<br />
Sacramen<strong>to</strong>-Roseville 1 1 1 3 3 3 3 4 4 6 6 8 8<br />
Roseville-Auburn 1 1 1 2 2 2 2 3 3 4 4 4 4<br />
Total 12 12 12 12 12 14 14 <strong>16</strong> <strong>16</strong> 18 18 18 18<br />
Route Extensions<br />
San Francisco-San Luis Obispo 1 1 1 1 1 1 2 2 2<br />
Sacramen<strong>to</strong>-Reno 1 1 2 2 2 2 2 2<br />
New Routes<br />
Sacramen<strong>to</strong>-Redding 1 1 1 1 2 2 2<br />
Los Angeles-Indio 1 1 1 2 2 2<br />
# - Does not include ridership for route extensions, only included is ridership for existing and additional frequencies.<br />
30
Chapter III - Operations Programs<br />
Figure 3B<br />
REVENUES<br />
INTERCITY RAIL OPERATIONS FINANCIAL PLAN<br />
Federal Fiscal Years 2003-04 - <strong>2015</strong>-<strong>16</strong><br />
(Dollars in Millions)*<br />
Actual Current Projected<br />
2003-04 2004-05 <strong>2005</strong>-<strong>06</strong> 20<strong>06</strong>-07 2007-08 2008-09 2009-10 2010-11 2011-12 2012-13 2013-14 2014-15 <strong>2015</strong>-<strong>16</strong><br />
Pacific Surfliners § $ 24.7 $ 28.1 $ 28.4 $ 29.4 $ 30.5 $ 31.6 $ 33.2 $ 34.3 $ 35.4 $ 37.9 $ 42.5 $ 43.9 $ 45.4<br />
San Joaquins $ 21.9 $ 23.3 $ 23.9 $ 25.0 $ 26.1 $ 27.3 $ 28.6 $ 31.6 $ 33.0 $ 34.5 $ 36.1 $ 38.9 $ 40.7<br />
Capi<strong>to</strong>l Corridor $ 13.2 $ 15.2 $ <strong>16</strong>.0 $ <strong>16</strong>.9 $ 17.7 $ 19.4 $ 20.4 $ 22.3 $ 23.4 $ 25.6 $ 26.8 $ 28.4 $ 29.8<br />
Total Revenues $ 59.8 $ 66.6 $ 68.3 $ 71.3 $ 74.3 $ 78.3 $ 82.2 $ 88.2 $ 91.8 $ 98.0 $ 105.4 $ 111.2 $ 115.9<br />
EXPENSES<br />
Pacific Surfliners § $ 45.1 $ 49.2 $ 49.0 $ 49.2 $ 49.4 $ 49.7 $ 52.4 $ 53.9 $ 55.6 $ 59.4 $ 65.8 $ 67.7 $ 69.8<br />
San Joaquins $ 49.3 $ 50.8 $ 51.1 $ 52.7 $ 54.4 $ 56.2 $ 58.0 $ 65.7 $ 67.8 $ 70.0 $ 72.2 $ 80.4 $ 83.0<br />
Capi<strong>to</strong>l Corridor $ 35.9 $ 39.3 $ 41.1 $ 43.5 $ 44.8 $ 48.2 $ 49.7 $ 53.5 $ 55.1 $ 59.4 $ 61.2 $ 64.8 $ 66.7<br />
Total Expenses $ 130.3 $ 139.3 $ 141.2 $ 145.4 $ 148.6 $ 154.1 $ <strong>16</strong>0.1 $ 173.1 $ 178.5 $ 188.8 $ 199.2 $ 212.9 $ 219.5<br />
FAREBOX RATIO<br />
Pacific Surfliners § 54.8% 57.1% 58.0% 59.8% 61.7% 63.6% 63.4% 63.6% 63.7% 63.8% 64.6% 64.8% 65.0%<br />
San Joaquins 44.4% 45.9% 46.8% 47.4% 48.0% 48.6% 49.3% 48.1% 48.7% 49.3% 50.0% 48.4% 49.0%<br />
Capi<strong>to</strong>l Corridor 36.8% 38.7% 38.9% 38.9% 39.5% 40.2% 41.0% 41.7% 42.5% 43.1% 43.8% 43.8% 44.7%<br />
STATE COSTS •<br />
Existing Routes<br />
Pacific Surfliners § $ 20.7 $ 21.2 $ 20.9 $ 20.9 $ 19.2 $ 18.4 $ 19.5 $ 21.7 $ 22.1 $ 23.5 $ 25.3 $ 25.8 $ 26.4<br />
San Joaquins $ 27.7 $ 27.4 $ 27.8 $ 27.8 $ 29.5 $ 30.4 $ 31.4 $ 38.0 $ 39.1 $ 40.3 $ 41.5 $ 48.8 $ 50.2<br />
Capi<strong>to</strong>l Corridor $ 23.1 $ 24.1 $ 24.4 $ 24.4 $ 26.3 $ 29.6 $ 30.1 $ 33.5 $ 33.9 $ 37.4 $ 37.9 $ 39.8 $ 40.3<br />
Sub Total $ 71.5 $ 72.7 $ 73.1 $ 73.1 $ 75.0 $ 78.4 $ 81.0 $ 93.2 $ 95.1 $ 101.2 $ 104.7 $ 114.4 $ 1<strong>16</strong>.9<br />
Equipment-Heavy Overhaul $ 10.1 $ 13.5 $ 13.8 $ 14.0 $ 13.8 $ 9.3 $ 13.1 $ 12.6 $ 13.6 $ 14.6 $ 15.6 $ <strong>16</strong>.0 $ <strong>16</strong>.0<br />
Total $ 81.6 $ 86.2 $ 86.9 $ 87.1 $ 88.8 $ 87.7 $ 94.1 $ 105.8 $ 108.7 $ 115.8 $ 120.3 $ 130.4 $ 132.9<br />
Route Extensions<br />
San Francisco-San Luis Obispo $ 7.3 $ 7.4 $ 7.5 $ 7.6 $ 7.8 $ 7.9 $ 13.5 $ 13.8 $ 13.8<br />
Sacramen<strong>to</strong>-Reno $ 5.3 $ 5.3 $ 5.3 $ 8.2 $ 8.2 $ 8.3 $ 8.4 $ 8.4<br />
New Routes<br />
Sacramen<strong>to</strong>-Redding $ 4.6 $ 4.6 $ 4.7 $ 4.8 $ 7.4 $ 7.4 $ 7.5<br />
Los Angeles-Indio $ 4.2 $ 4.2 $ 4.2 $ 8.7 $ 8.7 $ 8.7<br />
Total $ 7.3 $ 12.7 $ 17.4 $ 21.7 $ 24.9 $ 25.1 $ 37.9 $ 38.3 $ 38.4<br />
Existing and New Routes<br />
Grand Total $ 81.6 $ 86.2 $ 86.9 $ 87.1 $ 96.1 $ 100.4 $ 111.5 $ 127.5 $ 133.6 $ 140.9 $ 158.2 $ <strong>16</strong>8.7 $ 171.3<br />
* - Current year dollars shown.<br />
• - Lease costs for equipment needed <strong>to</strong> operate additional frequencies and routes are included.<br />
§ - Reflects Reflects Revenues, Expenses, Farebox Ratio and <strong>State</strong> Costs for state supported 70% portion of service. (67% in 2003-04.)<br />
31
<strong>2005</strong>-<strong>06</strong> – <strong>2015</strong>-<strong>16</strong> <strong>California</strong> <strong>State</strong> <strong>Rail</strong> <strong>Plan</strong><br />
Figure 3C<br />
Performance by Route<br />
Ridership<br />
4,000,000<br />
3,000,000<br />
2,000,000<br />
1,000,000<br />
-<br />
2000-<br />
01<br />
2001-<br />
02<br />
Actual Results<br />
2002-<br />
03<br />
2003-<br />
04<br />
2004-<br />
05<br />
<strong>2005</strong>-<br />
<strong>06</strong><br />
20<strong>06</strong>-<br />
07<br />
Projected in <strong>2005</strong>-<strong>06</strong> <strong>California</strong> <strong>State</strong> <strong>Rail</strong> <strong>Plan</strong><br />
2007-<br />
08<br />
2008-<br />
09<br />
2009-<br />
10<br />
2010-<br />
11<br />
2011-<br />
12<br />
2012-<br />
13<br />
2013-<br />
14<br />
2014-<br />
15<br />
<strong>2015</strong>-<br />
<strong>16</strong><br />
$50<br />
Revenue<br />
(in Millions)<br />
$40<br />
$30<br />
$20<br />
$10<br />
$-<br />
2000-<br />
01<br />
2001-<br />
02<br />
Actual Results<br />
2002-<br />
03<br />
2003-<br />
04<br />
2004-<br />
05<br />
<strong>2005</strong>-<br />
<strong>06</strong><br />
20<strong>06</strong>-<br />
07<br />
Projected in <strong>2005</strong>-<strong>06</strong> <strong>California</strong> <strong>State</strong> <strong>Rail</strong> <strong>Plan</strong><br />
2007-<br />
08<br />
2008-<br />
09<br />
2009-<br />
10<br />
2010-<br />
11<br />
2011-<br />
12<br />
2012-<br />
13<br />
2013-<br />
14<br />
2014-<br />
15<br />
<strong>2015</strong>-<br />
<strong>16</strong><br />
Farebox Ratio<br />
70%<br />
60%<br />
50%<br />
40%<br />
30%<br />
20%<br />
10%<br />
0%<br />
2000-<br />
01<br />
2001-<br />
02<br />
Actual Results<br />
2002-<br />
03<br />
2003-<br />
04<br />
2004-<br />
05<br />
<strong>2005</strong>-<br />
<strong>06</strong><br />
20<strong>06</strong>-<br />
07<br />
Projected in <strong>2005</strong>-<strong>06</strong> <strong>California</strong> <strong>State</strong> <strong>Rail</strong> <strong>Plan</strong><br />
2007-<br />
08<br />
2008-<br />
09<br />
2009-<br />
10<br />
2010-<br />
11<br />
2011-<br />
12<br />
2012-<br />
13<br />
2013-<br />
14<br />
2014-<br />
15<br />
<strong>2015</strong>-<br />
<strong>16</strong><br />
Pacific Surfliner Route - <strong>State</strong> Supported Portion San Joaquin Route Capi<strong>to</strong>l Corridor<br />
32
Chapter III – Operations Program<br />
Figure 3D<br />
<strong>State</strong> Costs by Route<br />
<strong>State</strong> Cost Per Passenger<br />
$50<br />
$40<br />
$30<br />
$20<br />
$10<br />
$-<br />
2000-<br />
01<br />
2001-<br />
02<br />
Actual Results<br />
2002-<br />
03<br />
2003-<br />
04<br />
2004-<br />
05<br />
<strong>2005</strong>-<br />
<strong>06</strong><br />
20<strong>06</strong>-<br />
07<br />
Projected in <strong>2005</strong>-<strong>06</strong> <strong>California</strong> <strong>State</strong> <strong>Rail</strong> <strong>Plan</strong><br />
2007-<br />
08<br />
2008-<br />
09<br />
2009-<br />
10<br />
2010-<br />
11<br />
2011-<br />
12<br />
2012-<br />
13<br />
2013-<br />
14<br />
2014-<br />
15<br />
<strong>2015</strong>-<br />
<strong>16</strong><br />
<strong>State</strong> Cost Per Passenger Mile<br />
$0.35<br />
$0.30<br />
$0.25<br />
$0.20<br />
$0.15<br />
$0.10<br />
$0.05<br />
$-<br />
2000-<br />
01<br />
2001-<br />
02<br />
Actual Results<br />
2002-<br />
03<br />
2003-<br />
04<br />
2004-<br />
05<br />
<strong>2005</strong>-<br />
<strong>06</strong><br />
20<strong>06</strong>-<br />
07<br />
Projected in <strong>2005</strong>-<strong>06</strong> <strong>California</strong> <strong>State</strong> <strong>Rail</strong> <strong>Plan</strong><br />
2007-<br />
08<br />
2008-<br />
09<br />
2009-<br />
10<br />
2010-<br />
11<br />
2011-<br />
12<br />
2012-<br />
13<br />
2013-<br />
14<br />
2014-<br />
15<br />
<strong>2015</strong>-<br />
<strong>16</strong><br />
<strong>State</strong> Cost Per Train Mile<br />
$35<br />
$30<br />
$25<br />
$20<br />
$15<br />
$10<br />
$-<br />
$5<br />
2000-<br />
01<br />
2001-<br />
02<br />
Actual Results<br />
2002-<br />
03<br />
2003-<br />
04<br />
2004-<br />
05<br />
<strong>2005</strong>-<br />
<strong>06</strong><br />
20<strong>06</strong>-<br />
07<br />
Projected in <strong>2005</strong>-<strong>06</strong> <strong>California</strong> <strong>State</strong> <strong>Rail</strong> <strong>Plan</strong><br />
2007-<br />
08<br />
2008-<br />
09<br />
2009-<br />
10<br />
2010-<br />
11<br />
2011-<br />
12<br />
2012-<br />
13<br />
2013-<br />
14<br />
2014-<br />
15<br />
<strong>2015</strong>-<br />
<strong>16</strong><br />
Pacific Surfliner Route - <strong>State</strong> Supported Portion San Joaquin Route Capi<strong>to</strong>l Corridor<br />
33
<strong>2005</strong>-<strong>06</strong> – <strong>2015</strong>-<strong>16</strong> <strong>California</strong> <strong>State</strong> <strong>Rail</strong> <strong>Plan</strong><br />
Figure 3E<br />
Ridership<br />
(thousands)<br />
Revenue<br />
(millions)<br />
ROUTE OBJECTIVES BY CORRIDOR<br />
FFY 2003-04 <strong>2005</strong>-<strong>06</strong> 2013-14 <strong>2015</strong>-<strong>16</strong><br />
Actual<br />
Results<br />
2003-04<br />
<strong>Rail</strong> <strong>Plan</strong><br />
Actual<br />
Results<br />
Pacific Surfliner Route<br />
* Data from <strong>2005</strong>-<strong>06</strong> Corridor Business <strong>Plan</strong>s<br />
2003-04<br />
<strong>Rail</strong> <strong>Plan</strong><br />
<strong>2005</strong>-<strong>06</strong><br />
<strong>Rail</strong> <strong>Plan</strong><br />
<strong>2005</strong>-<strong>06</strong><br />
<strong>Rail</strong> <strong>Plan</strong><br />
2,345 2,548 2,578 3,503 3,451 3,611<br />
$24.7 $28.7 $28.4 $43.6 $42.5 $45.4<br />
Farebox Ratio 54.8% 59.1% 58.0% 61.2% 64.7% 65.0%<br />
On Time<br />
Performance<br />
Frequency:<br />
Los Angeles-<br />
San Diego<br />
Los Angeles-<br />
Goleta<br />
Ridership<br />
(thousands)<br />
Revenue<br />
(millions)<br />
87% 83%* 73% 90% 90% 90%<br />
11 11 11 14 13 13<br />
4 5 5 6 6 6<br />
San Joaquin Route<br />
739 773 773 1,082 1,010 1,133<br />
$21.9 $23.4 $23.9 $33.9 $36.1 $40.7<br />
Farebox Ratio 44.5% 44.6% 46.8% 42.4% 50.0% 49.1%<br />
On Time<br />
Performance<br />
Frequency:<br />
Oakland-<br />
Bakersfield<br />
Sacramen<strong>to</strong>-<br />
Bakersfield<br />
Ridership<br />
(thousands)<br />
Revenue<br />
(millions)<br />
56% 85%* 64% 90% 90% 90%<br />
4 4 4 5 4 5<br />
2 2 2 3 3 3<br />
Capi<strong>to</strong>l Corridor<br />
1,<strong>16</strong>5 1,557 1,323 2,352 2,311 2,483<br />
$13.2 $<strong>16</strong>.9 $<strong>16</strong>.0 $29.2 $26.8 $29.8<br />
Farebox Ratio 36.8% 41.4% 38.9% 46.9% 43.9% 44.6%<br />
On Time<br />
Performance<br />
Frequency:<br />
Sacramen<strong>to</strong>-<br />
Oakland<br />
Oakland-<br />
San Jose<br />
86% 90%* 85% 90% 90% 90%<br />
12 12 12 18 18 18<br />
4 7 4 9 13 <strong>16</strong><br />
34
Chapter III – Operations Program<br />
ADMINISTRATION AND MARKETING COSTS<br />
Figure 3F shows <strong>State</strong> support levels for administration and marketing costs for<br />
2003-04 through <strong>2005</strong>-<strong>06</strong>. These costs have remained constant over the three-year<br />
period.<br />
Figure 3F<br />
Intercity <strong>Rail</strong> Administration and Marketing Costs<br />
($ in Millions)<br />
Actual<br />
Current<br />
FFY 2003-04 2004-05 <strong>2005</strong>-<strong>06</strong><br />
STATE SUPPORT<br />
Pacific Surfliners<br />
Administration $1.5 $1.5 $1.5<br />
Marketing $2.3 $2.3 $2.3<br />
Totals $3.8 $3.8 $3.8<br />
San Joaquins<br />
Administration $1.3 $1.3 $1.3<br />
Marketing $1.5 $1.5 $1.5<br />
Totals $2.8 $2.8 $2.8<br />
Capi<strong>to</strong>l Corridor<br />
Administration $1.3 $1.3 $1.3<br />
Marketing $1.2 $1.2 $1.2<br />
Totals $2.5 $2.5 $2.5<br />
Totals - All Routes<br />
Administration $4.1 $4.1 $4.1<br />
Marketing $5.0 $5.0 $5.0<br />
Grand Total $9.1 $9.1 $9.1<br />
OPERATIONS PROGRAM<br />
The operations, marketing and capital programs are all interrelated. The specific<br />
focus of the operations program is: operational efficiency and schedule planning,<br />
passenger amenities, connecting Amtrak bus services, multimodal connectivity,<br />
the <strong>Rail</strong> 2 <strong>Rail</strong> Program, and airport access. Each of these areas is discussed<br />
below.<br />
OPERATIONAL EFFICIENCY AND SCHEDULE PLANNING<br />
Improvements in operational efficiency are heavily dependent on the<br />
implementation of the ten-year capital improvement program discussed in<br />
Chapter II. For example, improved OTP is closely connected <strong>to</strong> completion of<br />
track projects <strong>to</strong> increase capacity. The ten-year OTP goal for all three routes is<br />
90 percent. On the Capi<strong>to</strong>l Corridor where much of the Route is already doubletrack,<br />
the goal is <strong>to</strong> maintain OTP at 90 percent. However, on the<br />
Pacific Surfliners and San Joaquins, certain double or triple-track and siding<br />
projects will need <strong>to</strong> be completed before consistently high OTP will be possible.<br />
35
<strong>2005</strong>-<strong>06</strong> – <strong>2015</strong>-<strong>16</strong> <strong>California</strong> <strong>State</strong> <strong>Rail</strong> <strong>Plan</strong><br />
Although recent OTP has been negatively impacted by increased freight traffic<br />
statewide; capital projects are planned on all three Routes <strong>to</strong> increase capacity and<br />
OTP. Operational efficiency will also be improved in the ten-year period with<br />
capital projects <strong>to</strong> purchase equipment, construct new or improve existing stations,<br />
build maintenance facilities, and improve track and signal infrastructure.<br />
Schedule planning is an important component of the operations program.<br />
The Department reviews train schedules <strong>to</strong> improve ridership, yield, and<br />
operational efficiency, particularly in regard <strong>to</strong> equipment usage and crew<br />
schedules. Train schedules should provide optimum flexibility and coverage<br />
given the number of round-trips on the route. For example, passengers should be<br />
able <strong>to</strong> make convenient business or day trips <strong>to</strong> the major urban destinations such<br />
as San Francisco, Oakland, Los Angeles, Sacramen<strong>to</strong>, and San Diego.<br />
Travel patterns have become much more complex with population growth and<br />
business centers moving out of cities. To serve traveler’s needs, it has become<br />
much more important for intercity rail <strong>to</strong> connect <strong>to</strong> other systems in order <strong>to</strong> serve<br />
a variety of travel patterns. Thus, the Department works <strong>to</strong> coordinate with other<br />
rail and transit providers and adjust schedules whenever possible <strong>to</strong> improve<br />
connections.<br />
The Department also works with Amtrak <strong>to</strong> increase yields and contain costs<br />
through analysis of segment profitability, yield pricing and other mechanisms, and<br />
establish fares that maximize yields and ridership. This effort is coordinated with<br />
the market research and ridership/revenue modeling work described in Chapter IV.<br />
Additionally, the Department moni<strong>to</strong>rs Amtrak billings for accuracy.<br />
Another potential avenue for reducing costs and increasing service quality is the<br />
competitive bidding of either the entire intercity rail service function or of specific<br />
ancillary services. The Department has examined these options in the past and<br />
will continue <strong>to</strong> study the feasibility of competitively bidding rail services. This is<br />
a timely issue as there has been strong pressure from the Federal administration<br />
and many in Congress <strong>to</strong> introduce competition <strong>to</strong> Amtrak. Amtrak’s own<br />
strategic reform initiatives concerning competition are discussed in the “Amtrak<br />
<strong>Plan</strong>ning Section” of Chapter XI.<br />
PASSENGER AMENITIES<br />
On Board Amenities<br />
Important on board passenger amenities include: food service, reserved seating,<br />
and checked baggage. Food service varies on each of the three routes, however all<br />
trains have a food service car that provides table seating, and snacks, drinks and<br />
beer and wine. The San Joaquins also offer full meals. The food is oriented<br />
<strong>to</strong>wards quality at an affordable price. Food service is evaluated and adjusted on<br />
an ongoing basis <strong>to</strong> improve quality and yield. Reserved seating is provided on<br />
the San Joaquins and in Business Class Service on the Pacific Surfliners.<br />
36
Chapter III – Operations Program<br />
On the San Joaquins, seating reservations are made at the time of ticket purchase.<br />
The Pacific Surfliners offer Business Class Service, which includes deluxe<br />
reserved coach service with large reclining seats and extra legroom. At seat<br />
service includes food, beverages, and a newspaper. The Capi<strong>to</strong>l Corridor offers a<br />
“quiet car” per train <strong>to</strong> be reserved for passengers wanting <strong>to</strong> sleep or relax.<br />
The CCJPA is also exploring a Business/Cus<strong>to</strong>m Class car. Checked baggage is<br />
available on the San Joaquins at all staffed stations and on the Pacific Surfliners at<br />
most staffed stations.<br />
Passenger amenities are also determined by rolling s<strong>to</strong>ck design. The Northern<br />
<strong>California</strong> car fleet of <strong>California</strong> Cars and the Surfliner cars on the<br />
Pacific Surfliner Route were designed with superior passenger amenities including<br />
on board bicycle facilities, and full handicapped accessibility. Current upgrades<br />
on the <strong>California</strong> Car fleet include 110-volt convenience outlets at every seat and<br />
replacement of the outdated destination sign system with new destination signs<br />
and an au<strong>to</strong>mated passenger information system. Also, the Department<br />
is exploring the feasibility of providing on board internet access. The CCJPA has<br />
initiated a Wi-Fi wireless internet access pilot program. In the longer term, the<br />
Department is working with Amtrak <strong>to</strong> design “next-generation” equipment that<br />
will increase on board amenities as well as operational efficiency.<br />
Station Passenger Amenities<br />
Passenger amenities at stations are also very important. The ten-year capital<br />
program has a number of station improvement and parking projects and some key<br />
new station projects such as S<strong>to</strong>ck<strong>to</strong>n on the San Joaquins. Over the years, most<br />
stations have been rebuilt or significantly upgraded, thus the current focus is now<br />
on upgrades, not new stations. Near-term projects involve next-generation ticket<br />
machines on the Pacific Surfliners <strong>to</strong> allow cross ticketing between Amtrak and<br />
Metrolink. Also, the Department is supportive of mixed-use development at or<br />
near stations that can improve access <strong>to</strong> food, entertainment and transportation<br />
services.<br />
Passenger Information<br />
Passenger information serves both a marketing and operational function.<br />
The Department is continually looking for new ways <strong>to</strong> inform cus<strong>to</strong>mers and<br />
potential cus<strong>to</strong>mers about: rail service; transit, air and au<strong>to</strong> connections <strong>to</strong> trains<br />
and connecting buses; and locations served by trains and connecting buses.<br />
Passenger information devices include printed materials; signage and displays at<br />
stations, bus s<strong>to</strong>ps and on streets and highways; an Internet web site; and<br />
telephone information. In the last few years, additional emphasis has been placed<br />
on providing information on the “<strong>to</strong>tal trip” including extensive information on<br />
destinations.<br />
37
<strong>2005</strong>-<strong>06</strong> – <strong>2015</strong>-<strong>16</strong> <strong>California</strong> <strong>State</strong> <strong>Rail</strong> <strong>Plan</strong><br />
The train timetable for all three routes provides the most essential passenger<br />
information. The timetable is updated with every schedule change and provides<br />
extensive passenger information including: train and connecting Amtrak bus<br />
schedules; listing of connecting transit services, including detailed information on<br />
commuter rail connections; and station information.<br />
Passenger information is provided at train stations and bus s<strong>to</strong>ps. The timetable is<br />
displayed on “Info Posts” at all train stations (on the platform) and bus s<strong>to</strong>ps<br />
(at the s<strong>to</strong>p). In the fall of 2003, new passenger information displays were<br />
installed at all staffed and unstaffed stations on the San Joaquins in the Valley.<br />
These displays include local area maps showing hotels, restaurants, rental car<br />
agencies and other services near the station along with phone numbers.<br />
To improve passenger information at stations, electronic Passenger Information<br />
Display Systems on all three routes have been installed or will be completed by<br />
the end of <strong>2005</strong>. They provide real-time audio and visual information on train<br />
arrivals and departures. This system is especially helpful at unstaffed stations.<br />
To direct persons <strong>to</strong> Amtrak stations, the Department is upgrading pathfinder signs<br />
that direct au<strong>to</strong>mobile drivers from adjacent <strong>State</strong> highways and local roads <strong>to</strong><br />
Amtrak stations. The Department has been installing new signs on <strong>State</strong> highways<br />
pointing <strong>to</strong> train stations on all three <strong>State</strong>-supported routes. The Department<br />
places signs along local streets and roads in coordination with local agencies.<br />
On the trains, passenger information is also being improved. The Department is<br />
planning <strong>to</strong> replace the outdated destination sign system on the <strong>California</strong> Car fleet<br />
with new destination signs and an au<strong>to</strong>mated passenger information system.<br />
The new system will incorporate up-<strong>to</strong>-date passenger information system<br />
technology that meets all current standards for audible and visual messaging,<br />
real-time service messages, au<strong>to</strong>mated train location and text uploading,<br />
diagnostics, and animated graphics. This system will be applied <strong>to</strong> all 78 railcars<br />
in the Northern <strong>California</strong> fleet. The Department plans <strong>to</strong> complete the work by<br />
20<strong>06</strong>-07.<br />
In 1996, the Department established its Amtrak <strong>California</strong> web site,<br />
www.amtrakcalifornia.com, which contains information specifically oriented<br />
<strong>to</strong>wards the <strong>California</strong> routes. Information on fare promotions and discounts,<br />
Amtrak <strong>California</strong> news, an easy-order publications page, and downloadable<br />
timetables is included. Also local information <strong>to</strong> aid trip planning, including<br />
station information, local transit information and links <strong>to</strong> local transit opera<strong>to</strong>rs are<br />
included. In <strong>2005</strong>, the web site was redesigned with a “new look” and <strong>to</strong> be more<br />
user-friendly. The Amtrak <strong>California</strong> web site provides direct links <strong>to</strong> Amtrak’s<br />
national web site, www.amtrak.com for general information, on-line reservations<br />
and ticket purchase for all Amtrak trains, and Amtrak <strong>to</strong>ur and vacation package<br />
information. The Amtrak <strong>California</strong> web site also has a direct link <strong>to</strong> our partner<br />
the CCJPA’s web site, www.amtrakcapi<strong>to</strong>ls.com.<br />
38
Chapter III – Operations Program<br />
Amtrak’s national telephone information number, 1-800-USA-RAIL, is the most<br />
widely used source of information for Amtrak <strong>California</strong> cus<strong>to</strong>mers. Amtrak has<br />
converted all calls within <strong>California</strong>’s major markets <strong>to</strong> a Voice Response Unit<br />
(VRU) au<strong>to</strong>mated system designed <strong>to</strong> eliminate inaccuracies and cut costs.<br />
As a result, complaints about routine errors have dropped significantly.<br />
CONNECTING AMTRAK BUS SERVICES<br />
All three routes have connecting Amtrak bus service. On the San Joaquins,<br />
the bus network is an essential element of the system, with at least 65 percent of<br />
San Joaquin passengers using at least one connecting bus at the beginning or end<br />
of their trips. Buses are used <strong>to</strong> reach markets not served by rail. The Amtrak<br />
buses provide guaranteed connections; if a train is late, the bus connection is<br />
guaranteed. The buses are required <strong>to</strong> have a high standard of comfort, including<br />
ample legroom and reclining seats.<br />
The Department is continually evaluating new Amtrak connecting bus routes, as<br />
well as expansions of existing routes, <strong>to</strong> determine what route changes might<br />
increase ridership and improve the financial performance of the service.<br />
In evaluating a route, many outside fac<strong>to</strong>rs that influence ridership, such as<br />
economic trends and competing modes, are considered. The Department is also<br />
working <strong>to</strong> increase cus<strong>to</strong>mer amenities on the buses.<br />
Figure 3G shows the performance of currently operated bus routes for<br />
FY 2003-2004 and 2004-<strong>2005</strong>. The column headed Net Generated Revenue<br />
requires an explanation: few connecting bus passengers would use the train if the<br />
feeder bus did not exist; therefore, Generated Revenue represents the <strong>to</strong>tal<br />
bus/train revenue generated by such passengers. The cost of the bus service is<br />
deducted from Generated Revenue <strong>to</strong> determine Net Generated Revenue, which<br />
shows the economic impact of the bus service on the rail network in <strong>California</strong>.<br />
Amtrak estimates that, of all bus trips operated, only 2.8 trips per day operated<br />
without any passengers, representing 1.2 percent of all trips.<br />
All routes with a positive Net Generated Revenue serve <strong>to</strong> link communities with<br />
the train route, and <strong>to</strong> contribute <strong>to</strong> the economic success of the rail network.<br />
If a route has a negative Net Generated Revenue, the Department evaluates the<br />
reasons for this performance. If the service is relatively new, negative results may<br />
occur during its initial growth period. If ridership and revenue continue <strong>to</strong><br />
increase, the service will be continued <strong>to</strong> allow further growth, even though the<br />
service is not yet making a positive economic contribution <strong>to</strong> the rail network.<br />
If ridership and revenue do not increase, the service is reviewed for potential<br />
withdrawal <strong>to</strong> allow more effective use of <strong>State</strong> funding.<br />
39
<strong>2005</strong>-<strong>06</strong> – <strong>2015</strong>-<strong>16</strong> <strong>California</strong> <strong>State</strong> <strong>Rail</strong> <strong>Plan</strong><br />
Figure 3G<br />
AMTRAK CONNECTING BUS PERFORMANCE IN CALIFORNIA<br />
Bus<br />
Route<br />
Number Bus Route End Points Note<br />
Bus One-Way<br />
Passengers Bus Trips<br />
Oc<strong>to</strong>ber 2004 through September <strong>2005</strong><br />
Passengers<br />
per Bus Trip<br />
Net Generated<br />
Revenue<br />
Net Generated<br />
Revenue per<br />
Bus Passenger<br />
1 Los Angeles-Bakersfield 236,860 18,290 13.0 $ 5,497,381 $ 23.21<br />
3 S<strong>to</strong>ck<strong>to</strong>n-Redding 74,904 7,450 10.1 $ 896,418 $ 11.97<br />
4 Los Angeles-Santa Barbara 11,344 766 14.8 $ 208,982 $ 18.42<br />
6 S<strong>to</strong>ck<strong>to</strong>n-San Jose 20,727 4,746 4.4 $ (99,660) $ (4.81)<br />
7 Martinez-McKinleyville 39,341 7,329 5.4 $ <strong>16</strong>4,179 $ 4.17<br />
9 Bakersfield-Las Vegas 13,634 1,461 9.3 $ (26,982) $ (1.98)<br />
10 Bakersfield-Santa Barbara 25,800 2,923 8.8 $ 196,037 $ 7.60<br />
12 Bakersfield-Palmdale 11,346 1,460 7.8 $ (3,261) $ (0.29)<br />
17A Santa Barbara-Paso Robles 25,748 2,239 11.5 $ 350,057 $ 13.60<br />
17B Paso Robles-San Francisco <strong>16</strong>,587 733 22.6 $ 711,423 $ 42.89<br />
18 Hanford-San Luis Obispo 14,771 1,462 10.1 $ 53,786 $ 3.64<br />
19 Bakersfield-Indio 33,255 2,924 11.4 $ 265,<strong>06</strong>9 $ 7.97<br />
20A Sacramen<strong>to</strong>-Nevada City/Auburn 1 5,817 3,650 1.6 $ (46,460) $ (7.99)<br />
20B Sacramen<strong>to</strong>-Sparks 44,831 4,380 10.2 $ 256,556 $ 5.72<br />
21A San Jose - Monterey 2 2,570 496 5.2 $ (25,699) $ (10.00)<br />
21B Oakland - San Jose 17,697 2,552 6.9 $ (51,956) $ (2.94)<br />
21C San Jose- Santa Barbara 11,947 730 <strong>16</strong>.4 $ 54,754 $ 4.58<br />
23 Sacramen<strong>to</strong>-Carson City <strong>16</strong>,472 2,190 7.5 $ (93,699) $ (5.69)<br />
34 S<strong>to</strong>ck<strong>to</strong>n-San Francisco Ferry 6,226 1,460 4.3 $ (109,399) $ (17.57)<br />
36 Oakland - San Luis Obispo 3 11,912 662 18.0 $ 275,635 $ 23.14<br />
TOTALS 641,789 67,903 $ 8,473,<strong>16</strong>2<br />
Oc<strong>to</strong>ber 2003 through September 2004<br />
1 Los Angeles-Bakersfield 225,388 12,158 18.5 $ 5,783,724 $ 25.66<br />
3 S<strong>to</strong>ck<strong>to</strong>n-Redding 94,073 6,833 13.8 $ 1,499,361 $ 15.94<br />
4 Los Angeles-Santa Barbara 11,170 735 15.2 $ 198,677 $ 17.79<br />
6 S<strong>to</strong>ck<strong>to</strong>n-San Jose/Santa Cruz 4 44,883 5,125 8.8 $ (22,372) $ (0.50)<br />
7 Martinez-McKinleyville 37,980 5,899 6.4 $ 15,890 $ 0.42<br />
9 Bakersfield-Las Vegas 15,154 1,465 10.3 $ 49,380 $ 3.26<br />
10 Bakersfield-Santa Barbara 25,777 2,257 11.4 $ 244,833 $ 9.50<br />
12 Bakersfield-Palmdale 8,683 1,098 7.9 $ (53,143) $ (6.12)<br />
17A Santa Barbara-Paso Robles 24,236 2,685 9.0 $ 261,488 $ 10.79<br />
17C Paso Robles-San Francisco 19,474 732 26.6 $ 157,9<strong>16</strong> $ 8.11<br />
18 Hanford-San Luis Obispo 15,151 1,473 10.3 $ 5,250 $ 0.35<br />
19 Bakersfield-Indio 32,671 2,935 11.1 $ 320,302 $ 9.80<br />
20A Sacramen<strong>to</strong>-Nevada City 6,656 3,660 1.8 $ (153,915) $ (23.12)<br />
20B Sacramen<strong>to</strong>-Sparks 43,139 3,540 12.2 $ 363,227 $ 8.42<br />
20C Sacramen<strong>to</strong>-Roseville/Auburn 5 3,883 852 4.6 $ 17,743 $ 4.57<br />
21A San Jose - Monterey 1,996 732 2.7 $ (58,945) $ (29.53)<br />
21B Oakland - San Jose 17,<strong>16</strong>4 3,496 4.9 $ (41,483) $ (2.42)<br />
21C San Jose- Santa Barbara 11,439 732 15.6 $ 31,979 $ 2.80<br />
22 San Jose-Santa Cruz 4 5,118 3,920 1.3 $ (141,803) $ (27.71)<br />
23 Sacramen<strong>to</strong>-Carson City 18,147 2,196 8.3 $ (14,837) $ (0.82)<br />
34 S<strong>to</strong>ck<strong>to</strong>n-San Francisco Ferry 8,764 1,465 6.0 $ 47,541 $ 5.42<br />
TOTALS 670,946 63,988 $ 8,510,814<br />
1 - Effective June <strong>2005</strong>, Nevada City service discontinued.<br />
Auburn-Grass Valley service provided by Highway 49 Express (Gold Country Stage).<br />
2 - Effective June <strong>2005</strong>, Route 21A was discontinued.<br />
3 - Effective November 2004, Route 36 service was inaugurated.<br />
4 - Effective April 2004, San Jose-Santa Cruz service discontinued (Route 22 and the San Jose-Santa Cruz portion of Route 6).<br />
San Jose-Santa Cruz service provided by Highway 17 Express Route (Santa Cruz Metropolitan Transit District).<br />
5 - Effective July 2004, Route 20C combined with Route 20A.<br />
40
Chapter III – Operations Program<br />
MULTIMODAL CONNECTIVITY<br />
The Department strives <strong>to</strong> make the intercity passenger rail system as “seamless”<br />
as possible with excellent connectivity <strong>to</strong> other transportation systems. Designing<br />
for connectivity enters in<strong>to</strong> virtually every aspect of operations, marketing and<br />
capital planning. The Department will continue <strong>to</strong> improve connectivity wherever<br />
possible by expanding the programs discussed below, and implementing new<br />
programs.<br />
Amtrak: The <strong>State</strong>-supported routes connect with each other and with Amtrak’s<br />
national intercity rail passenger network. Many passengers use the <strong>State</strong>supported<br />
routes as part of a longer rail trip. Coordination of schedules with other<br />
services generates additional ridership and can improve overall efficiency.<br />
The Pacific Surfliners connect <strong>to</strong> the: San Joaquins and Capi<strong>to</strong>l Corridor<br />
(via Amtrak bus), Coast Starlight, Southwest Chief, and Sunset Limited.<br />
The San Joaquins connect <strong>to</strong> the: Pacific Surfliner (via Amtrak bus),<br />
Capi<strong>to</strong>l Corridor, Coast Starlight, <strong>California</strong> Zephyr, Sunset Limited, and<br />
Southwest Chief. The Capi<strong>to</strong>l Corridor connects <strong>to</strong>: the San Joaquins,<br />
Pacific Surfliners (via Amtrak bus), Coast Starlight and <strong>California</strong> Zephyr.<br />
Commuter and Urban <strong>Rail</strong>: The Department and the CCJPA work <strong>to</strong> provide<br />
convenient connections between Amtrak services and with commuter rail and<br />
urban transit services. The <strong>Rail</strong> 2 <strong>Rail</strong> Program connecting the Pacific Surfliners<br />
<strong>to</strong> Metrolink and Coaster is the most comprehensive connectivity program and is<br />
discussed below. The Pacific Surfliners also s<strong>to</strong>p at stations with connections <strong>to</strong>:<br />
Los Angeles Metro <strong>Rail</strong>, San Diego Trolley, and Caltrain in San Jose (via Amtrak<br />
bus service). The San Joaquins s<strong>to</strong>p at stations with connections <strong>to</strong> Caltrain,<br />
BART, San Francisco Muni, Santa Clara Valley Transit Authority (VTA), and<br />
Sacramen<strong>to</strong> Regional Transit (fall 20<strong>06</strong>). In addition, the network of commuter<br />
rail and transit systems in Southern <strong>California</strong> is accessible <strong>to</strong> San Joaquin Route<br />
passengers by utilizing the dedicated connecting bus service at Bakersfield.<br />
The Capital Corridor s<strong>to</strong>ps at stations with connections <strong>to</strong> Caltrain, Altamont<br />
Commuter Express (ACE), BART, VTA and Sacramen<strong>to</strong> Regional Transit<br />
(fall 20<strong>06</strong>).<br />
Transit: Both the Department and the CCJPA have a program where free transfers<br />
<strong>to</strong> local transit are offered <strong>to</strong> train passengers on the following services:<br />
Pacific Surfliner Route:<br />
• San Luis Obispo Regional Transit (SLO Transit)<br />
• Regional Transit Authority [San Luis Obispo, Santa Maria, Atascadero,<br />
Paso Robles]<br />
• South County Area Transit [Grover Beach]<br />
• Guadalupe Transit<br />
41
<strong>2005</strong>-<strong>06</strong> – <strong>2015</strong>-<strong>16</strong> <strong>California</strong> <strong>State</strong> <strong>Rail</strong> <strong>Plan</strong><br />
San Joaquin Route:<br />
• Fresno Area Express<br />
• Sacramen<strong>to</strong> Regional Transit<br />
• Merced County Transit<br />
• Alameda-Contra Costa Transit District (AC Transit)<br />
• County Connection (service in central Contra Costa County)<br />
Capi<strong>to</strong>l Corridor:<br />
• AC Transit<br />
• County Connection<br />
• Fairfield/Suisun Transit<br />
• Sacramen<strong>to</strong> Regional Transit<br />
• Davis Unitrans<br />
• Yolobus [Davis]<br />
• VTA<br />
The goal is <strong>to</strong> expand this program <strong>to</strong> all major transit providers with connections<br />
<strong>to</strong> the <strong>State</strong>-supported routes.<br />
Streets and Highways: Finally, the Department works <strong>to</strong> ensure that the trains are<br />
well connected <strong>to</strong> streets and highways through proper design of stations and<br />
signage, including pathfinder signs on local streets and roads and highways that<br />
guide passengers <strong>to</strong> Amtrak stations.<br />
RAIL 2 RAIL PROGRAM<br />
The <strong>Rail</strong> 2 <strong>Rail</strong> Program that was introduced in 2002, began an era of dramatically<br />
improved interconnectivity between intercity and commuter rail and increased<br />
mass transportation mobility in Southern <strong>California</strong>. The ultimate goal of the<br />
Program is <strong>to</strong> coordinate schedules, ticketing and fares between Amtrak and<br />
Metrolink and Coaster. The first phase of the Program involving Metrolink and<br />
Amtrak allowed Amtrak ticket holders and Metrolink monthly ticket holders<br />
(for the Orange County and Ventura County lines) <strong>to</strong> have access <strong>to</strong> both Amtrak<br />
and Metrolink trains within the geographical limits of their tickets. Then, starting<br />
in 2004, the Program was expanded <strong>to</strong> the Coaster, where Amtrak ticket holders<br />
and Coaster monthly ticket holders have access <strong>to</strong> both Amtrak and Coaster trains<br />
between Oceanside and San Diego. Also, Metrolink and Coaster monthly ticket<br />
pass holders can use Amtrak trains on the weekends.<br />
This Program has been a breakthrough in the implementation of a truly seamless<br />
rail system in Southern <strong>California</strong>. Today, over 25,000 Metrolink monthly ticket<br />
holders and 5,000 Coaster monthly ticket holders a month take advantage of the<br />
Program <strong>to</strong> ride Amtrak trains. Pacific Surfliner ridership jumped <strong>16</strong> percent in<br />
the first year of the program, 14 percent in the second year, and six percent in the<br />
42
Chapter III – Operations Program<br />
third year, mostly due <strong>to</strong> the <strong>Rail</strong> 2 <strong>Rail</strong> Program. This is a phenomenal ridership<br />
increase for a long-established service, (41 percent increase between 2001-02 and<br />
2004-05) with almost no increases in train frequencies.<br />
The next step in coordination between Amtrak and Metrolink will involve through<br />
ticketing between the two opera<strong>to</strong>rs when new ticket vending machines are<br />
installed in 20<strong>06</strong>. For instance, a passenger will be able <strong>to</strong> purchase a through<br />
ticket at the Amtrak station in Santa Barbara for travel on the Pacific Surfliner <strong>to</strong><br />
Los Angeles, and then on <strong>to</strong> San Bernardino on Metrolink. Conversely,<br />
passengers will be able <strong>to</strong> purchase tickets from the Metrolink ticket machine in<br />
Lancaster that will take them <strong>to</strong> Los Angeles on Metrolink, and then on <strong>to</strong><br />
San Diego on Amtrak. The Department also intends <strong>to</strong> continue efforts <strong>to</strong> make<br />
schedules connect and market Metrolink-Amtrak through service.<br />
AIRPORT ACCESS<br />
Section 14036.7 of the Government Code requires that the Department report on<br />
the status of all existing intercity rail station facilities that serve airports directly<br />
and indirectly and on the Department’s activities in improving other linkages<br />
between rail service and airports.<br />
Virtually all major airports in <strong>California</strong> can be reached by intercity rail with a<br />
transit connection. Figure 3H shows the intercity and commuter rail stations and<br />
transit connections that provide access <strong>to</strong> the major <strong>California</strong> airports.<br />
The Amtrak<strong>California</strong>.com web site provides detailed information on access from<br />
<strong>California</strong> Amtrak services <strong>to</strong> <strong>California</strong> airports.<br />
Three airports in <strong>California</strong> are served directly by Amtrak service or connecting<br />
feeder bus service. The Bob Hope Airport [BUR] in Burbank is the only airport in<br />
<strong>California</strong> directly served by Amtrak rail service. The rail station, which provides<br />
both Amtrak and Metrolink service, is a short walk from the main airport terminal.<br />
The station integrates airport shuttles, Amtrak Pacific Surfliner trains, San Joaquin<br />
feeder bus service, Metrolink trains, and local transit service. Currently, five daily<br />
round-trip Pacific Surfliners and 18 weekday Metrolink round-trip trains serve this<br />
station. Also, the Arcata-Eureka and Palm Springs Airports are directly served by<br />
a San Joaquin bus s<strong>to</strong>p at the airport.<br />
43
<strong>2005</strong>-<strong>06</strong> – <strong>2015</strong>-<strong>16</strong> <strong>California</strong> <strong>State</strong> <strong>Rail</strong> <strong>Plan</strong><br />
Figure 3H<br />
<strong>Rail</strong> Access <strong>to</strong> Major <strong>California</strong> Airports<br />
Airport (Code) <strong>Rail</strong> Corridor* Station<br />
Arcata-Eureka<br />
[ACV]<br />
Bob Hope [BUR]<br />
Fresno-Yosemite<br />
International [FYI]<br />
John Wayne<br />
[SNA]<br />
Long Beach<br />
[LGB]<br />
Los Angeles<br />
International<br />
[LAX]<br />
San Jose Mineta<br />
International [SJC]<br />
Oakland<br />
International<br />
[OAK]<br />
Public Transit Connection<br />
between <strong>Rail</strong> Station and<br />
Airport<br />
San Joaquin Bus McKinleyville (Bus s<strong>to</strong>ps at airport terminal.)<br />
Pacific Surfliner/<br />
San Joaquin Bus/<br />
Metrolink<br />
Burbank Airport<br />
Airport shuttle (or within<br />
walking distance)<br />
San Joaquin Fresno Fresno Area Express<br />
Pacific Surfliner/<br />
Metrolink<br />
Santa Ana<br />
Orange County Transit Authority<br />
San Joaquin Bus Long Beach Long Beach Transit<br />
Pacific Surfliner/<br />
Metrolink<br />
San Joaquin Bus<br />
Capi<strong>to</strong>l Corridor/<br />
San Joaquin Bus/<br />
Caltrain<br />
Capi<strong>to</strong>l Corridor<br />
San Joaquin<br />
Los Angeles<br />
Van Nuys<br />
Flyaway<br />
San Jose<br />
Oakland<br />
Coliseum<br />
Oakland-Jack<br />
London Square<br />
Los Angeles Metropolitan<br />
Transit Authority bus<br />
Flyaway bus shuttle<br />
Valley Transportation Authority<br />
AirBART Shuttle or AC Transit<br />
BART or AC Transit<br />
Ontario<br />
San Joaquin Bus Ontario Omnitrans<br />
International<br />
[ONT] Metrolink Fontana Omnitrans<br />
Palm Springs<br />
[PSP]<br />
Sacramen<strong>to</strong><br />
International<br />
[SMF]<br />
San Diego<br />
International<br />
[SAN]<br />
San Joaquin Bus Palm Springs (Bus s<strong>to</strong>ps at airport terminal.)<br />
Capi<strong>to</strong>l Corridor/<br />
San Joaquin trains<br />
and buses<br />
Pacific Surfliner/<br />
Coaster<br />
Sacramen<strong>to</strong><br />
San Diego<br />
Yolobus<br />
San Diego Transit bus<br />
San Francisco San Joaquin/<br />
Richmond BART<br />
International Capi<strong>to</strong>l Corridor<br />
[SFO] Caltrain Millbrae BART<br />
* - A bus in the “<strong>Rail</strong> Corridor” column indicates dedicated Amtrak feeder bus connection from<br />
an Amtrak station.<br />
44
Chapter IV – Marketing Program<br />
CHAPTER IV<br />
MARKETING PROGRAM<br />
This chapter describes the <strong>State</strong>’s intercity rail marketing program for the<br />
Pacific Surfliner and San Joaquin Routes. The program includes advertising,<br />
public relations/outreach, group travel, rail safety, and market research.<br />
Following, the Capi<strong>to</strong>l Corridor’s marketing program is described.<br />
MARKETING PROGRAM GOALS<br />
The Department’s goals for its Marketing Program are as follows:<br />
• Establish a position for <strong>California</strong> train travel in consumers’ minds because<br />
research shows most <strong>California</strong> travelers do not consider the rail option<br />
when making travel decisions. Market rail travel as a fun, easy-<strong>to</strong>-use<br />
option, relevant <strong>to</strong> travel needs - in short “Travel made simple.”<br />
• Emphasize Amtrak’s everyday low fares and implement fare promotion<br />
campaigns <strong>to</strong> increase price-sensitive ridership, as appropriate.<br />
• Develop ridership in specific primary target markets, such as the “mature<br />
market” (persons over 50), families, and Hispanic persons. Secondary<br />
markets include business travelers and college students.<br />
• Promote important recent improvements <strong>to</strong> the corridors including the<br />
opening of new and renovated stations.<br />
• Work with cities and other local agencies <strong>to</strong> market special events where<br />
train travel can be a viable transportation option and coordinate with a wide<br />
variety of local entities <strong>to</strong> promote use of the train.<br />
• Promote new train and feeder bus services.<br />
MARKETING BUDGET<br />
The Department expends $5 million annually on intercity rail marketing. Amtrak<br />
supplements the Department’s annual budget with an additional contribution for<br />
media advertising, which in 2004-05 was $1.2 million. Amtrak contributed<br />
$800,000 of this for the Pacific Surfliners, with $200,000 each going <strong>to</strong> the<br />
San Joaquins and the Capi<strong>to</strong>l Corridor. Amtrak plans similar <strong>California</strong><br />
advertising expenditures in <strong>2005</strong>-<strong>06</strong>.<br />
The marketing funds are divided between the three <strong>State</strong>-supported routes.<br />
$4,826,800 ($3,826,200 in <strong>State</strong> funds and $1 million in Amtrak funds) is<br />
expended on marketing for the San Joaquins and Pacific Surfliners. Typically,<br />
media advertising receives about $3.8 million of this and the remainder,<br />
45
<strong>2005</strong>-<strong>06</strong> – <strong>2015</strong>-<strong>16</strong> <strong>California</strong> <strong>State</strong> <strong>Rail</strong> <strong>Plan</strong><br />
approximately $1 million, is divided between public relations, rail safety,<br />
passenger information, and market research. The CCJPA and the <strong>State</strong> have<br />
agreed that $1,173,800 of <strong>State</strong> funds annually goes <strong>to</strong> the CCJPA for marketing.<br />
Together with the Amtrak advertising supplement, $1,373,800 is available for the<br />
Capi<strong>to</strong>l Corridor.<br />
DEPARTMENT’S MARKETING PROGRAM<br />
The Department’s marketing program for the Pacific Surfliners and San Joaquins<br />
has several major components: advertising, public relations/outreach, rail safety<br />
and market research.<br />
ADVERTISING<br />
The Department and Amtrak combine resources <strong>to</strong> create a single advertising<br />
program for <strong>California</strong> services. In Oc<strong>to</strong>ber 2004, the Department renewed a<br />
two-year contract with Glass-McClure Advertising of Sacramen<strong>to</strong> for 2004-05 and<br />
<strong>2005</strong>-<strong>06</strong>. Contract services include strategic planning, media planning, production<br />
and creative services, and media buys. Glass-McClure’s agreement with the<br />
Department maximizes the <strong>State</strong>’s commitment <strong>to</strong> rider-producing media by<br />
paying a lower-than-standard commission rate on media buys, and no mark-up is<br />
paid for production or creative work.<br />
The Department has formulated, in conjunction with Amtrak, a detailed plan for<br />
the FY <strong>2005</strong>-<strong>06</strong>. The plan includes seasonal fare promotion campaigns that are<br />
coordinated with Amtrak’s national campaigns. The plan also continues a<br />
successful strategy of targeting constituent groups with high likelihood of riding<br />
the train. These groups have been selected through research that shows that they<br />
hare underrepresented in the train population. Primary markets include the<br />
“mature market”, families, and Hispanic persons. Important secondary targets<br />
include business travelers and college students. These groups will be targeted<br />
with campaigns and media addressing their particular travel needs.<br />
The Department’s advertising focuses on the virtues of train travel. This approach<br />
uses the “Travel made simple” concept for Amtrak <strong>California</strong> that combines an<br />
emotional element reflecting train travel as a unique experience with price and<br />
destination messages. This overall advertising concept will be adjusted when<br />
tailoring specific messages for each of the different target groups listed above.<br />
PUBLIC RELATIONS/OUTREACH<br />
The public relations/outreach program is a personal and hands-on part of the<br />
advertising program designed <strong>to</strong> work in conjunction with and support advertising<br />
efforts. This allows for a cus<strong>to</strong>mized, corridor-specific program <strong>to</strong> be constructed<br />
from an array of the following activities.<br />
46
Chapter IV – Marketing Program<br />
Special Promotions - Promotions have the advantage of using a tailored message<br />
<strong>to</strong> spotlight aspects of service of particular appeal <strong>to</strong> a corridor audience.<br />
Promotions will continue <strong>to</strong> include ticket giveaways in conjunction with media<br />
buys on local radio stations; arrangements with destinations that may include<br />
overnight accommodations and tickets <strong>to</strong> a special event/theme park; and a variety<br />
of cooperative efforts with well known promotional partners. These partnerships<br />
offer the chance for both parties <strong>to</strong> obtain exposure for their products while<br />
sharing an audience and the cost of that exposure. Amtrak <strong>California</strong> partners<br />
have included Holiday Inn, Sea World, Yosemite, Disneyland Resort, the Oakland<br />
Raiders, <strong>California</strong> <strong>State</strong> <strong>Rail</strong>road Museum, Six Flags Marine World, and similar<br />
organizations. An Amtrak-funded promotion includes sponsorship of selected<br />
college and professional sports teams whose team demographics coincide with<br />
potential train riders. This promotion allows the Amtrak <strong>California</strong> train message<br />
<strong>to</strong> be communicated <strong>to</strong> sports fans in new and previously unused advertising<br />
media.<br />
Media Relations - The contrac<strong>to</strong>r conducts press <strong>to</strong>urs, produces press kits for<br />
special events, conducts media familiarization trips, and otherwise generates travel<br />
and rail-related articles for publication. These activities are coordinated with<br />
Amtrak, the Department’s Public Information Office, and district offices where<br />
appropriate.<br />
Printed Materials - Each quarter, the contrac<strong>to</strong>r produces Making Tracks, the<br />
on board rider newsletter, and prints approximately 40,000 for distribution in<br />
station racks and by mail statewide. The contrac<strong>to</strong>r also produces collateral pieces<br />
such as flyers and coupons on demand that are designed <strong>to</strong> highlight various<br />
aspects of the service. Examples of these are posters promoting San Joaquin<br />
trains, a brochure advertising special packages <strong>to</strong> Yosemite, rack cards for special<br />
events and the San Joaquin Route guide.<br />
Special Events - In any given year, as <strong>State</strong>-sponsored rail facilities and services<br />
have grown, ceremonial events marking this growth have been staged under the<br />
public relations banner. Such events introduce potential Amtrak cus<strong>to</strong>mers <strong>to</strong> the<br />
product, but they also generate important free publicity that is frequently more<br />
effective at reaching an audience than paid advertising. Each of these service<br />
changes affords the opportunity <strong>to</strong> stage an appropriate special event <strong>to</strong> the<br />
program’s marketing benefit. The Department works with Amtrak <strong>to</strong> organize<br />
these events.<br />
GROUP TRAVEL<br />
Kids ‘N Trains – This program on the San Joaquins and Pacific Surfliners<br />
promotes group travel for youths on field trips at highly discounted fares.<br />
The dual goals of the program are <strong>to</strong> increase ridership at off-peak periods and<br />
introduce kids and their adult chaperones <strong>to</strong> the train as a means of promoting train<br />
ridership <strong>to</strong> kids’ families. In <strong>2005</strong>-<strong>06</strong>, the program is in its sixth year of<br />
47
<strong>2005</strong>-<strong>06</strong> – <strong>2015</strong>-<strong>16</strong> <strong>California</strong> <strong>State</strong> <strong>Rail</strong> <strong>Plan</strong><br />
operation. This program continues <strong>to</strong> be very popular, and the Department<br />
continues <strong>to</strong> make refinements <strong>to</strong> it <strong>to</strong> make it more user-friendly and costeffective.<br />
Senior Travel Program - In January 2004, the Department began a new senior<br />
group travel program on the San Joaquins (“All Aboard Seniors!”) patterned after<br />
the “Kids ‘N Trains” program. In <strong>2005</strong>, 15 trips accounted for 1,000 boardings <strong>to</strong><br />
a variety of destinations, showing a positive response <strong>to</strong> the program. For 20<strong>06</strong>,<br />
plans have been developed <strong>to</strong> partner with Merced County Transit <strong>to</strong> offer<br />
expanded destinations. Similar partnerships will be explored in future years.<br />
Student Travel Program – In the fall of <strong>2005</strong>, the Department and Amtrak<br />
launched a trial college student discount program. The discount program provides<br />
a 20 percent discount <strong>to</strong> students who show a student card from selected colleges.<br />
Like most other discounts on Amtrak, a minimum three-day advance purchase and<br />
blackout days apply. In 2004, the Department had conducted market research that<br />
showed (1) a strong market of potential student riders, and (2) students desire a<br />
simple and straightforward discount program. The program launched in <strong>2005</strong> was<br />
based on the results of the prior market research.<br />
On the San Joaquins, students from Fresno City College, <strong>California</strong> <strong>State</strong><br />
University, Fresno, and the new University of <strong>California</strong> at Merced, are now<br />
eligible for the student discount. On the Pacific Surfliners, students from<br />
<strong>California</strong> Polytechnic <strong>State</strong> University at San Luis Obispo are eligible for the<br />
student discount. The discount program was widely promoted in the fall of <strong>2005</strong><br />
with new student orientation materials, campus information booths, and in<br />
collaboration with university officials. Fall <strong>2005</strong> ridership (September-December<br />
<strong>2005</strong>) yielded over 800 passengers and almost $14,000 in revenue.<br />
Additional universities under consideration for possible expansion of the program<br />
are <strong>California</strong> <strong>State</strong> Universities in Bakersfield, San Diego and Turlock;<br />
University of <strong>California</strong> campuses in Santa Barbara and Irvine; and the University<br />
of the Pacific in S<strong>to</strong>ck<strong>to</strong>n.<br />
RAIL SAFETY<br />
<strong>Rail</strong> passenger service expansion in <strong>California</strong> has meant significantly increased<br />
traffic along largely privately owned railroad tracks. To help ensure that the<br />
increase occurs without a corresponding increase in hazard, the Department<br />
budgets $70,000 annually <strong>to</strong>ward rail safety information and education programs.<br />
These dollars are used <strong>to</strong> place warning signs near schools adjacent <strong>to</strong> railroad<br />
tracks; <strong>to</strong> develop safety programs designed <strong>to</strong> educate <strong>California</strong>ns on the dangers<br />
of trespassing on rail ROW and ignoring grade crossing warning devices; and <strong>to</strong><br />
conduct public service advertising campaigns on these subjects. The CCJPA also<br />
participates in safety activities with the Department.<br />
48
Chapter IV – Marketing Program<br />
The Department coordinates its rail safety activities with <strong>California</strong> Operation<br />
Lifesaver, the <strong>State</strong> affiliate of the national nonprofit organization. The <strong>State</strong><br />
organization is a coalition of railroads; Federal, <strong>State</strong> and local agencies (such as<br />
the FRA, the CPUC, local police organizations and transit opera<strong>to</strong>rs); and private<br />
businesses and individuals concerned about promoting safety. The Department is<br />
a member of the <strong>California</strong> Operation Lifesaver Board of Direc<strong>to</strong>rs. Their major<br />
focus is encouraging safe behavior at railroad grade crossings and discouraging,<br />
for safety reasons, trespassing on railroad property.<br />
MARKET RESEARCH<br />
The Department contracts with Amtrak for $500,000 per year in market research<br />
services. With the Department’s participation, Amtrak contracts with various<br />
market research firms <strong>to</strong> measure cus<strong>to</strong>mer attitudes, desires and preferences in<br />
order <strong>to</strong> match services <strong>to</strong> cus<strong>to</strong>mer needs. Past market research has included<br />
seasonal on board surveys; telephone surveys of non-users; license plate surveys<br />
<strong>to</strong> obtain data for ridership, modeling, and advertising; and promotion tracking<br />
studies. Specifically, the Department has examined alternative family fare<br />
structures, participated in Amtrak’s Pacific Coast Market Study conducted<br />
research in<strong>to</strong> the usage of the <strong>California</strong> <strong>Rail</strong> Pass, studied the Pacific Surfliners’<br />
Pacific Business Class, surveyed Metrolink and Coaster users of the “<strong>Rail</strong> 2 <strong>Rail</strong>”<br />
program, and performed the Pacific Surfliner parking analysis.<br />
In addition, each year’s research plan includes a contingency fund designed <strong>to</strong><br />
conduct spot research on subjects that arise during the course of a given year.<br />
In this category, the Department and Amtrak have conducted research on timetable<br />
formats that resulted in a redesign of the <strong>State</strong>’s public timetable folders.<br />
A branding exercise soliciting cus<strong>to</strong>mer attitudes about the San Diegan brand<br />
name and its possible replacements resulted in the new Pacific Surfliner name for<br />
the corridor.<br />
<strong>Rail</strong> Ridership/Revenue Forecasting Model<br />
The Department contracts with Amtrak for operation and development of the<br />
<strong>Rail</strong> Ridership/Revenue Forecasting Model. It is used by the Department, Amtrak<br />
and CCJPA in conjunction with Amtrak’s consultant, AECOM Consult,<br />
an affiliate of DMJM Harris, <strong>to</strong> estimate the ridership and revenue impacts of<br />
major service changes, such as new services, route extensions or truncations,<br />
frequency changes, and fare changes.<br />
The first stage of the model predicts au<strong>to</strong>mobile and rail travel volumes for each<br />
origin-destination pair. The second stage predicts the share of intercity travel that<br />
is expected <strong>to</strong> use each available modal alternative (au<strong>to</strong>mobile, rail) in the future.<br />
Both model stages are conditional on the characteristics of the modal services <strong>to</strong><br />
be offered and the characteristics of the population.<br />
49
<strong>2005</strong>-<strong>06</strong> – <strong>2015</strong>-<strong>16</strong> <strong>California</strong> <strong>State</strong> <strong>Rail</strong> <strong>Plan</strong><br />
CAPITOL CORRIDOR MARKETING PROGRAM<br />
The CCJPA’s FY <strong>2005</strong>/<strong>06</strong>-FY 20<strong>06</strong>/07 Business <strong>Plan</strong> Update states that:<br />
The CCJPA uses a combination of grassroots local marketing efforts and<br />
broad-based joint media campaigns <strong>to</strong> build awareness of the Capi<strong>to</strong>l Corridor<br />
service. Marketing dollars and impact are maximized through joint promotions<br />
and advertising as well as reciprocal marketing programs with the <strong>State</strong>,<br />
Amtrak, CCJPA member agencies, and other selected partners. A primary<br />
objective is <strong>to</strong> promote the service <strong>to</strong> key markets and attract riders <strong>to</strong> trains<br />
with available capacity.<br />
The CCJPA will pursue the following initiatives in <strong>2005</strong>-<strong>06</strong> and 20<strong>06</strong>-07:<br />
FY <strong>2005</strong>-<strong>06</strong> Marketing Program<br />
• In the past, the CCJPA, Amtrak, and Caltrans collaborated on refining the<br />
“Travel made simple” campaign <strong>to</strong> preserve the freshness and clarity of the<br />
advertising message. This campaign, which will continue through <strong>2005</strong>-<strong>06</strong>,<br />
emphasizes the convenience of modern train travel.<br />
• Continue development of Strategic Marketing Partnership Programs <strong>to</strong><br />
maximize media dollars, aligning the Capi<strong>to</strong>l Corridor with valuable<br />
organizations and expanding market reach.<br />
• Reciprocal marketing with <strong>to</strong>urism industry members such as hotels,<br />
airports, and convention/visi<strong>to</strong>r bureaus.<br />
• Targeted marketing <strong>to</strong> school groups, senior citizens, special interest<br />
groups, and new residential communities.<br />
• Expand promotional partnerships with high-profile entities <strong>to</strong> maximize<br />
media dollars and visibility.<br />
• Focus on business travel, especially in the Placer and Santa Clara County<br />
areas, as service <strong>to</strong> those areas increases.<br />
• Coordinate outreach and public relations efforts in Silicon Valley/San Jose<br />
area <strong>to</strong> coincide with service expansion.<br />
FY 20<strong>06</strong>-07 Marketing Program<br />
In addition <strong>to</strong> continuing our most successful programs, the CCJPA will also<br />
consider new approaches for future implementation:<br />
• Refinement of the Capi<strong>to</strong>l Corridor brand <strong>to</strong> emphasize local character and<br />
personalize the service, including possible image modifications.<br />
• Explore gradual shift <strong>to</strong>wards Capi<strong>to</strong>l Corridor-specific regional<br />
marketing, <strong>to</strong> increase regional brand awareness and test for advertising<br />
effectiveness.<br />
50
51<br />
Chapter IV – Marketing Program
<strong>2005</strong>-<strong>06</strong> – <strong>2015</strong>-<strong>16</strong> <strong>California</strong> <strong>State</strong> <strong>Rail</strong> <strong>Plan</strong><br />
Figure 5A<br />
52
Chapter V – The <strong>California</strong> Passenger <strong>Rail</strong> Network<br />
CHAPTER V<br />
THE CALIFORNIA RAIL NETWORK<br />
This chapter describes the <strong>California</strong> rail network and the <strong>State</strong>’s responsibility<br />
vis-à-vis this network. Figure 5A is a map of the intercity and commuter rail<br />
passenger systems in <strong>California</strong>, Figure 5B summarizes all of the intercity,<br />
commuter, and urban rail services in <strong>California</strong>, and Figure 5C is a summary of<br />
intercity and commuter rail ridership in <strong>California</strong> from 1974-<strong>2005</strong>.<br />
RAIL SERVICES IN CALIFORNIA<br />
The <strong>State</strong> rail system combines intercity, commuter, and freight rail. Intercity rail<br />
includes state-supported corridor routes and Amtrak long-distance routes.<br />
All three systems share the same infrastructure that is generally owned by private<br />
railroads, and in some cases, public entities. Because these systems share the<br />
same infrastructure, joint planning and policy development will increase the<br />
efficiency and effectiveness of the system, and help <strong>to</strong> make infrastructure<br />
development and maintenance more cost effective. For this reason, this <strong>Plan</strong><br />
focuses on these rail components of the larger mass transportation system in<br />
<strong>California</strong>.<br />
Amtrak funds and operates “basic system” long-distance (usually interstate) rail<br />
routes. Four long-distance routes operate in <strong>California</strong> (Coast Starlight,<br />
<strong>California</strong> Zephyr, Southwest Chief, and Sunset Limited). The <strong>State</strong> funds the<br />
three <strong>State</strong>-supported intercity rail routes. The Department administers the<br />
Pacific Surfliners and San Joaquins and the CCJPA administers the<br />
Capi<strong>to</strong>l Corridor. Amtrak operates these routes under contract with either the<br />
<strong>State</strong> or the CCJPA. Regional agencies fund and administer the four commuter<br />
rail systems in <strong>California</strong> (Caltrain, ACE, Metrolink, and Coaster).<br />
The freight rail system in <strong>California</strong> is primarily operated by two privately owned<br />
Class I railroads: the Union Pacific <strong>Rail</strong>road (UP) and the BNSF <strong>Rail</strong>way (BNSF).<br />
Also, one Class II regional railroad and 27 Class III shortline railroads operate<br />
freight rail service in <strong>California</strong>.<br />
Amtrak’s long-distance routes are discussed in more detail later in this Chapter.<br />
The three <strong>State</strong>-supported intercity rail routes are discussed in Chapters VI, VII,<br />
and VIII and commuter rail services are discussed in Chapter IX. Freight rail is<br />
discussed in detail in Part II of this <strong>Plan</strong> (Chapters XIV – XX).<br />
53
<strong>2005</strong>-<strong>06</strong> – <strong>2015</strong>-<strong>16</strong> <strong>California</strong> <strong>State</strong> <strong>Rail</strong> <strong>Plan</strong><br />
Figure 5B<br />
RAIL PASSENGER SERVICES IN CALIFORNIA<br />
Service Type Opera<strong>to</strong>r Service Name Service Area<br />
Intercity <strong>Rail</strong>road Amtrak<br />
Pacific Surfliner* San Luis Obispo-Santa Barbara-Los Angeles-San Diego<br />
<strong>Rail</strong><br />
(100% <strong>State</strong><br />
San Joaquin<br />
Bay Area/Sacramen<strong>to</strong>-Fresno-Bakersfield<br />
Supported) Capi<strong>to</strong>l Corridor Auburn-Sacramen<strong>to</strong>-Oakland-San Jose<br />
Amtrak<br />
Coast Starlight<br />
Los Angeles-Oakland-Sacramen<strong>to</strong>-Seattle<br />
Basic System <strong>California</strong> Zephyr Emeryville-Sacramen<strong>to</strong>-Denver-Omaha-Chicago<br />
(100 % Amtrak Southwest Chief Los Angeles-Kansas City-Chicago<br />
Supported)<br />
Sunset Limited<br />
Los Angeles-Hous<strong>to</strong>n-New Orleans-Orlando<br />
Pacific Surfliner* San Luis Obispo-Santa Barbara-Los Angeles-San Diego<br />
Commuter <strong>Rail</strong>road Peninsula Corridor Peninsula Commute<br />
<strong>Rail</strong><br />
Joint Powers Board Service (Caltrain)<br />
San Francisco-San Jose-Gilroy<br />
San Joaquin Regional Altamont Commuter<br />
<strong>Rail</strong> Commission Express (ACE)<br />
S<strong>to</strong>ck<strong>to</strong>n-Livermore-Fremont-San Jose<br />
Southern <strong>California</strong><br />
Regional <strong>Rail</strong><br />
Authority<br />
Urban <strong>Rail</strong><br />
Transit<br />
Heavy<br />
<strong>Rail</strong><br />
Transit<br />
Light<br />
<strong>Rail</strong><br />
Transit<br />
Cable<br />
Car<br />
North County Transit<br />
District<br />
San Francisco Bay<br />
Area Rapid Transit<br />
District<br />
Los Angeles County<br />
Metropolitan<br />
Transportation<br />
Authority<br />
Sacramen<strong>to</strong> Regional<br />
Transit District<br />
San Francisco<br />
Municipal <strong>Rail</strong>way<br />
Santa Clara Valley<br />
Transportation<br />
Authority<br />
Los Angeles County<br />
Metropolitan<br />
Transportation<br />
Authority<br />
San Diego Trolley,<br />
Inc.<br />
San Francisco<br />
Municipal <strong>Rail</strong>way<br />
Metrolink:<br />
Ventura County Line<br />
Antelope Valley Line<br />
San Bernardino Line<br />
Riverside Line<br />
Orange County Line<br />
Inland Empire-<br />
Orange County Line<br />
91 Line<br />
Coaster<br />
BART<br />
Metro <strong>Rail</strong>:<br />
Red Line<br />
Red Line<br />
* - <strong>State</strong> supports 70% of all service; Amtrak supports 30%.<br />
RT Light <strong>Rail</strong>:<br />
Gold Line<br />
Blue Line<br />
Muni Metro:<br />
F - Market-Wharves<br />
J - Church<br />
K - Ingleside<br />
L - Taraval<br />
M - Oceanview<br />
N – Judah<br />
VTA Light <strong>Rail</strong><br />
Metro <strong>Rail</strong>:<br />
Blue Line<br />
Gold Line<br />
Green Line<br />
San Diego Trolley:<br />
Blue Line<br />
Orange Line<br />
Green Line<br />
Muni Cable Car<br />
Los Angeles-Oxnard-Montalvo<br />
Los Angeles-Palmdale-Lancaster<br />
Los Angeles-Claremont-San Bernardino<br />
Los Angeles-Pomona-Riverside<br />
Los Angeles-Santa Ana-Oceanside<br />
San Bernardino-Santa Ana-Oceanside<br />
Los Angeles-Fuller<strong>to</strong>n-Riverside<br />
Oceanside-Solana Beach-San Diego<br />
Richmond-Oakland-San Francisco-Daly City<br />
Fremont-Oakland-San Francisco-Daly City<br />
Richmond-Oakland-Fremont<br />
Pittsburg/Bay Point-San Francisco-Daly City<br />
Dublin/Pleasan<strong>to</strong>n-Coliseum/Oakland Airport-<br />
San Francisco-San Francisco Airport-Millbrae<br />
Los Angeles-Hollywood/Vine-North Hollywood<br />
Los Angeles-Wilshire/Western<br />
Sacramen<strong>to</strong>-Sunrise-Folsom<br />
Watt/I-80-Sacramen<strong>to</strong>-Meadowview<br />
Fisherman’s Wharf-Castro<br />
Ferry Building-Noe Valley-Balboa Park<br />
Ferry Building-Ingleside District-Balboa Park<br />
Ferry Building-San Francisco Zoo<br />
Ferry Building-Oceanview District-Balboa Park<br />
Caltrain Station-Ocean Beach<br />
Alum Rock-Tasman-San Jose-Santa Teresa<br />
Mountain View-Tasman-San Jose-Winchester<br />
Oholne/Chynoweth-Almaden<br />
Los Angeles-Comp<strong>to</strong>n-Long Beach<br />
Los Angeles-Highland Park-Pasadena<br />
Redondo Beach-Aviation/LAX-Lynwood-Norwalk<br />
Old Town-San Diego-San Ysidro<br />
San Diego-El Cajon-Gillespie Field<br />
Old Town-Qualcomm Stadium-SDSU-Santee<br />
<strong>California</strong> Street<br />
Powell-Mason/Hyde<br />
54
Chapter V - The <strong>California</strong> Passenger <strong>Rail</strong> Network<br />
Figure 5C<br />
Calendar<br />
Year<br />
Pacific<br />
Surfliner 1<br />
ANNUAL INTERCITY AND COMMUTER RAIL RIDERSHIP IN CALIFORNIA<br />
DOES NOT INCLUDE RIDERSHIP ON AMTRAK LONG DISTANCE TRAINS NOT SUPPORTED BY THE STATE OF CALIFORNIA<br />
INTERCITY ROUTES COMMUTER SERVICES<br />
San Joaquin<br />
Capi<strong>to</strong>l<br />
Corridor<br />
Total Caltrain Metrolink Coaster ACE Total Grand Total<br />
1974 392,170 75,360 467,530 2 --<br />
1975 353,590 64,110 417,700 2 --<br />
1976 465,250 73,070 538,320 2 --<br />
1977 688,260 86,584 774,844 2 --<br />
1978 817,566 78,345 895,911 4,341,011 4,341,011 5,236,922<br />
1979 1,<strong>16</strong>9,978 96,399 1,266,377 5,699,4<strong>06</strong> 5,699,4<strong>06</strong> 6,965,783<br />
1980 1,253,387 155,587 1,408,974 6,112,890 6,112,890 7,521,864<br />
1981 3 1,188,681 183,235 1,371,9<strong>16</strong> 5,895,129 5,895,129 7,267,045<br />
1982 3 1,2<strong>16</strong>,327 180,030 1,396,357 5,195,819 5,195,819 6,592,176<br />
1983 3 1,259,188 214,928 1,474,1<strong>16</strong> 5,009,130 5,009,130 6,483,246<br />
1984 1,215,026 257,633 1,472,659 5,232,827 5,232,827 6,705,486<br />
1985 1,335,007 286,105 1,621,112 5,384,013 5,384,013 7,005,125<br />
1986 1,432,700 282,414 1,715,114 5,4<strong>16</strong>,303 5,4<strong>16</strong>,303 7,131,417<br />
1987 1,530,728 324,627 1,855,355 5,540,630 5,540,630 7,395,985<br />
1988 1,744,576 355,768 2,100,344 5,600,582 5,600,582 7,700,926<br />
1989 1,690,248 361,258 2,051,5<strong>06</strong> 5,790,712 5,790,712 7,842,218<br />
1990 1,690,759 538,<strong>06</strong>1 2,228,820 6,970,696 6,970,696 9,199,5<strong>16</strong><br />
1991 1,562,282 507,242 10,220 2,079,744 7,111,365 7,111,365 9,191,109<br />
1992 1,665,158 510,279 271,959 2,447,396 6,833,290 <strong>16</strong>5,466 6,998,756 9,446,152<br />
1993 1,638,159 530,257 300,409 2,468,825 6,889,941 1,889,980 8,779,921 11,248,746<br />
1994 1,578,946 561,674 371,919 2,512,539 7,021,182 4,132,625 11,153,807 13,666,346<br />
1995 1,441,925 518,737 357,123 2,317,785 7,143,091 4,645,561 514,453 12,303,105 14,620,890<br />
1996 1,574,896 578,059 480,555 2,633,510 7,765,115 5,688,814 850,999 14,304,928 <strong>16</strong>,938,438<br />
1997 1,650,411 715,103 488,150 2,853,664 8,367,683 6,314,368 945,739 15,627,790 18,481,454<br />
1998 1,559,997 665,<strong>06</strong>7 464,903 2,689,967 8,643,158 6,745,282 1,132,445 67,222 <strong>16</strong>,588,107 19,278,074<br />
1999 1,547,049 675,713 552,<strong>06</strong>3 2,774,825 8,990,864 7,229,677 1,251,238 424,988 17,896,767 20,671,592<br />
2000 1,594,189 683,889 878,960 3,157,038 10,267,000 8,<strong>06</strong>2,573 1,183,058 714,259 20,226,890 23,383,928<br />
2001 1,737,532 713,087 1,<strong>06</strong>3,994 3,514,613 10,497,640 8,522,555 1,258,263 922,976 21,201,434 24,7<strong>16</strong>,047<br />
2002 1,796,442 741,497 1,104,274 3,642,213 4 8,978,675 8,979,107 1,300,047 803,522 20,<strong>06</strong>1,351 23,703,564<br />
2003 2,228,042 783,096 1,140,561 4,151,699 4 8,107,324 9,099,985 1,366,479 607,017 19,180,805 23,332,504<br />
2004 2,431,085 747,574 1,192,152 4,370,811 4 8,768,157 9,786,531 1,474,360 640,753 20,669,801 25,040,612<br />
<strong>2005</strong> 2,520,444 755,851 1,260,249 4,536,544 9,867,498 10,245,609 1,485,125 667,029 22,265,261 26,801,805<br />
1 Designated the San Diegan Route prior <strong>to</strong> May 21, 2000.<br />
2 Data not available.<br />
3 Pacific Surfliner ridership shown above includes the following Spirit of <strong>California</strong> ridership: 1981 (17,533), 1982 (80,360) and 1983 (64,751).<br />
4 To facilitate the implementation of "Baby Bullet" service, Caltrain suspended weekend service between July 3, 2002 and June 4, 2004, resulting in a drop<br />
in ridership. Weekend service was reestablished on June 5, 2004.<br />
55
<strong>2005</strong>-<strong>06</strong> – <strong>2015</strong>-<strong>16</strong> <strong>California</strong> <strong>State</strong> <strong>Rail</strong> <strong>Plan</strong><br />
Urban rail transit systems in <strong>California</strong> do not share the same infrastructure with<br />
intercity, commuter and freight rail. For this reason, as discussed above, planning<br />
for these systems is not covered in this <strong>Plan</strong>. These systems include five different<br />
light rail systems (Sacramen<strong>to</strong>, San Francisco, San Jose, Los Angeles, and<br />
San Diego), BART, the Los Angeles County Metropolitan Transit Association<br />
(LACMTA) Metro <strong>Rail</strong> Red Line, and San Francisco Municipal <strong>Rail</strong>way Cable<br />
Car. These systems are locally funded.<br />
In order <strong>to</strong> further the implementation of a safe, integrated, multi-modal, worldclass<br />
transportation system, it is essential that the intercity and commuter rail<br />
systems be well integrated with the urban transit rail and bus systems. Thus the<br />
<strong>State</strong> encourages local and regional planning agencies <strong>to</strong> share their ideas and<br />
concerns regarding intercity rail service in their respective service areas.<br />
And multi-modal integration and connectivity is discussed throughout this <strong>Plan</strong>.<br />
THE STATE’S ROLE IN RAIL PASSENGER SERVICE<br />
INTERCITY RAIL SERVICES<br />
Intercity passenger rail service is a component of the <strong>State</strong>’s overall transportation<br />
system and operates between several regions of the <strong>State</strong>. Service is provided<br />
between metropolitan areas and <strong>to</strong> rural areas in the <strong>State</strong>. In <strong>California</strong>, Amtrak<br />
currently operates all <strong>State</strong>-supported intercity rail service under the provisions of<br />
the Federal <strong>Rail</strong> Passenger Service Act (49 U.S.C. 24101). All three intercity rail<br />
routes were funded, planned and administered by the <strong>State</strong> until July 1998 when<br />
the CCJPA assumed administration of the Capi<strong>to</strong>l Corridor. The <strong>State</strong> continues<br />
<strong>to</strong> fund the operation of the Capi<strong>to</strong>l Corridor, and fund and administer the Pacific<br />
Surfliner and San Joaquin Routes. For more information on Amtrak’s relationship<br />
with the Department and the CCJPA in regards <strong>to</strong> operations funding see Chapter<br />
XI. For more information on the intercity rail operations budget see Chapter III.<br />
The <strong>State</strong> also pays for the majority of capital improvements <strong>to</strong> intercity rail<br />
services. For detailed information on the intercity rail capital program see Chapter<br />
II. For information on intercity rail funding sources see Chapter XII.<br />
Figure 5D is a map of the three <strong>State</strong>-supported routes.<br />
COMMUTER RAIL SERVICES<br />
Commuter rail operates primarily within a single region of the Sate, serving<br />
regional and local transportation needs. Because commuter rail services primarily<br />
serve local and regional transportation needs, they are planned and administered<br />
by local and regional transportation agencies. Various sources of funding are<br />
available at the local, <strong>State</strong>, and Federal levels. Some capital funding is provided<br />
by the <strong>State</strong> through the <strong>State</strong> Transportation Improvement Program, and other<br />
sources, but operating funding is provided by the local and regional agencies.<br />
56
Chapter V – The <strong>California</strong> Passenger <strong>Rail</strong> Network<br />
Figure 5D<br />
57
<strong>2005</strong>-<strong>06</strong> – <strong>2015</strong>-<strong>16</strong> <strong>California</strong> <strong>State</strong> <strong>Rail</strong> <strong>Plan</strong><br />
DEFINITION OF COMMUTER VERSUS INTERCITY RAIL<br />
The Federal <strong>Rail</strong> Passenger Service Act (RPSA) and subsequent legal decisions<br />
define commuter and intercity rail service.<br />
The RPSA (49 U.S.C. 24102) states that:<br />
“Commuter rail passenger transportation” means short-haul rail<br />
passenger transportation in metropolitan and suburban areas usually<br />
having reduced fare, multiple-ride, and commuter tickets and morning and<br />
evening peak period operations.<br />
The Penn Central Transportation Company Discontinuance decision (338 ICC<br />
318) was issued by the Interstate Commerce Commission (ICC) after a 1971<br />
investigation held <strong>to</strong> determine whether certain trains constituted commuter<br />
service, thus placing them outside the jurisdiction of Amtrak, which at the time<br />
had just been created.<br />
Specifically, the ICC concluded that a commuter service would likely include<br />
some or all of the following features:<br />
• The passenger service is primarily being used by patrons traveling on a<br />
regular basis either within a metropolitan area or between a metropolitan<br />
area and its suburbs.<br />
• The service is usually characterized by operations performed at morning<br />
and evening peak periods of travel.<br />
• The service usually honors commutation or multiple-ride tickets at a fare<br />
reduced below the ordinary coach fare and carries the majority of its<br />
patrons on such a reduced fare basis.<br />
• The service makes several s<strong>to</strong>ps at short intervals either within a zone or<br />
along the entire route.<br />
• The equipment used may consist of little more than ordinary coaches.<br />
• The service should not extend more than 100 miles at the most, except in<br />
rare instances; although service over shorter distances may not be<br />
commuter or short haul within the meaning of this exclusion.<br />
The RPSA (49 U.S.C. 24102) also states that:<br />
“Intercity rail passenger transportation” means rail passenger<br />
transportation, except commuter rail passenger transportation.<br />
Thus, both the RPSA and the ICC specifically defined commuter rail service in the<br />
manner detailed above, and stated that intercity rail service is all other service not<br />
falling within the commuter rail definition. The inclusion of <strong>State</strong>-supported rail<br />
services under the RPSA definition of "intercity" is critical because Amtrak has<br />
58
Chapter V – The <strong>California</strong> Passenger <strong>Rail</strong> Network<br />
the right under the RPSA <strong>to</strong> access freight railroad tracks at incremental cost for<br />
the operation of intercity rail passenger services.<br />
Currently, there is no definition in <strong>State</strong> law for commuter or intercity rail service.<br />
Prior definitions, which essentially referred <strong>to</strong> the Federal definitions, were deleted<br />
under Chapter 622, Statutes of 1997 (SB 45 - Kopp).<br />
AMTRAK BASIC SYSTEM SERVICES<br />
Currently, Amtrak operates basic system long-distance trains on five routes in<br />
<strong>California</strong> that link <strong>California</strong> with other states. Basic system trains are fully<br />
funded by Amtrak and also provide varying levels of intrastate service within<br />
<strong>California</strong>. The Pacific Surfliner Route is unique because it is partially a basic<br />
system service and partially <strong>State</strong>-supported.<br />
The following describes the basic system routes serving <strong>California</strong> and their<br />
significance <strong>to</strong> the <strong>State</strong>’s transportation needs. Ridership figures are for<br />
FFY 2004-05 and include the <strong>to</strong>tal route ridership, not just the portion in<br />
<strong>California</strong>. Figure 5E is a map displaying the Amtrak basic system routes in<br />
<strong>California</strong>.<br />
ROUTE DESCRIPTIONS<br />
Pacific Surfliner Route (San Luis Obispo-Los Angeles-San Diego)<br />
Ridership on the Pacific Surfliner Route is only exceeded by service in the<br />
Northeast Corridor operating between Bos<strong>to</strong>n, New York, and Washing<strong>to</strong>n, D.C.<br />
Eleven round trips operate on Monday through Thursday, and twelve operate on<br />
Friday through Sunday between Los Angeles and San Diego. Five daily roundtrips<br />
are extended north between Los Angeles and Santa Barbara, with two<br />
continuing on <strong>to</strong> San Luis Obispo. Amtrak pays for 30 percent of the entire<br />
service as part of Amtrak’s basic system, while the <strong>State</strong> pays for the remaining<br />
70 percent of the service. Ridership in FFY 2004-05 was 2,520,444, an increase<br />
of 7.5 percent from the previous year. Chapter V discusses this route in detail.<br />
The Coast Starlight (Los Angeles-Oakland-Sacramen<strong>to</strong>-Portland-Seattle)<br />
The Coast Starlight’s daily round-trip is the most popular long distance train in the<br />
Amtrak system. For many years, demand has often outstripped capacity during<br />
summer and holiday travel periods. A substantial portion of the Route’s ridership<br />
is generated by intrastate <strong>California</strong> travel. The Route provides the only rail<br />
service north from Sacramen<strong>to</strong> <strong>to</strong> Redding and Oregon, and the only through rail<br />
service from the Bay Area <strong>to</strong> Los Angeles. Direct connections with the<br />
Pacific Surfliner at Los Angeles effectively extend the route south <strong>to</strong> San Diego.<br />
Connections with the San Joaquin at Sacramen<strong>to</strong> and Martinez provide<br />
Central Valley access for travelers <strong>to</strong> and from the north. Portland and Seattle are<br />
key s<strong>to</strong>ps <strong>to</strong> the north. Ridership in FFY 2004-05 on the service’s one daily<br />
round-trip <strong>to</strong>taled 372,304, a decrease of 10.4 percent from the previous year.<br />
59
<strong>2005</strong>-<strong>06</strong> – <strong>2015</strong>-<strong>16</strong> <strong>California</strong> <strong>State</strong> <strong>Rail</strong> <strong>Plan</strong><br />
Figure 5E<br />
60
Chapter V – The <strong>California</strong> Passenger <strong>Rail</strong> Network<br />
The <strong>California</strong> Zephyr (Emeryville-Reno-Denver-Chicago)<br />
The <strong>California</strong> Zephyr provides daily round-trip regional service in the<br />
Emeryville-Sacramen<strong>to</strong>-Reno corridor; extra coaches are often operated on this<br />
portion of the route <strong>to</strong> handle heavy loads <strong>to</strong> and from Reno. Connecting buses<br />
link Emeryville with San Francisco. A s<strong>to</strong>p in Truckee serves Lake Tahoe and<br />
nearby Sierra ski areas. Salt Lake City, Denver, Lincoln and Omaha are also s<strong>to</strong>ps<br />
on the route <strong>to</strong> Chicago. Ridership in FFY 2004-05 was 347,856, an increase of<br />
3.6 percent from the prior year.<br />
The Southwest Chief (Los Angeles-Albuquerque-Kansas City-Chicago)<br />
The daily round-trip Southwest Chief provides the only rail service in <strong>California</strong><br />
from Los Angeles east <strong>to</strong> Vic<strong>to</strong>rville, Bars<strong>to</strong>w and Needles. The Route continues<br />
<strong>to</strong> the Grand Canyon at Flagstaff and <strong>to</strong> Albuquerque, Kansas City, and Chicago.<br />
Ridership was 295,515 in FFY 2004-05, an increase of 1.9 percent from the<br />
prior year.<br />
The Sunset Limited (Los Angeles-San An<strong>to</strong>nio-New Orleans-Orlando)<br />
The Sunset Limited operates three days a week in each direction and is the only<br />
rail service <strong>to</strong> Palm Springs. It continues east, connecting <strong>California</strong> <strong>to</strong> Tucson,<br />
El Paso, San An<strong>to</strong>nio, Hous<strong>to</strong>n, New Orleans, Mobile, Jacksonville and Orlando.<br />
It is Amtrak’s only transcontinental passenger train. The Texas Eagle, which links<br />
Chicago with San An<strong>to</strong>nio, carries through-cars <strong>to</strong> and from the Sunset Limited.<br />
Ridership in FFY 2004-05 was 81,348, a decrease of 15.6 percent from the<br />
previous year.<br />
AMTRAK RIDERSHIP BY STATION<br />
Figure 5F shows ridership at each Amtrak train and bus station in <strong>California</strong> for<br />
FFYs 2001-02 through 2004-05. This table includes ridership on <strong>State</strong>-supported<br />
trains and buses as well as Amtrak’s basic system routes. Stations with ticket<br />
agent or checked baggage services are also identified.<br />
61
<strong>2005</strong>-<strong>06</strong> – <strong>2015</strong>-<strong>16</strong> <strong>California</strong> <strong>State</strong> <strong>Rail</strong> <strong>Plan</strong><br />
Figure 5F<br />
AMTRAK TRAIN AND BUS RIDERSHIP BY STATION IN CALIFORNIA<br />
FEDERAL FISCAL YEARS 2001-02 TO 2004-05 (See Note)<br />
04-05 Ridership Ridership Ridership Ridership Routes Serving Station *<br />
Rank Station County 2004-05 2003-04 2002-03 2001-02 PS SJ CC CS CZ SC SL Services<br />
1 L. A. Union Station Los Angeles 1,576,145 1,489,170 1,440,484 1,202,612 TB B T T T A, Bg<br />
2 Sacramen<strong>to</strong> Sacramen<strong>to</strong> 1,072,278 1,0<strong>16</strong>,058 1,007,172 913,525 TB T T T A, Bg<br />
3 San Diego San Diego 855,493 796,288 753,4<strong>06</strong> 661,290 TB B A, Bg<br />
4 Emeryville Alameda 691,523 651,715 678,675 671,830 T T T T A, Bg<br />
5 Bakersfield Kern 681,034 666,635 697,573 663,9<strong>16</strong> B T A, Bg<br />
6 Irvine Orange 565,147 474,125 350,955 213,983 T A<br />
7 Fuller<strong>to</strong>n Orange 405,654 378,717 332,288 254,5<strong>16</strong> T T A, Bg<br />
8 Solana Beach San Diego 400,981 378,530 346,<strong>06</strong>9 294,771 TB B A, Bg<br />
9 Davis Yolo 344,696 318,299 315,072 290,044 B T T T A, Bg<br />
10 Martinez Contra Costa 341,555 328,026 333,146 319,995 T T T T A, Bg<br />
11 Oakland Alameda 331,488 321,045 329,092 326,847 T TB T B A, Bg<br />
12 Anaheim Orange 317,022 291,261 248,636 174,046 T A, Bg<br />
13 Oceanside San Diego 305,136 310,590 329,517 272,420 TB B A, Bg<br />
14 S<strong>to</strong>ck<strong>to</strong>n San Joaquin 277,769 265,870 279,619 288,372 TB A, Bg<br />
15 Santa Barbara Santa Barbara 270,080 294,358 284,976 244,469 TB B B T A, Bg<br />
<strong>16</strong> Fresno Fresno 260,657 242,931 261,541 229,213 T A, Bg<br />
17 San Juan Capistrano Orange 258,243 262,412 268,290 234,734 TB B A<br />
18 Richmond Contra Costa 223,029 203,687 170,477 148,103 T T<br />
19 San Jose Santa Clara 209,683 205,753 221,103 237,852 B TB T A, Bg<br />
20 San Francisco San Francisco 208,7<strong>16</strong> 196,634 196,892 196,892 B B B B A, Bg<br />
21 Santa Ana Orange 175,530 174,824 180,514 140,028 TB B A, Bg<br />
22 Hanford Kings 158,359 151,125 159,515 149,758 T A, Bg<br />
23 Suisun-Fairfield Solano 117,240 108,825 101,7<strong>16</strong> 92,721 T<br />
24 San Luis Obispo San Luis Obispo 109,538 89,985 90,391 88,296 TB B B T A, Bg<br />
25 Merced Merced 88,930 86,774 94,646 87,191 T A, Bg<br />
26 Oxnard Ventura 81,423 92,044 95,295 83,957 TB B T A, Bg<br />
27 Great America Santa Clara 75,127 72,570 82,095 94,434 TB<br />
28 Berkeley Alameda 73,993 63,840 63,603 73,198 T<br />
29 Van Nuys Los Angeles 72,252 79,425 78,404 74,998 TB B A, Bg<br />
30 Modes<strong>to</strong> Stanislaus 71,986 73,296 73,658 68,475 T A, Bg<br />
31 Roseville Placer 70,373 66,189 66,377 64,085 TB T<br />
32 Goleta Santa Barbara 66,531 45,666 30,299 24,452 T<br />
33 Chatsworth Los Angeles 44,432 46,365 41,749 24,920 TB<br />
34 Auburn Placer 43,239 45,773 46,213 40,228 B TB<br />
35 Glendale Los Angeles 42,734 47,902 51,290 47,087 TB B T<br />
36 Ventura Ventura 37,898 38,002 34,581 29,795 TB B<br />
37 Simi Valley Ventura 36,512 41,455 48,029 41,578 TB B T<br />
38 Burbank Airport Los Angeles 36,130 36,989 38,988 31,194 T B<br />
39 Rocklin Placer 32,645 34,982 39,582 35,233 B TB<br />
40 Fremont Alameda 30,919 28,001 26,496 29,401 B TB<br />
41 Salinas Monterey 25,425 27,920 28,352 29,867 B B T A, Bg<br />
42 Hayward Alameda 23,764 23,776 23,670 25,598 TB<br />
43 Corcoran Kings 23,469 22,817 23,831 26,908 T<br />
44 Camarillo Ventura 21,309 18,730 13,911 8,325 T<br />
45 Antioch-Pittsburg Contra Costa 21,204 20,732 20,463 21,047 T<br />
46 Grover Beach San Luis Obispo 18,882 <strong>16</strong>,836 <strong>16</strong>,927 <strong>16</strong>,137 TB B B<br />
47 Old Town San Diego San Diego 18,295 1,505 -- -- T<br />
48 Chico Butte 18,155 17,177 <strong>16</strong>,808 17,<strong>06</strong>8 B B T<br />
49 San Bernardino San Bernardino <strong>16</strong>,<strong>06</strong>9 19,112 20,354 21,664 B T<br />
50 Carpinteria Santa Barbara 15,880 17,211 14,086 12,539 TB B<br />
* Route and Symbol Key<br />
PS Pacific Surfliner (San Luis Obispo-Los Angeles-San Diego) CZ Calif. Zephyr (Emeryville-Chicago)<br />
SJ San Joaquin (Bay Area/Sacramen<strong>to</strong>-Fresno-Bakersfield) SC Southwest Chief (Los Angeles-Chicago)<br />
CC Capi<strong>to</strong>l Corridor (Auburn-Sacramen<strong>to</strong>-Oakland-San Jose) SL Sunset Limited (Los Angeles-Orlando)<br />
CS Coast Starlight (Los Angeles-Oakland-Sacramen<strong>to</strong>-Seattle)<br />
T Train at this location TB Train and bus at this location B Connecting bus at this location<br />
A Ticket Agent at this location Bg Checked baggage at this location<br />
NOTE: Official Amtrak ridership data for four Federal Fiscal Years (Oc<strong>to</strong>ber 2001 through September <strong>2005</strong>). Includes all rail and bus passengers<br />
originating or terminating at each station on all routes shown above.<br />
62
Chapter V – The <strong>California</strong> Passenger <strong>Rail</strong> Network<br />
Figure 5F (Continued)<br />
AMTRAK TRAIN AND BUS RIDERSHIP BY STATION IN CALIFORNIA<br />
FEDERAL FISCAL YEARS 2000/01 TO 2004/05<br />
04-05 2004-05 2003-04 2002-03 2001-02 Routes Serving Station * Services<br />
Rank Station County Ridership Ridership Ridership Ridership PS SJ CC CS CZ SC SL<br />
51 Redding Shasta 15,462 18,<strong>16</strong>8 18,049 14,522 B B T<br />
52 Turlock-Denair Stanislaus 15,083 13,576 13,888 14,123 T<br />
53 Wasco Kern 13,936 14,557 14,370 15,975 T<br />
54 Paso Robles San Luis Obispo 13,551 13,997 13,802 14,030 B B B T<br />
55 Riverside Riverside 13,319 11,692 11,534 8,254 B<br />
56 Needles San Bernardino 13,045 19,669 19,153 18,084 T<br />
57 Madera Madera 12,121 12,4<strong>06</strong> 13,202 12,679 T<br />
58 Truckee Nevada 11,992 11,212 11,355 11,051 B B T<br />
59 Yosemite Natl. Park Mariposa 11,023 13,368 <strong>16</strong>,792 14,250 B<br />
60 Long Beach Los Angeles 9,193 7,684 7,076 8,607 B B<br />
61 Moorpark Ventura 9,177 8,146 8,453 5,905 TB<br />
62 Santa Rosa Sonoma 9,126 9,653 10,199 11,030 B B<br />
63 Santa Maria Santa Barbara 8,701 8,408 7,810 7,398 B B B<br />
64 South Lake Tahoe El Dorado 8,313 9,788 9,131 6,423 B B<br />
65 Vic<strong>to</strong>rville San Bernardino 7,296 6,505 5,2<strong>06</strong> 4,354 T<br />
66 Lodi San Joaquin 7,024 7,718 7,900 5,565 TB<br />
67 Guadalupe Santa Barbara 6,981 6,362 6,537 5,408 TB<br />
68 SLO-Cal Poly San Luis Obispo 6,833 4,377 3,492 3,285 B T<br />
69 Ontario San Bernardino 6,802 6,613 6,381 6,254 B T<br />
70 San Clemente Orange 6,763 6,135 5,015 3,862 T<br />
71 San Pedro Los Angeles 5,4<strong>06</strong> 6,663 4,909 2,509 B<br />
72 Napa Napa 5,286 5,253 5,376 6,303 B B<br />
73 Pasadena Los Angeles 5,224 4,762 5,939 5,427 B<br />
74 Surf/Lompoc Santa Barbara 5,<strong>06</strong>7 3,961 7,034 7,646 TB<br />
75 Santa Clarita-Newhall Los Angeles 4,520 3,953 3,886 3,569 B B<br />
76 Dunsmuir Siskiyou 4,517 4,667 4,187 4,593 T<br />
77 Colfax Placer 4,334 4,102 4,309 3,850 B B T<br />
78 Claremont Los Angeles 4,256 4,051 4,211 4,176 B<br />
79 Bars<strong>to</strong>w San Bernardino 4,171 4,288 4,174 3,546 B T<br />
80 Monterey Monterey 4,101 5,573 5,491 8,284 B B<br />
81 Arcata Humboldt 3,905 4,202 3,894 3,837 B B<br />
82 <strong>State</strong>line El Dorado 3,702 3,848 249 976 B B<br />
83 Vallejo-Marine World Solano 3,690 4,008 5,987 6,814 B B<br />
84 Lancaster Los Angeles 3,491 3,178 2,925 2,842 B<br />
85 Marysville Yuba 3,253 2,924 2,977 2,649 B B<br />
86 Eureka Humboldt 3,123 3,2<strong>16</strong> 3,280 3,379 B B<br />
87 Solvang Santa Barbara 2,922 3,071 4,421 4,545 B B<br />
88 Oroville Butte 2,717 2,662 2,645 2,614 B B<br />
89 Nevada City Nevada 2,571 4,572 8,292 5,928 B B<br />
90 Placerville El Dorado 2,481 2,363 2,090 2,681 B B<br />
91 McKinleyville Humboldt 2,300 1,863 1,990 1,344 B B<br />
92 Vallejo Napa 2,226 2,058 1,980 578 B B<br />
93 Palm Springs Riverside 2,2<strong>16</strong> 1,649 1,948 1,713 T<br />
94 Petaluma Sonoma 2,126 2,<strong>06</strong>6 2,052 2,201 B B<br />
95 Ukiah Mendocino 2,<strong>06</strong>5 2,141 1,683 1,799 B B<br />
96 Oakland Coliseum Alameda 1,924 1,223 2,051 1,050 T<br />
97 Hemet Riverside 1,8<strong>06</strong> 1,644 1,811 1,482 B<br />
98 Rohnert Park Sonoma 1,742 1,834 1,947 1,986 B B<br />
99 Visalia Tulare 1,705 1,100 1,204 957 B<br />
100 Palmdale Los Angeles 1,666 1,429 1,240 1,192 B<br />
* Route and Symbol Key:<br />
PS Pacific Surfliner (San Luis Obispo-Los Angeles-San Diego) CZ Calif. Zephyr (Emeryville-Chicago)<br />
SJ San Joaquin (Bay Area/Sacramen<strong>to</strong>-Fresno-Bakersfield) SC Southwest Chief (Los Angeles-Chicago)<br />
CC Capi<strong>to</strong>l Corridor (Auburn-Sacramen<strong>to</strong>-Oakland-San Jose) SL Sunset Limited (Los Angeles-Orlando)<br />
CS Coast Starlight (Los Angeles-Oakland-Sacramen<strong>to</strong>-Seattle)<br />
T Train at this location TB Train and bus at this location B Connecting bus at this location<br />
A Ticket Agent at this location Bg Checked baggage at this location<br />
63
<strong>2005</strong>-<strong>06</strong> – <strong>2015</strong>-<strong>16</strong> <strong>California</strong> <strong>State</strong> <strong>Rail</strong> <strong>Plan</strong><br />
Figure 5F (Continued)<br />
AMTRAK TRAIN AND BUS RIDERSHIP BY STATION IN CALIFORNIA<br />
FEDERAL FISCAL YEARS 2000/01 TO 2004/05<br />
04-05 Ridership Ridership Ridership Ridership Routes Serving Station * Services<br />
Rank Station County 2004-05 2003-04 2002-03 2001-02 PS SJ CC CS CZ SC SL<br />
101 Dublin-Pleasan<strong>to</strong>n Alameda 1,6<strong>06</strong> 1,397 1,254 1,325 B<br />
102 Lompoc Santa Barbara 1,582 1,982 3,017 4,418 B<br />
103 Tehachapi Kern 1,545 1,815 1,768 1,231 B<br />
104 Palm Springs Airport Riverside 1,454 1,349 1,293 1,615 B<br />
105 Mojave Kern 1,135 865 867 956 B<br />
1<strong>06</strong> Red Bluff Tehama 1,093 1,010 925 1,053 B B<br />
107 Grass Valley Nevada 1,089 1,747 3,407 3,485 B B<br />
108 Indio Riverside 1,052 1,254 911 1,092 B<br />
109 Santa Paula Ventura 1,019 891 873 799 B<br />
110 Livermore Alameda 1,0<strong>16</strong> 791 760 932 B<br />
111 Garberville Humbolt 1,003 822 670 767 B B<br />
112 Atascadero San Luis Obispo 988 1,086 919 990 B B<br />
113 Fortuna Humbolt 905 965 803 863 B B<br />
114 Willits Mendocino 823 848 782 1,125 B<br />
115 Tracy San Joaquin 807 735 820 763 B<br />
1<strong>16</strong> Pomona Los Angeles 771 786 679 679 T<br />
117 Corning Tehama 708 533 591 653 B B<br />
118 Perris Riverside 677 490 351 386 B<br />
119 Carmel Monterey 561 863 865 1,079 B B<br />
120 Moreno Valley Riverside 522 557 332 332 B<br />
121 La Crescenta Los Angeles 464 414 498 444 B<br />
122 Healdsburg Sonoma 4<strong>06</strong> 357 333 333 B B<br />
123 Fillmore Ventura 385 446 387 369 B<br />
124 Palm Desert Riverside 378 404 449 431 B<br />
125 Mariposa Mariposa 331 363 326 342 B<br />
126 Gilroy Santa Clara 330 307 368 507 B B<br />
127 Buell<strong>to</strong>n Santa Barbara 321 350 344 220 B<br />
128 Beaumont Riverside 303 256 244 252 B<br />
129 Lay<strong>to</strong>nville Mendocino 273 171 205 120 B B<br />
130 Rosamond Kern 264 268 261 266 B<br />
131 Soda Springs Nevada 226 180 235 259 B B<br />
132 Adelan<strong>to</strong> Jct. San Bernardino 2<strong>16</strong> 130 156 76 B<br />
133 King City Monterey 205 156 72 72 B B<br />
134 Midpines Mariposa 176 141 142 342 B<br />
135 Cloverdale Sonoma <strong>16</strong>0 237 199 225 B B<br />
136 Rio Dell-Scotia Humbolt 140 214 <strong>16</strong>2 132 B B<br />
137 Littlerock Los Angeles 103 37 58 42 B<br />
138 El Portal Mariposa 91 62 92 49 B<br />
139 Lemoore Kings 90 34 64 44 B<br />
140 Leggett Mendocino 52 68 65 49 B B<br />
141 Baker San Bernardino 39 26 -- -- B<br />
142 Kettleman City Kings 32 12 30 25 B<br />
143 Sonora Tuolumne 26 605 <strong>16</strong>4 -- B<br />
* Route and Symbol Key:<br />
PS Pacific Surfliner (San Luis Obispo-Los Angeles-San Diego) CZ Calif. Zephyr (Emeryville-Chicago)<br />
SJ San Joaquin (Bay Area/Sacramen<strong>to</strong>-Fresno-Bakersfield) SC Southwest Chief (Los Angeles-Chicago)<br />
CC Capi<strong>to</strong>l Corridor (Auburn-Sacramen<strong>to</strong>-Oakland-San Jose) SL Sunset Limited (Los Angeles-Orlando)<br />
CS Coast Starlight (Los Angeles-Oakland-Sacramen<strong>to</strong>-Seattle)<br />
T Train at this location TB Train and bus at this location B Connecting bus at this location<br />
A Ticket Agent at this location Bg Checked baggage at this location<br />
64
Chapter V – The <strong>California</strong> Passenger <strong>Rail</strong> Network<br />
OTHER PASSENGER RAIL SERVICES<br />
Other railroads in <strong>California</strong> offer limited rail passenger service, which is<br />
generally <strong>to</strong>urist oriented. These non-Amtrak intercity rail passenger services<br />
remain subject <strong>to</strong> the regula<strong>to</strong>ry jurisdiction of the CPUC, FRA, and the Surface<br />
Transportation Board (STB).<br />
The Sierra <strong>Rail</strong>road (formally the <strong>California</strong> Western <strong>Rail</strong>road) between<br />
Fort Bragg and Willits in Mendocino County has been the principal privately<br />
owned railroad in <strong>California</strong> offering regularly scheduled rail passenger service.<br />
Sierra <strong>Rail</strong>road acquired the line and opened it in May 2004 for passenger<br />
excursion service. Excursion related passenger traffic on the 40-mile route is the<br />
primary business. The Sierra <strong>Rail</strong>road has begun an ongoing acquisition and<br />
rehabilitation program for stations, track and rolling s<strong>to</strong>ck. The contact phone<br />
number for the “Skunk Train” is 1-800-866-<strong>16</strong>90.<br />
Other railroads offer rail passenger <strong>to</strong>urist service generally only during summer<br />
and holiday periods. For additional information on rail passenger <strong>to</strong>urist service,<br />
call <strong>California</strong> Tourism at 1-800-862-2543 or access their website at<br />
www.visitcalifornia.com.<br />
65
<strong>2005</strong>-<strong>06</strong> – <strong>2015</strong>-<strong>16</strong> <strong>California</strong> <strong>State</strong> <strong>Rail</strong> <strong>Plan</strong><br />
Figure 6A<br />
66
Chapter VI – Pacific Surfliner Route<br />
CHAPTER VI<br />
PACIFIC SURFLINER ROUTE<br />
SAN LUIS OBISPO-SANTA BARBARA-<br />
LOS ANGELES-SAN DIEGO<br />
PRINCIPAL <strong>2005</strong>-<strong>06</strong> <strong>to</strong> <strong>2015</strong>-<strong>16</strong> ROUTE OBJECTIVES<br />
• Improve On-Time Performance <strong>to</strong> 90% by <strong>2015</strong>-<strong>16</strong>.<br />
• Improve passenger comfort, convenience, and information with<br />
improved services on board and at stations.<br />
• Improve intermodal connectivity:<br />
o Cross-ticketing and coordinated schedules with Metrolink and Coaster.<br />
o Improved coordination with urban transit.<br />
o Improved Amtrak Thruway service.<br />
• Reduce Travel Times:<br />
o San Diego <strong>to</strong> Los Angeles - 2 hours-30 minutes (15 minute reduction).<br />
o Los Angeles <strong>to</strong> San Luis Obispo - 5 hours-5 minutes (20 minute<br />
reduction).<br />
• Increase annual ridership 40% from 2,578,000 <strong>to</strong> 3,611,000.<br />
• Increase annual revenues 60% from $28.4 million <strong>to</strong> $45.4 million for the<br />
<strong>State</strong>-supported 70% of the Route.<br />
• Increase revenue/cost (farebox) ratio from 58.0% <strong>to</strong> 65.0%.<br />
• Increase Service Frequency:<br />
o From 11 <strong>to</strong> 13 daily round-trips between San Diego – Los Angeles.<br />
o From 5 <strong>to</strong> 6 daily round-trips between Los Angeles – Santa Barbara.<br />
o From 2 <strong>to</strong> 3 daily round-trips between Santa Barbara – San Luis Obispo.<br />
• Expand Service:<br />
o San Francisco – San Luis Obispo – first daily round-trip in 2007-08,<br />
second daily round-trip in 2013-14.<br />
This Chapter presents the ten-year operational and service improvement and train<br />
service expansion plans for the Pacific Surfliner Route. The Chapter also provides<br />
information on route his<strong>to</strong>ry, route performance, route description, and route<br />
administration. Figure 6A is the Pacific Surfliner route map, including the<br />
connecting buses.<br />
67
<strong>2005</strong>-<strong>06</strong> – <strong>2015</strong>-<strong>16</strong> <strong>California</strong> <strong>State</strong> <strong>Rail</strong> <strong>Plan</strong><br />
TEN-YEAR OPERATIONAL AND SERVICE IMPROVEMENT<br />
PLANS<br />
ON-TIME PERFORMANCE<br />
The Department’s goal is <strong>to</strong> increase OTP <strong>to</strong> 90 percent by the end of the <strong>Plan</strong><br />
period. This goal is based on the full implementation of the unconstrained capital<br />
program described in Chapter II. Increased OTP provides improved service<br />
reliability and faster running times. Since 2001-02 OTP has been about<br />
87 percent, due <strong>to</strong> the completion of key capital projects and an improved<br />
preventative maintenance program for locomotives. However, two fac<strong>to</strong>rs caused<br />
the OTP <strong>to</strong> fall <strong>to</strong> 72.9 percent in 2004-05. First, serious winter s<strong>to</strong>rms damaged<br />
track – interrupting and delaying service. Second, there has been a significant<br />
increase in freight traffic and in the length of freight trains. OTP has been<br />
severely affected by the increase in freight traffic, particularly from Los Angeles<br />
<strong>to</strong> San Luis Obispo, where it is almost entirely single track and many sidings are<br />
not long enough <strong>to</strong> accommodate the new longer freight trains.<br />
In the near term, the completion of on-going track projects will somewhat improve<br />
OTP. Further in<strong>to</strong> the ten-year period, projects on the north end <strong>to</strong> add sidings,<br />
increase the length of existing sidings, and upgrade the signaling system will<br />
improve OTP. The LAUS Run-Through Track project also will improve OTP.<br />
Additionally, the Department will work with the UP, BNSF, Metrolink, and<br />
Amtrak <strong>to</strong> identify and implement measures <strong>to</strong> enhance schedule reliability.<br />
PASSENGER SAFETY, COMFORT, CONVENIENCE, AND<br />
INFORMATION<br />
In the short-term the Department has a number of projects <strong>to</strong> improve passenger<br />
amenities, including improved: real-time signage at stations and on board, food<br />
service, and electronic passenger information. The Department will continue <strong>to</strong><br />
explore the latest technology <strong>to</strong> improve passenger safety, comfort, convenience,<br />
and information.<br />
INTERMODAL CONNECTIVITY<br />
The next phase in intermodal connectivity between the Pacific Surfliners and<br />
Metrolink and Coaster is cross-ticketing and improved schedule coordination.<br />
“Next-generation” ticket vending machines are planned <strong>to</strong> be in the initial stages<br />
of operation by 20<strong>06</strong>. These machines will allow the purchase of a ticket for a<br />
combined Amtrak/Metrolink rail trip. The program is also planned <strong>to</strong> be expanded<br />
<strong>to</strong> the Coaster. Once the machines are in operation, schedules will be further<br />
coordinated and joint trip destinations will be marketed.<br />
In <strong>2005</strong>, the Department initiated a program on the Pacific Surfliners where<br />
conduc<strong>to</strong>rs offer free transfers <strong>to</strong> participating transit services. Currently SLO<br />
Transit, Regional Transit Authority, South County Area Transit, and Guadalupe<br />
68
Chapter VI – Pacific Surfliner Route<br />
Transit are participating. Within the ten-year period, the Department plans <strong>to</strong><br />
expand this program <strong>to</strong> additional transit agencies. In conjunction with the free<br />
transfer program, marketing and passenger information programs will be expanded<br />
<strong>to</strong> provide additional information on intermodal connectivity with local transit.<br />
The Department plans <strong>to</strong> expand and improve Amtrak Thruway bus service on the<br />
Route, including additional connections north <strong>to</strong> the San Francisco Bay Area.<br />
TRAVEL TIMES<br />
Current San Diego <strong>to</strong> Los Angeles travel times average 2 hours, 45 minutes;<br />
Los Angeles <strong>to</strong> Goleta (just north of Santa Barbara) averages 2 hours, 58 minutes;<br />
and Goleta <strong>to</strong> San Luis Obispo averages 2 hours, 27 minutes. The travel time<br />
goals below assume that the unconstrained capital program described in Chapter II<br />
is fully implemented. The Department’s goal is <strong>to</strong> reduce travel times as follows:<br />
• San Diego <strong>to</strong> Los Angeles - 2 hours, 30 minutes (15 minute reduction).<br />
• Los Angeles <strong>to</strong> San Luis Obispo - 5 hours, 5 minutes (20 minute reduction).<br />
Between San Diego and Los Angeles reductions will be accomplished through the<br />
completion of capital projects that will reduce actual run times as well as reduce<br />
the recovery time in the schedule. These projects include double-tracking in<br />
North San Diego County, triple-tracking between Los Angeles and Fuller<strong>to</strong>n, and<br />
the LAUS Run-through Track project that will greatly improve the efficiency of<br />
operations at Union Station. On the north end between Santa Barbara and<br />
San Luis Obispo, updating signaling <strong>to</strong> Centralized Traffic Control (CTC),<br />
increasing siding lengths, new siding construction, and upgrading track will also<br />
reduce running times and allow for a reduction in schedule recovery time.<br />
(See Chapter II, for additional information about the capital projects.)<br />
RIDERSHIP, REVENUE, AND FAREBOX RATIO<br />
The Department’s goals for ridership, revenue and farebox will be achieved<br />
through the capital, operational, and service improvements and service expansions<br />
discussed in this Chapter as well as Chapters II, III, and IV. They are as follows:<br />
• Increase annual ridership 40 percent from 2,578,000 <strong>to</strong> 3,611,000.<br />
• Increase annual revenues 60 percent from $28.4 million <strong>to</strong> $45.4 million for<br />
the <strong>State</strong>-supported 70 percent of the Route.<br />
• Increase revenue/cost (farebox) ratio from 58.0 percent <strong>to</strong> 65.0 percent.<br />
69
<strong>2005</strong>-<strong>06</strong> – <strong>2015</strong>-<strong>16</strong> <strong>California</strong> <strong>State</strong> <strong>Rail</strong> <strong>Plan</strong><br />
TEN-YEAR PLANNED TRAIN SERVICE EXPANSION PLANS<br />
INCREASED SERVICE FREQUENCIES<br />
The Department anticipates there will be eventual demand for 13 round-trips on<br />
the Pacific Surfliners between San Diego and Los Angeles.<br />
It is important <strong>to</strong> note that the start-up dates for service are based on projected<br />
service needs. Demonstrated ridership demand, approval from Amtrak and the<br />
relevant railroad(s), availability of capital funding and equipment, completion of<br />
necessary capital projects, and availability of additional operating funding will<br />
affect when each of the service improvements can be implemented.<br />
The Department’s proposed expansion of the Pacific Surfliner Route is as follows:<br />
2009-10 Los Angeles-San Diego, twelfth round-trip.<br />
2012-13 Los Angeles-San Diego, thirteenth round-trip.<br />
2013-14 Los Angeles-Goleta, sixth round-trip,<br />
Goleta-San Luis Obispo, third round-trip.<br />
SAN FRANCISCO TO SAN LUIS OBISPO (AND LOS ANGELES)<br />
EXTENSION<br />
The extension of the Pacific Surfliners from San Luis Obispo <strong>to</strong> San Francisco via<br />
the Coast Route would close a key gap in the <strong>State</strong>-supported intercity rail system<br />
by providing direct train service from San Francisco <strong>to</strong> Los Angeles.<br />
The Department plans one round-trip train between San Francisco and San Luis<br />
Obispo, starting in 2007-08, with a second train in 2013-14. The first train would<br />
be operated from San Luis Obispo <strong>to</strong> Los Angeles as an extension of the new<br />
Pacific Surfliner train added on November 17, 2004, and would provide through<br />
train service between San Francisco and Los Angeles. The second train would<br />
operate as an extension of the planned third Los Angeles-San Luis Obispo roundtrip.<br />
Direct train connections <strong>to</strong> San Diego at Los Angeles would be available on<br />
most trips. Regional transportation planning agencies have led the planning for<br />
this extension. The Department expects that both regional and local agencies will<br />
continue <strong>to</strong> provide an important role in the planning and operation of this<br />
extension. For more detailed information on this route expansion see Chapter X.<br />
ROUTE HISTORY AND PERFORMANCE<br />
Amtrak was created in 1971 <strong>to</strong> revitalize passenger rail service. Its San Diegan<br />
Route operated on tracks owned by Atchison Topeka and Santa Fe <strong>Rail</strong>way<br />
(ATSF) between Los Angeles and San Diego. These trains functioned primarily<br />
as a connection <strong>to</strong> long-haul trains, as opposed <strong>to</strong> a local transportation network<br />
for passengers traveling within the corridor. By the end of 1971, service was three<br />
daily round-trips, and remained at this level until <strong>State</strong> involvement began in 1976.<br />
70
Chapter VI – Pacific Surfliner Route<br />
The segment north of Los Angeles <strong>to</strong> Santa Barbara and San Luis Obispo, on<br />
Southern Pacific Transportation Company (SP) tracks, was served by Amtrak by a<br />
daily round-trip between Los Angeles and Oakland, with this train operating<br />
through Oakland <strong>to</strong> Seattle three times per week. This train was eventually named<br />
the Coast Starlight.<br />
<strong>State</strong> support of the route began in 1976. This corridor has been unique among<br />
<strong>State</strong>-supported routes in <strong>California</strong> because some individual trains were entirely<br />
supported by Amtrak, since they were part of their basic system. However, the<br />
<strong>State</strong> paid most of the costs of the other trains, which were considered<br />
<strong>State</strong>-supported service. In Oc<strong>to</strong>ber 1995, the cost allocation system changed and<br />
the <strong>State</strong> began support of 64 percent of all service, instead of supporting<br />
individual trains. This support level increased <strong>to</strong> 70 percent in November 2004.<br />
In 1988, the San Diegan Route was extended <strong>to</strong> Santa Barbara with a further<br />
extension <strong>to</strong> San Luis Obispo in 1995. In 2000, the route was renamed the<br />
Pacific Surfliner in recognition of its expanded service area. A second round-trip<br />
between Los Angeles and San Luis Obispo was added on November 17, 2004.<br />
Service on the Pacific Surfliners between Los Angeles and San Diego increased<br />
from the original three round-trips <strong>to</strong> the current level of eleven round-trips on<br />
Monday through Thursday and twelve round-trips on Friday through Sunday as<br />
follows:<br />
9/1/76 Los Angeles-San Diego: fourth round-trip added, <strong>State</strong>-supported.<br />
4/24/77 Los Angeles-San Diego: fifth round-trip added, <strong>State</strong>-supported.<br />
2/14/78 Los Angeles-San Diego: sixth round-trip added, <strong>State</strong>-supported.<br />
10/26/80 Los Angeles-San Diego: seventh round-trip added, Amtrak basic<br />
system.<br />
10/25/81 <strong>State</strong>-supported Spirit of <strong>California</strong> Los Angeles-Sacramen<strong>to</strong> roundtrip<br />
overnight train provided Los Angeles <strong>to</strong> Santa Barbara service.<br />
Service discontinued Oc<strong>to</strong>ber 1, 1983.<br />
10/25/87 Los Angeles-San Diego: eighth round-trip added, <strong>State</strong>-supported.<br />
6/26/88 First train extended <strong>to</strong> Santa Barbara, <strong>State</strong>-supported.<br />
10/28/90 Second train extended <strong>to</strong> Santa Barbara, <strong>State</strong>-supported.<br />
10/25/92 Los Angeles-San Diego: ninth round-trip added, Amtrak basic<br />
system.<br />
2/1/94 Third train extended <strong>to</strong> Santa Barbara, <strong>State</strong>-supported.<br />
5/15/95 Los Angeles-San Diego: ninth round-trip discontinued.<br />
10/29/95 Los Angeles-San Luis Obispo: first round-trip (fourth round-trip,<br />
Los Angeles-Santa Barbara).<br />
71
<strong>2005</strong>-<strong>06</strong> – <strong>2015</strong>-<strong>16</strong> <strong>California</strong> <strong>State</strong> <strong>Rail</strong> <strong>Plan</strong><br />
10/26/97 Los Angeles-San Diego: ninth round-trip res<strong>to</strong>red and tenth roundtrip<br />
added.<br />
10/25/98 Los Angeles-San Diego: eleventh round-trip added.<br />
5/21/01 Los Angeles-San Diego: twelfth Friday through Sunday round-trip<br />
added.<br />
11/17/04 Los Angeles-San Luis Obispo: second round-trip added (fifth roundtrip,<br />
Los Angeles-Santa Barbara).<br />
HISTORICAL PERFORMANCE<br />
Figure 6B shows ridership and financial performance data on an annual basis from<br />
the start of <strong>State</strong>-supported service in 1976-77 through 2004-05. Ridership and<br />
farebox return climbed steadily, with the years 1987-88 through 1992-93<br />
experiencing particularly strong ridership growth and financial strength.<br />
The farebox ratio was near or over 100 percent for these six consecutive years, and<br />
ridership peaked at 1.8 million in 1992-93, and did not again reach this level until<br />
2002-03.<br />
However, introduction of Metrolink commuter rail service in the Los Angeles<br />
basin in Oc<strong>to</strong>ber 1992 and Coaster commuter rail service in the San Diego area in<br />
1995 had a negative effect on ridership. In 1995, Amtrak also increased the<br />
amount and type of costs charged <strong>to</strong> the <strong>State</strong>, with a negative effect on farebox<br />
return. Farebox return reached a low of 33.9 percent in 1997-98.<br />
But overall ridership on the corridor has increased significantly in recent years,<br />
offsetting the initial impacts of the new commuter services. Ridership reached<br />
two million in 2002-03, and farebox return has been over 50 percent since<br />
2000-01. The introduction of the “<strong>Rail</strong> 2 <strong>Rail</strong>” Program on Amtrak and Metrolink<br />
service in September 2004 and in April 2004 on the Coaster has caused a large<br />
increase in ridership. The program allows joint ticket honoring between Amtrak<br />
and commuter rail services. Ridership reached a peak of 2.5 million in 2004-05,<br />
a 40 percent increase over 2001-02 ridership (the year before the introduction of<br />
<strong>Rail</strong> 2 <strong>Rail</strong>).<br />
72
Chapter VI – Pacific Surfliner Route<br />
Figure 6B<br />
Ridership Data<br />
PACIFIC SURFLINER Route<br />
Annual Operating Performance - <strong>State</strong> Fiscal Years<br />
Financial Data for Operations - <strong>State</strong> Supported Train and Bus Service Only*<br />
<strong>State</strong><br />
<strong>State</strong><br />
Fiscal All Trains Supported* Train Loss Farebox<br />
Year Ridership PM/TM Ridership Revenue Expense Loss <strong>State</strong> Cost Amtrak Cost per PM Ratio<br />
Notes (F1) (F2) (F3) (F4) (F5) (F6)<br />
1973-74 (S1) 381,844<br />
1974-75 356,630<br />
1975-76 376,900<br />
1976-77 (S2) 607,976 146 101,572 $ 598,140 $ 1,662,714 $ 1,<strong>06</strong>4,574 $ 548,534<br />
36.0%<br />
1977-78 (S3) 753,246 128 258,800 $ 1,446,036 $ 3,768,<strong>06</strong>5 $ 2,322,029 $ 1,325,087<br />
38.4%<br />
1978-79 967,3<strong>16</strong> <strong>16</strong>3 415,865 $ 2,203,403 $ 4,333,602 $ 2,130,199 $ 1,178,667<br />
50.8%<br />
1979-80 1,218,196 177 557,113 $ 3,341,561 $ 5,536,840 $ 2,195,279 $ 1,<strong>06</strong>4,713<br />
60.4%<br />
1980-81 (S4) 1,238,135 152 555,418 $ 4,032,480 $ 6,572,539 $ 2,540,059 $ 1,233,490<br />
61.4%<br />
1981-82 1,<strong>16</strong>7,718 144 533,093 $ 4,097,254 $ 6,607,395 $ 2,510,141 $ 1,217,418<br />
6.3¢ 62.0%<br />
1982-83 1,131,146 138 488,6<strong>06</strong> $ 4,094,750 $ 6,928,334 $ 2,833,584 $ 1,374,097<br />
8.3¢ 59.1%<br />
1983-84 1,221,256 143 524,857 $ 4,842,400 $ 6,337,083 $ 1,494,683 $ 1,452,450<br />
4.1¢ 76.4%<br />
1984-85 1,240,003 152 568,902 $ 5,410,502 $ 6,411,308 $ 1,000,8<strong>06</strong> $ 1,212,261<br />
2.5¢ 84.4%<br />
1985-86 1,394,320 <strong>16</strong>7 597,025 $ 5,658,915 $ 6,424,634 $ 765,719 $ 1,097,966<br />
1.8¢ 88.1%<br />
1986-87 1,461,003 173 624,618 $ 6,072,523 $ 6,510,113 $ 437,590 $ 955,509<br />
1.0¢ 93.3%<br />
1987-88 (S5) 1,661,512 174 749,996 $ 8,223,462 $ 7,859,783 $ (363,679) $ 1,145,330<br />
(0.7¢) 104.6%<br />
1988-89 1,717,539 <strong>16</strong>4 865,003 $ 11,458,084 $ 10,563,459 $ (894,625) $ 794,159<br />
(1.2¢) 108.5%<br />
1989-90 1,746,673 174 882,<strong>16</strong>7 $ 12,189,942 $ 11,808,251 $ (381,691) $ 988,847<br />
(1.4¢) 103.2%<br />
1990-91 (S6) 1,791,781 159 946,988 $ 13,3<strong>06</strong>,307 $ 13,364,150 $ 57,843 $ 1,170,448<br />
(0.7¢) 99.6%<br />
1991-92 1,673,107 <strong>16</strong>1 884,224 $ 13,152,<strong>06</strong>3 $ 13,245,924 $ 93,861 $ 1,012,564<br />
(0.5¢) 99.3%<br />
1992-93 (S7) 1,810,572 155 951,987 $ 13,692,612 $ 13,254,709 $ (437,903) $ 958,857<br />
(0.8¢) 103.3%<br />
1993-94 (S8) 1,699,882 133 876,766 $ 12,725,094 $ 14,017,591 $ 1,292,497 $ 1,525,074 $ 727,987 0.9¢ 90.8%<br />
1994-95 (S9) 1,464,577 119 790,781 $ 11,805,859 $ <strong>16</strong>,<strong>06</strong>1,849 $ 4,255,990 $ 3,642,588 $ 1,700,424 5.0¢ 73.5%<br />
1995-96 (S10) 1,480,674 125 912,905 $ 13,553,553 $ 23,983,026 $ 10,429,473 $ 11,107,071 $ 863,230 11.4¢ 56.5%<br />
1996-97 1,617,641 134.7 1,035,290 $ 14,804,355 $ 39,563,546 $ 24,759,191 $ <strong>16</strong>,189,103 $ 10,020,544 24.5¢ 37.4%<br />
1997-98 (S11) 1,624,693 120.4 1,<strong>06</strong>9,547 $ 15,194,498 $ 44,769,723 $ 29,575,225 $ 20,369,417 $ 10,600,767 29.1¢ 33.9%<br />
1998-99 (S12) 1,563,275 101.9 1,047,394 $ <strong>16</strong>,401,625 $ 40,391,845 $ 23,990,220 $ 22,078,192 $ 4,014,071 25.3¢ 40.6%<br />
1999-00 1,567,318 99.3 1,050,103 $ 17,883,725 $ 37,497,489 $ 19,613,764 $ 20,8<strong>06</strong>,672 $ 1,381,986 19.8¢ 47.7%<br />
2000-01 (S13) 1,661,704 1<strong>06</strong>.2 1,113,342 $ 20,430,153 $ 38,215,732 $ 17,785,579 $ 21,911,398 $ 335,197 <strong>16</strong>.6¢ 53.5%<br />
2001-02 (S14) 1,742,768 108.3 1,<strong>16</strong>7,655 $ 20,922,453 $ 39,374,190 $ 18,451,737 $ 21,976,183 $ 502,080 <strong>16</strong>.6¢ 53.1%<br />
2002-03 2,030,491 114.1 1,360,429 $ 22,247,564 $ 42,331,531 $ 20,083,967 $ 23,901,407 $ 472,848 <strong>16</strong>.7¢ 52.6%<br />
2003-04 2,307,010 126.9 1,545,697 $ 24,559,183 $ 45,300,782 $ 20,741,599 $ 21,719,288 $ 94,883 <strong>16</strong>.0¢ 54.2%<br />
2004-05 (S15) 2,454,396 129.8 1,644,445 $ 26,660,048 $ 48,105,899 $ 21,445,851 $ 21,445,851<br />
15.7¢ 55.4%<br />
TOTAL 45,131,302 24,120,588 $ 331,008,544 $ 560,802,1<strong>06</strong> $ 229,793,562 $ 225,402,641<br />
* Through September 1995, the <strong>State</strong> supported specific trains; Amtrak operated the remaining trains as basic system trains not receiving <strong>State</strong><br />
funding. Between Oc<strong>to</strong>ber 1995 and Oc<strong>to</strong>ber 1997, the <strong>State</strong> supported 64 percent of the operation of all trainson the Pacific Surfliner Route; Amtrak<br />
supports 36 percent as basic system trains. Effective November 1997, <strong>State</strong> support increased <strong>to</strong> 67%. Effective December 2004, <strong>State</strong> support<br />
increased <strong>to</strong> 70%. <strong>State</strong> supports 100 percent of net cost ofconnecting buses; all data shown includes bus operations.<br />
(S1) Three round trips between Los Angeles and San Diego (LA-SD) (S8) Third <strong>State</strong>-supported LA-SB round trip added 2/1/94.<br />
(not <strong>State</strong>-supported) through 8/30/76.<br />
(S9) Ninth LA-SD round trip (<strong>State</strong>-supported in one direction only)<br />
(S2) Fourth LA-SD round trip (first <strong>State</strong>-supported train) added 9/1/76; discontinued 5/15/95.<br />
fifth LA-SD round trip (second <strong>State</strong>-supported train) added 4/24/77.<br />
(S10) Los Angeles-San Luis Obispo round trip added 10/29/95, also<br />
(S3) Sixth LA-SD round trip (third <strong>State</strong>-supported train) added 2/14/78.<br />
represents fourth LA-SB round trip.<br />
(S4) Seventh LA-SD round trip (not <strong>State</strong>-supported) added 10/26/80.<br />
(S11) Ninth LA-SD round trip res<strong>to</strong>red and tenth LA-SD round trip added<br />
(S5) Eighth LA-SD round trip (fourth <strong>State</strong>-supported train) added 10/26/97.<br />
10/25/87; first <strong>State</strong>-supported round trip between Los Angeles (S12) Eleventh LA-SD roundtrip added 10/25/98.<br />
and Santa Barbara (LA-SB) added 6/26/88. (S13) Twelfth LA-SD round trip on weekends only added on 5/21/01.<br />
(S6) Second <strong>State</strong>-supported LA-SB round trip added 10/28/90. (S14) Fifth LA-SB round trip on weekends only added on 5/25/02.<br />
(S7) Ninth LA-SD round trip (not <strong>State</strong>-supported) added 10/25/92. (S15) Second LA-SLO round trip added on 11/17/04.<br />
(F1) Passenger-miles per train mile (PM/TM), a measure of the average load on a train over its entire route. Actual passenger-mile data<br />
was not provided by Amtrak prior <strong>to</strong> August 1981. PM/TM figures shown for All Trains are calculated by Amtrak and cover the<br />
Amtrak Fiscal Year (Oc<strong>to</strong>ber through September).<br />
(F2) Prior <strong>to</strong> Oc<strong>to</strong>ber 1983, all trains billed on solely related cost basis. From Oc<strong>to</strong>ber 1983 through September 1995, all Los Angeles- San Diego trains<br />
and the first Los Angeles-Santa Barbara train billed on short-term avoidable cost basis. The second and third Los Angeles- Santa Barbara trains<br />
billed on long-term avoidable cost basis. Between Oc<strong>to</strong>ber 1995 and September 1996, all trains billed on long-term avoidable cost basis. Effective<br />
Oc<strong>to</strong>ber 1996, all trains billed on Full Cost (Train, Route and System) Basis. Depreciation and interest (equipment capital cost) included in operating<br />
cost under solely-related basis but excluded and charged separately under short-term, long-term avoidable and full cost bases.<br />
(F3) From Oc<strong>to</strong>ber 1976 through September 1983, <strong>State</strong> cost was 48.5 percent of operating loss (including equipment costs). For the third Los Angeles-<br />
Santa Barbara train, <strong>State</strong> cost was 100 percent of operating loss from February 1994 through September 1994, and 70 percent through<br />
September 1995. For all other trains, effective Oc<strong>to</strong>ber 1983, through September 1995, <strong>State</strong> cost was 65 percent of operating loss plus 50 percent<br />
of depreciation and interest (equipment capital cost). Between Oc<strong>to</strong>ber 1995 and September 1996, <strong>State</strong> cost was 100 percent of operating loss<br />
and 60 percent of equipment capital cost for the <strong>State</strong> supported 64 percent of train service on the route. Between Oc<strong>to</strong>ber 1996 and September<br />
1997, <strong>State</strong> cost was 55 percent of operating loss and 100 percent of equipment capital cost for the 64 percent <strong>State</strong> share. Effective Oc<strong>to</strong>ber<br />
1997, <strong>State</strong> is billed contractually specified percentages of most individual cost elements, plus a fixed amount for certain other cost elements.<br />
The <strong>State</strong> share increased <strong>to</strong> 67 percent in November 1997 and <strong>to</strong> 70 percent in December 2004 of train service on the route <strong>to</strong> reflect additional <strong>State</strong><br />
supported service. Also includes <strong>State</strong> payment of special payments <strong>to</strong> Amtrak for additional service and <strong>State</strong> payment for entire net cost of all<br />
connecting bus routes.<br />
(F4) Beginning in <strong>State</strong> Fiscal Year 1993-94, Amtrak cost is based on billings submitted and reflects cost bases and Amtrak shares as stated in notes<br />
(F2) and (F3) above, however Amtrak does not include the unbilled Amtrak share of fixed cost elements. Prior <strong>to</strong> FY 1993-94, data <strong>to</strong><br />
calculate Amtrak cost is not available. Does not represent the difference between Loss and <strong>State</strong> Cost, as the latter includes bus<br />
expenses and equipment capital costs not included in Amtrak costs.<br />
(F5) Train loss (deficit) per train passenger mile. Separate passenger-mile data for <strong>State</strong>-supported trains was not provided by Amtrak<br />
prior <strong>to</strong> August 1981. Connecting buses not included in loss per passenger mile data.<br />
(F6) Farebox Ratio, the ratio of Revenue <strong>to</strong> Expense.<br />
73
<strong>2005</strong>-<strong>06</strong> – <strong>2015</strong>-<strong>16</strong> <strong>California</strong> <strong>State</strong> <strong>Rail</strong> <strong>Plan</strong><br />
ROUTE DESCRIPTION<br />
The Pacific Surfliner Route now has 11 daily round-trips between San Diego and<br />
Los Angeles, with five round-trips extending north <strong>to</strong> Santa Barbara, and two of<br />
these trips extending further north <strong>to</strong> San Luis Obispo. A twelfth Friday through<br />
Sunday round-trip operates between San Diego and Los Angeles; this train<br />
addresses peak weekend demand for intercity service. The three round-trips that<br />
terminate in Santa Barbara have dedicated Amtrak Thruway bus connections <strong>to</strong><br />
and from San Luis Obispo.<br />
Scheduled running time between Los Angeles and San Diego averages<br />
2 hours-45 minutes. Overall average speed, including station dwell time averages<br />
47 mph. This segment includes more than 70 miles between Santa Ana and<br />
Sorren<strong>to</strong> where the maximum track speed is 90 mph, the only location on the<br />
<strong>State</strong>-supported routes where trains operate above 79 mph. Scheduled<br />
train running time between Los Angeles and Santa Barbara averages<br />
2 hours-45 minutes, with an overall average speed of 37 mph. Scheduled running<br />
time for the two Pacific Surfliner round-trips between Santa Barbara and<br />
San Luis Obispo averages 2 hours-43 minutes, with an overall average speed of<br />
44 mph.<br />
The Route extends 351 rail miles between San Luis Obispo and San Diego<br />
(222 miles north of Los Angeles and 129 miles south of Los Angeles) with<br />
24 intermediate s<strong>to</strong>ps (15 s<strong>to</strong>ps north of Los Angeles and eight south of<br />
Los Angeles). To facilitate the implementation of commuter rail service, regional<br />
and local agencies in Ventura, Los Angeles, Orange and San Diego counties<br />
purchased (from the Southern Pacific and Santa Fe railroads) most segments of the<br />
rail line between Moorpark and San Diego. The UP continues <strong>to</strong> own 175 miles of<br />
line between San Luis Obispo and Moorpark. The BNSF owns 22 miles between<br />
Redondo Junction in Los Angeles and Fuller<strong>to</strong>n. Figure 6C describes the current<br />
ownership, segment mileage, and track and signal characteristics of the Route.<br />
74
Chapter VI – Pacific Surfliner Route<br />
Figure 6C<br />
Between<br />
Mile<br />
Post<br />
PACIFIC SURFLINER ROUTE<br />
OWNERSHIP AND TRACK CHARACTERISTICS<br />
And<br />
Mile<br />
Post Miles Owner of Track<br />
*No. of<br />
Tracks<br />
Max.<br />
Speed<br />
Signal<br />
System<br />
San Luis Obispo 248.5 East San Luis Obispo 251.5 3.0 UP 2 60 DTC<br />
East San Luis Obispo 251.5 West Santa Barbara 365.2 113.7 UP 1 60 DTC<br />
West Santa Barbara 365.2 East Santa Barbara 368.6 3.4 UP 2 40 DTC<br />
East Santa Barbara 368.6 Moorpark 423.1 54.5 UP 1 70 DTC/CTC<br />
Moorpark<br />
423.1=<br />
426.4 Ventura/LA County Line 442.0 15.6 (a)UP/VCTC 1 70 CTC<br />
Ventura/LA County Line 442.0 Raymer (West of Van Nuys) 453.1 11.1 (a)UP/LACMTA 1 70 CTC<br />
Raymer (West of Van Nuys) 453.1 Burbank Jct. 462.6 9.5 (a)UP/LACMTA 2 79 CTC<br />
462.6=<br />
Burbank Jct.<br />
11.4 Glendale (Fletcher Drive) 4.9 6.5 (a)UP/LACMTA 2 79 CTC<br />
Glendale (Fletcher Drive) 4.9 C.P. Day<strong>to</strong>n 2.1 2.8 LACMTA 2 79 CTC<br />
C.P. Day<strong>to</strong>n (b) 2.1 Mission Tower 0.8 1.3 LACMTA 2 50 CTC<br />
Mission Tower 0.8 L.A. Union Station 0.0 1.6 Catellus 3 15 CTC<br />
Mission Tower 0.0 Redondo Jct. 3.2 LACMTA 1 65 CTC<br />
Redondo Jct. 143.2 Fuller<strong>to</strong>n <strong>16</strong>5.0 21.8 BNSF 1 79 CTC<br />
Fuller<strong>to</strong>n <strong>16</strong>5.0 Santa Ana (Aliso) 175.2 10.2 OCTA 2 79 CTC<br />
Santa Ana (Aliso) 175.2 Orange/San Diego Co. Line 207.4 32.2 OCTA 2 90 CTC/ATS<br />
Orange/San Diego Co. Line 207.4 Del Mar/San Diego City Limits 245.6 38.2 NSDCTDB 1 90 CTC/ATS<br />
Del Mar/San Diego City Limits 245.6 Sorren<strong>to</strong> 249.1 3.5 MTDB 1 90 CTC/ATS<br />
Sorren<strong>to</strong> 249.1 San Diego 267.6 18.5 MTDB 1 79 CTC<br />
Total (includes round trip between Union Station and Mission Tower) 350.6<br />
* General number of mainline tracks<br />
(a) On this segment LACMTA (VCTC between Moorpark and the Ventura/LA County Line) purchased a 40 foot wide<br />
portion of UP’s right-of-way. Between Raymer and Burbank Junction, LACMTA constructed and owns<br />
a second main line track.<br />
(b) Via West Side of Los Angeles River (Downey Avenue Bridge)<br />
Owners:<br />
BNSF - The Burling<strong>to</strong>n Northern and Santa Fe <strong>Rail</strong>way Company<br />
Catellus - Catellus Develop. Corp. (a real estate develop co.; owner of L.A. Union Station)<br />
LACMTA - Los Angeles County Metropolitan Transportation Authority<br />
MTDB - Metropolitan Transit Development Board<br />
NSDCTDB - North San Diego County Transit Development Board<br />
OCTA - Orange County Transportation Authority<br />
UP - Union Pacific <strong>Rail</strong>road Company<br />
VCTC - Ventura County Transportation Commission<br />
Signal Systems:<br />
ATS - Au<strong>to</strong>matic Train S<strong>to</strong>p - Allows speeds of 90 miles per hour. System au<strong>to</strong>matically applies train brakes if<br />
a restrictive signal indication is not observed or warning alarm is not acknowledged.<br />
CTC - Centralized Traffic Control - Wayside signals protect possession of blocks. Signals and powered<br />
switches are also remotely controlled from the dispatching center <strong>to</strong> direct the movement of trains.<br />
DTC - Direct Traffic Control - Dispatching center gives authority for train movement by radio <strong>to</strong> train crew directly.<br />
75
<strong>2005</strong>-<strong>06</strong> – <strong>2015</strong>-<strong>16</strong> <strong>California</strong> <strong>State</strong> <strong>Rail</strong> <strong>Plan</strong><br />
CONNECTING AMTRAK BUSES<br />
The Pacific Surfliner Amtrak buses provide an important extension <strong>to</strong> this route.<br />
The Department contracts with Amtrak <strong>to</strong> provide connecting feeder bus services.<br />
Amtrak, in turn, contracts with private bus opera<strong>to</strong>rs. The bus routes function as a<br />
direct part of the Amtrak system with coordinated connections, guaranteed seating,<br />
integrated fares and ticketing procedures, and inclusion in Amtrak’s<br />
central information and reservation system in the same manner as the trains.<br />
On the north end of the route, buses from Los Angeles <strong>to</strong> Santa Barbara and then<br />
<strong>to</strong> San Luis Obispo have served as precursors <strong>to</strong> rail service, and have played an<br />
important route in testing and developing rail ridership. Currently buses from<br />
Santa Barbara and San Luis Obispo <strong>to</strong> San Francisco are providing an important<br />
extension for the service and testing this market.<br />
Following is a listing of the Pacific Surfliner bus routes and their origins/<br />
destinations. Route 1 is a San Joaquin bus route but is included since it feeds<br />
passengers <strong>to</strong> the Pacific Surfliners and function as an important supplement <strong>to</strong><br />
train service on the north end of the Pacific Surfliners. Cities that are<br />
Pacific Surfliner train connection points are in italics.<br />
Route 1–Los Angeles Basin (San Joaquin Route bus)<br />
Los Angeles - Bakersfield<br />
Route 4–South Coast<br />
Los Angeles - Santa Barbara<br />
Route 17–Central Coast<br />
Santa Barbara - San Luis Obispo- San Francisco/Oakland<br />
ROUTE ADMINISTRATION<br />
The <strong>State</strong> and Amtrak share responsibilities for operating the Pacific Surfliners.<br />
Amtrak considers 30 percent of the service, “basic system” service that is part of<br />
national long-distance service, and operating costs on this portion of the Route are<br />
entirely Federally funded. The remaining 70 percent of the Route is<br />
<strong>State</strong>-supported. Amtrak operates all trains, and the Department is responsible for<br />
the oversight of the Pacific Surfliner service through its operating contract with<br />
Amtrak. The Department coordinates functions such as marketing, scheduling,<br />
and on board services with Amtrak. New Pacific Surfliner equipment is used on<br />
the Route. Amtrak owns all of the locomotives and 40 cars, and the <strong>State</strong> owns<br />
ten cars. Amtrak maintains all of the equipment. For a further description of the<br />
financial relationship between Amtrak and the <strong>State</strong>, see Chapter XI.<br />
76
Chapter VI – Pacific Surfliner Route<br />
LOS ANGELES-SAN DIEGO-SAN LUIS OBISPO RAIL CORRIDOR<br />
AGENCY (LOSSAN)<br />
LOSSAN functions as a planning agency and an advisory group for intercity rail<br />
in Southern <strong>California</strong>. In 2001, LOSSAN added the San Luis Obispo Council of<br />
Governments as a voting member of its Board and converted the Ventura County<br />
Transportation Commission, the Santa Barbara County Association of<br />
Governments, and the San Diego Association of Governments from ex-officio<br />
members <strong>to</strong> voting members.<br />
Currently the members of the LOSSAN Technical Advisory Committee (TAC)<br />
include Amtrak, BNSF, the CPUC, the Department’s Division of <strong>Rail</strong>,<br />
Los Angeles County Metropolitan Transportation Authority, San Diego<br />
Metropolitan Transit System, North San Diego County Transit District,<br />
Orange County Transportation Authority, San Diego Association of Governments,<br />
San Luis Obispo Council of Governments, Santa Barbara County Association of<br />
Governments, Southern <strong>California</strong> Association of Governments,<br />
Southern <strong>California</strong> Regional <strong>Rail</strong> Authority (Metrolink), UP, and Ventura County<br />
Transportation Commission.<br />
77
<strong>2005</strong>-<strong>06</strong> – <strong>2015</strong>-<strong>16</strong> <strong>California</strong> <strong>State</strong> <strong>Rail</strong> <strong>Plan</strong><br />
Figure 7A<br />
78
Chapter VII – San Joaquin Route<br />
CHAPTER VII<br />
SAN JOAQUIN ROUTE<br />
BAY AREA/SACRAMENTO-FRESNO-BAKERSFIELD<br />
LOS ANGELES<br />
PRINCIPAL <strong>2005</strong>-<strong>06</strong> <strong>to</strong> <strong>2015</strong>-<strong>16</strong> ROUTE OBJECTIVES<br />
• Improve On-Time Performance <strong>to</strong> 90 % by <strong>2015</strong>-<strong>16</strong>.<br />
• Improve passenger comfort, convenience, and information with<br />
improved services on board and at stations.<br />
• Improve intermodal connectivity:<br />
o Improved coordination with urban transit.<br />
o Improved Amtrak Thruway service.<br />
• Reduce Travel Times:<br />
o Oakland <strong>to</strong> Bakersfield - 5 hours-51 minutes (20 minute reduction).<br />
o Sacramen<strong>to</strong> <strong>to</strong> Bakersfield - 5 hours-5 minutes (14 minute reduction).<br />
• Increase annual ridership 47% from 773,000 <strong>to</strong> 1,133,000.<br />
• Increase annual revenues 70% from $23.9 million <strong>to</strong> $40.7 million.<br />
• Increase revenue/cost (farebox) ratio from 46.8% <strong>to</strong> 49.1%.<br />
• Increase Service Frequency:<br />
o From 4 <strong>to</strong> 5 daily round-trips between Oakland and Bakersfield.<br />
o From 2 <strong>to</strong> 3 daily round-trips between Sacramen<strong>to</strong> and Bakersfield.<br />
• Expand Service:<br />
o Study options <strong>to</strong> extend rail service from S<strong>to</strong>ck<strong>to</strong>n <strong>to</strong> Oakland and from<br />
Bakersfield <strong>to</strong> Los Angeles.<br />
This Chapter presents the ten-year operational and service improvement and train<br />
service expansion plans for the San Joaquin Route. The Chapter also provides<br />
information on route his<strong>to</strong>ry, route performance, route description, and route<br />
administration. Figure 7A is the San Joaquin route map, including the connecting<br />
buses.<br />
79
<strong>2005</strong>-<strong>06</strong> – <strong>2015</strong>-<strong>16</strong> <strong>California</strong> <strong>State</strong> <strong>Rail</strong> <strong>Plan</strong><br />
TEN-YEAR OPERATIONAL AND SERVICE IMPROVEMENT<br />
PLANS<br />
ON-TIME PERFORMANCE<br />
The Department’s goal is <strong>to</strong> increase OTP <strong>to</strong> 90 percent by the end of the <strong>Plan</strong><br />
period. This goal is based on the full implementation of the unconstrained capital<br />
program described in Chapter II. Increased OTP provides improved service<br />
reliability and faster running times.<br />
The OTP over the years on the San Joaquins has fluctuated considerably. It is<br />
difficult <strong>to</strong> maintain because over 90 percent of this 314-mile corridor from<br />
Bakersfield <strong>to</strong> Oakland is single-track. OTP on a single-track railroad is<br />
particularly sensitive <strong>to</strong> increases in traffic and service disruptions (i.e., crossing<br />
accidents, broken rails, and maintenance of way) because there is no other track <strong>to</strong><br />
relieve congestion or accommodate the service disruption.<br />
In FFY 2000-01, OTP was 67 percent, and in FFY 2001-02 OTP rose <strong>to</strong><br />
78 percent. Increased OTP in FFY 2001-02 was the result of extensive<br />
Department financed track projects and related negotiations between Amtrak and<br />
BNSF on performance agreements. However, OTP between FFY 2002-03 and<br />
2004-05 averaged 59 percent. Reduced OTP has been <strong>to</strong> a large extent the result<br />
of increased freight traffic causing track congestion. Also, service delays from<br />
deferred track maintenance and subsequent maintenance work and dispatching<br />
issues have negatively impacted OTP.<br />
The Department has a number of activities aimed <strong>to</strong> increase OTP and reliability.<br />
First, the Department projects a number of track and signal projects that will<br />
improve reliability will be completed in <strong>2005</strong>-<strong>06</strong>. These projects include<br />
14.3 miles of double-track between Fresno and Hanford and installation of CTC<br />
between Port Chicago and Oakley. In the longer term, a 12.5 mile double-track<br />
project between Wasco and Bakersfield, and on the S<strong>to</strong>ck<strong>to</strong>n-Oakland segment of<br />
the Route, almost 18 miles of double-track between Port Chicago and Oakley will<br />
significantly improve OTP. Additionally, other double-track projects are being<br />
developed. The UP has agreed <strong>to</strong> maintain 90 percent OTP for all S<strong>to</strong>ck<strong>to</strong>n-<br />
Sacramen<strong>to</strong> San Joaquin trains and BNSF has agreed <strong>to</strong> 90 percent OTP between<br />
Port Chicago and Bakersfield once two key projects are completed by the end of<br />
20<strong>06</strong>. (See Chapter II, for additional information about the capital projects.)<br />
Additionally, the Department will work with the UP, BNSF, and Amtrak <strong>to</strong><br />
identify and implement measures <strong>to</strong> enhance schedule reliability.<br />
80
Chapter VII – San Joaquin Route<br />
PASSENGER SAFETY, COMFORT, CONVENIENCE, AND<br />
INFORMATION<br />
In the short-term, the Department has a number of projects <strong>to</strong> improve passenger<br />
amenities, including improved: real-time signage at stations and on board, food<br />
service, and electronic passenger information. The Department will continue <strong>to</strong><br />
explore the latest technology <strong>to</strong> improve passenger safety, comfort, convenience,<br />
and information.<br />
INTERMODAL CONNECTIVITY<br />
In 2003-04, the Department initiated a program on the San Joaquins where<br />
conduc<strong>to</strong>rs offer free transfers <strong>to</strong> participating transit services. Within the ten-year<br />
period, the Department plans <strong>to</strong> expand this program <strong>to</strong> all major transit providers<br />
on the Route. Expansion of marketing and passenger information programs will<br />
provide additional information on intermodal connectivity with local transit.<br />
The Department also plans <strong>to</strong> expand and improve Amtrak Thruway bus service<br />
on the Route.<br />
TRAVEL TIMES<br />
Current Bakersfield <strong>to</strong> Oakland travel time averages 6 hours-11 minutes, and<br />
Bakersfield <strong>to</strong> Sacramen<strong>to</strong> averages 5 hours-19 minutes. The travel time goals<br />
below assume that the unconstrained capital program described in Chapter II is<br />
fully implemented. The Department’s goal is <strong>to</strong> reduce travel times as follows:<br />
• Oakland <strong>to</strong> Bakersfield 5 hours-51 minutes (20 minute reduction).<br />
• Sacramen<strong>to</strong> <strong>to</strong> Bakersfield 5 hours-5 minutes (14 minute reduction).<br />
Running time reductions on both route segments will be accomplished through the<br />
completion of capital projects that are discussed above under “On-Time<br />
Performance”.<br />
RIDERSHIP, REVENUE, AND FAREBOX RATIO<br />
The Department’s goals for ridership, revenue and farebox will be achieved<br />
through the capital, operational and service improvements, and service expansions<br />
discussed in this Chapter as well as in Chapters II, III, and IV. They are as<br />
follows:<br />
• Increase annual ridership 47 percent from 773,000 <strong>to</strong> 1,133,000.<br />
• Increase annual revenues 70 percent from $23.9 million <strong>to</strong> $40.7 million.<br />
• Increase revenue/cost (farebox) ratio from 46.8 percent <strong>to</strong> 49.1 percent.<br />
81
<strong>2005</strong>-<strong>06</strong> – <strong>2015</strong>-<strong>16</strong> <strong>California</strong> <strong>State</strong> <strong>Rail</strong> <strong>Plan</strong><br />
TEN-YEAR PLANNED TRAIN SERVICE EXPANSION PLANS<br />
INCREASED SERVICE FREQUENCIES<br />
The Department anticipates there will be eventual demand for eight round-trips on<br />
the San Joaquins between Bakersfield and S<strong>to</strong>ck<strong>to</strong>n.<br />
It is important <strong>to</strong> note that the start-up dates for service are based on projected<br />
service needs. Demonstrated ridership demand, approval from Amtrak and the<br />
relevant railroad(s), availability of capital funding and equipment, completion of<br />
necessary capital projects, and availability of additional operating funding will<br />
affect when each of the service improvements can be implemented.<br />
The Department’s proposed expansion of the San Joaquin Route is as follows:<br />
2010-11 Bakersfield-Sacramen<strong>to</strong>: third daily round-trip from S<strong>to</strong>ck<strong>to</strong>n <strong>to</strong><br />
Sacramen<strong>to</strong> (seventh round-trip on route).<br />
2014-15 Bakersfield-Oakland: fifth daily round-trip from S<strong>to</strong>ck<strong>to</strong>n <strong>to</strong><br />
Oakland (eighth round-trip on route).<br />
STOCKTON TO OAKLAND<br />
Currently, San Joaquin trains make four round-trips a day on the S<strong>to</strong>ck<strong>to</strong>n-<br />
Oakland segment of the line. As the result of population growth in eastern<br />
Contra Costa and northern San Joaquin Counties, and good ridership on the<br />
existing San Joaquins on this segment, the Department is interested in exploring<br />
additional San Joaquin frequencies. The Department in the fall of <strong>2005</strong> released a<br />
Request for Proposal (RFP) for a San Joaquin Corridor Strategic Business <strong>Plan</strong><br />
that includes the study of potential schedules and market analysis for the Oakland-<br />
S<strong>to</strong>ck<strong>to</strong>n segment of the Route. Dependant upon the results of the study,<br />
the Department may consider adding additional trains on this segment.<br />
BAKERSFIELD TO LOS ANGELES<br />
Currently, the San Joaquins operate from Sacramen<strong>to</strong> and Oakland <strong>to</strong> Bakersfield<br />
with extensive dedicated feeder bus connections <strong>to</strong> Los Angeles. About<br />
31 percent of San Joaquin bus riders used the Bakersfield <strong>to</strong> Los Angeles bus in<br />
2004-05. In view of this extensive use of connecting bus services between<br />
Bakersfield and Los Angeles, the Department has for many years been interested<br />
in developing a direct San Joaquin rail extension between these points.<br />
The UP route between Bakersfield and Los Angeles passes through Mojave and<br />
Palmdale. The Bakersfield <strong>to</strong> Mojave section is one of the busiest single-track<br />
freight lines in the western United <strong>State</strong>s; it is also used by BNSF freight trains<br />
operating on trackage rights. Beyond Mojave, UP’s route <strong>to</strong> Los Angeles goes<br />
through Palmdale. South of Palmdale via Santa Clarita <strong>to</strong> Los Angeles,<br />
the Los Angeles County Metropolitan Transportation Authority owns the line.<br />
82
Chapter VII – San Joaquin Route<br />
In 2002, the Department requested that the UP do a <strong>State</strong>-funded rail capacity<br />
study between Bakersfield and Los Angeles <strong>to</strong> examine intercity passenger rail<br />
service on the line. The railroad declined <strong>to</strong> do the study stating that because there<br />
is no excess capacity on this line, the addition of regularly scheduled passenger<br />
service would have a detrimental impact the UP’s ability <strong>to</strong> provide competitive<br />
freight rail service.<br />
However, the Department remains interested in extending San Joaquin rail service<br />
<strong>to</strong> Los Angeles. The San Joaquin Corridor Strategic Business <strong>Plan</strong> RFP<br />
mentioned above includes the study of: (1) extending one round-trip on a<br />
overnight schedule on the UP route <strong>to</strong> Los Angeles; and (2) extension of the Route<br />
south <strong>to</strong> the foot of the Grapevine with new track, extension of certain<br />
Pacific Surfliner trains from Los Angeles north <strong>to</strong> Santa Clarita on existing track,<br />
with both extensions connected by a short bus ride via I-5 over the Grapevine.<br />
The Department decided <strong>to</strong> examine the second option as a potential alternative <strong>to</strong><br />
use of the UP’s line between Bakersfield and Los Angeles.<br />
ROUTE HISTORY AND PERFORMANCE<br />
Two daily trains served the San Joaquin Valley until May 1971 when Amtrak was<br />
formed. Each train used a different route through the Valley, and was operated by<br />
different railroads. SP operated the San Joaquin Daylight between Oakland and<br />
Los Angeles and a connecting train, the Sacramen<strong>to</strong> Daylight, from Sacramen<strong>to</strong><br />
that provided cross-platform connecting service with the San Joaquin Daylight at<br />
Tracy. The ATSF operated the San Francisco Chief between the Bay Area and<br />
Chicago via S<strong>to</strong>ck<strong>to</strong>n, Fresno and Bakersfield.<br />
Amtrak’s initial route structure in May 1971 used the SP’s Coast Line for service<br />
between Northern and Southern <strong>California</strong>, leaving the San Joaquin Valley<br />
without rail passenger service. Public pressure for res<strong>to</strong>ration of rail service began<br />
almost immediately after the formation of Amtrak. As a result, Amtrak’s<br />
appropriation for FFY 1974 included funding for service in the San Joaquin<br />
Valley. Amtrak selected a joint SP-ATSF route using a connection between the<br />
two railroads at Port Chicago (near Martinez). In March 1974, the new<br />
San Joaquins entered service between Oakland and Bakersfield and were entirely<br />
funded by Amtrak.<br />
In 1979, a major reduction in Amtrak’s nationwide route structure was proposed,<br />
including the termination of the San Joaquin Route. However, the <strong>State</strong> reached<br />
an agreement with Amtrak <strong>to</strong> continue the train with <strong>State</strong> support under the<br />
provisions of Section 403(b) of the Amtrak Act. Thus, <strong>State</strong> support of the route<br />
started in February 1980 when the second Oakland-Bakersfield round trip was<br />
added.<br />
83
<strong>2005</strong>-<strong>06</strong> – <strong>2015</strong>-<strong>16</strong> <strong>California</strong> <strong>State</strong> <strong>Rail</strong> <strong>Plan</strong><br />
Service on the San Joaquins has increased from the original single round-trip <strong>to</strong><br />
the current six daily round-trips as follows:<br />
2/3/80 Oakland-Bakersfield: second round-trip added.<br />
12/17/89 Oakland-Bakersfield: third round-trip added.<br />
10/25/92 Oakland-Bakersfield: fourth round-trip added.<br />
2/21/99 Sacramen<strong>to</strong>-Bakersfield: first train <strong>to</strong> extend from S<strong>to</strong>ck<strong>to</strong>n <strong>to</strong><br />
Sacramen<strong>to</strong> added (fifth round-trip on route).<br />
3/18/02 Sacramen<strong>to</strong>-Bakersfield: second round-trip added (sixth round-trip<br />
on route).<br />
HISTORICAL PERFORMANCE<br />
Figure 7B shows ridership and financial performance data on an annual (<strong>State</strong> FY)<br />
basis from the start of <strong>State</strong>-supported service in 1979-80 through 2004-05.<br />
Ridership and revenues have increased at a fairly steady rate over that period, as<br />
have expense, loss, and <strong>State</strong> cost. Farebox ratio was at a high in 1988-89, and has<br />
since dropped. This is largely because Amtrak has been steadily increasing the<br />
amount and type of costs that are included in the farebox ratio.<br />
(See Chapter XI for more information on this subject.)<br />
The introduction of the sixth train in 2000-01 brought a temporary decrease in the<br />
farebox ratio as costs of the new train were initially higher than the ridership and<br />
revenue increase generated by the new train. However, farebox is now at its<br />
highest since 1995-96. Ridership reached a route peak in 2002-03. It has been<br />
down slightly the past two years, partly the result of decreased OTP caused by<br />
increased freight traffic, and partly the result of deferred maintenance track<br />
projects and winter s<strong>to</strong>rms negatively impacting service.<br />
84
Chapter VII – San Joaquin Route<br />
Figure 7B<br />
SAN JOAQUIN Route<br />
Annual Operating Performance - <strong>State</strong> Fiscal Years<br />
<strong>State</strong> Ridership Data Financial Data for Operations<br />
Fiscal Train Loss Farebox<br />
Year Ridership PM/TM Revenue Expense Loss <strong>State</strong> Cost Amtrak Cost per PM Ratio<br />
Notes (F1) (F2) (F3) (F4) (F5) (F6)<br />
1973-74 (S1) 38,770 83.6<br />
1974-75 66,990 44.2<br />
1975-76 66,530 43.8<br />
1976-77 87,642 56.0<br />
1977-78 80,611 52.7<br />
1978-79 87,645 60.2<br />
1979-80 (S2) 123,275 63.6 $ 1,174,<strong>06</strong>5 $ 3,975,185 $ 2,801,120 $ 518,2<strong>06</strong><br />
18.4¢ 29.5%<br />
1980-81 159,498 55.3 $ 2,224,137 $ 6,940,934 $ 4,7<strong>16</strong>,797 $ 1,360,391<br />
18.4¢ 32.0%<br />
1981-82 189,479 65.3 $ 3,115,710 $ 7,774,029 $ 4,658,319 $ 2,228,585<br />
14.0¢ 40.1%<br />
1982-83 186,121 62.9 $ 3,342,137 $ 7,991,697 $ 4,649,560 $ 2,490,275<br />
14.6¢ 41.8%<br />
1983-84 248,275 85.3 $ 4,730,431 $ 8,094,789 $ 3,364,358 $ 2,518,<strong>06</strong>6<br />
7.3¢ 58.4%<br />
1984-85 269,837 94.6 $ 5,210,951 $ 8,641,293 $ 3,430,342 $ 2,802,955<br />
7.7¢ 60.3%<br />
1985-86 280,798 101.1 $ 5,425,329 $ 8,610,554 $ 3,185,225 $ 2,658,895<br />
6.8¢ 63.0%<br />
1986-87 304,668 1<strong>06</strong>.1 $ 6,084,677 $ 9,179,133 $ 3,094,456 $ 2,929,148<br />
5.1¢ 66.3%<br />
1987-88 340,573 121.1 $ 7,457,686 $ 9,633,659 $ 2,175,973 $ 2,605,572<br />
2.2¢ 77.4%<br />
1988-89 370,190 133.7 $ 9,527,268 $ 10,968,2<strong>16</strong> $ 1,440,948 $ 1,887,450<br />
1.3¢ 86.9%<br />
1989-90 (S3) 418,768 1<strong>16</strong>.9 $ 11,845,743 $ 15,286,520 $ 3,440,777 $ 3,544,332<br />
3.2¢ 77.5%<br />
1990-91 463,9<strong>06</strong> 104.1 $ 12,691,986 $ 18,456,785 $ 5,764,799 $ 5,803,565<br />
4.9¢ 68.8%<br />
1991-92 483,593 104.3 $ 12,369,805 $ 18,633,777 $ 6,263,972 $ 6,472,598<br />
4.3¢ 66.4%<br />
1992-93 (S4) 5<strong>16</strong>,113 109.6 $ 12,628,496 $ 22,227,149 $ 9,598,653 $ 10,789,651<br />
6.5¢ 56.8%<br />
1993-94 558,569 94.6 $ 13,894,624 $ 26,678,861 $ 12,784,237 $ 12,335,021 $ 3,937,150 8.3¢ 52.1%<br />
1994-95 524,680 88.8 $ 12,244,668 $ 25,077,153 $ 12,832,485 $ 12,668,018 $ 3,705,<strong>06</strong>9 9.7¢ 48.8%<br />
1995-96 526,088 86.6 $ 12,477,497 $ 25,386,099 $ 12,908,602 $ 14,483,048 $ 1,360,327 11.8¢ 49.2%<br />
1996-97 652,544 1<strong>06</strong>.1 $ 13,817,681 $ 34,528,<strong>16</strong>5 $ 20,710,484 $ <strong>16</strong>,265,387 $ 5,672,236 18.6¢ 40.0%<br />
1997-98 702,178 118.0 $ 15,230,966 $ 36,517,290 $ 21,286,324 $ 17,190,515 $ 4,493,597 17.7¢ 41.7%<br />
1998-99 (S5) 680,687 102.8 $ <strong>16</strong>,496,457 $ 37,269,835 $ 20,773,378 $ 19,938,254 $ 1,712,<strong>16</strong>8 17.6¢ 44.3%<br />
1999-00 671,295 92.7 $ 18,<strong>06</strong>1,512 $ 41,791,782 $ 23,730,270 $ 24,232,326 $ 652,236 19.0¢ 43.2%<br />
2000-01 710,833 97.9 $ 19,667,681 $ 43,404,325 $ 23,736,644 $ 24,350,127 $ 540,809 18.2¢ 45.3%<br />
2001-02 (S6) 733,152 96.9 $ 20,114,693 $ 46,503,548 $ 26,388,855 $ 26,281,035 $ 396,392 20.0¢ 43.3%<br />
2002-03 769,708 89.9 $ 20,318,564 $ 50,552,529 $ 30,233,965 $ 29,729,650 $ 504,315 21.7¢ 40.2%<br />
2003-04 752,227 87.2 $ 22,100,796 $ 50,<strong>06</strong>1,460 $ 27,960,664 $ 27,960,664 $ 89,345 20.5¢ 44.1%<br />
2004-05 743,245 85.1 $ 22,590,880 $ 49,883,689 $ 27,292,809 $ 27,292,809<br />
19.6¢ 45.3%<br />
TOTAL 12,808,488 $ 304,844,440 $ 624,<strong>06</strong>8,456 $ 319,224,0<strong>16</strong> $ 301,336,543<br />
(S1) Service started 3/6/74 with one round-trip between Oakland and Bakersfield. Data is for four months only.<br />
(S2) <strong>State</strong> support started 10/1/79. Data is for nine months, during which time ridership <strong>to</strong>taled 93,2<strong>06</strong>.<br />
Second round trip added 2/3/80 between Oakland and Bakersfield.<br />
(S3) Third round trip added 12/17/89 between Oakland and Bakersfield.<br />
(S4) Fourth round trip added 10/25/92 between Oakland and Bakersfield.<br />
(S5) Fifth round-trip added 2/21/99 between Sacramen<strong>to</strong> and Bakersfield.<br />
(S6) Sixth round-trip added 3/18/02 between Sacramen<strong>to</strong> and Bakersfield.<br />
(F1)<br />
(F2)<br />
(F3)<br />
(F4)<br />
(F5)<br />
(F6)<br />
Passenger-miles per train mile (PM/TM), a measure of the average load on a train over its entire route.<br />
Prior <strong>to</strong> Oc<strong>to</strong>ber 1983, all trains billed on solely related cost basis. From Oc<strong>to</strong>ber 1983 through September 1995, all trains billed on<br />
short term avoidable cost basis, except fourth round trip billed at long term avoidable cost basis. Effective Oc<strong>to</strong>ber 1995, all trains<br />
billed on long term avoidable cost basis. Effective Oc<strong>to</strong>ber 1996, all trains billed on Full Cost (Train, Route and System) Basis.<br />
Includes cost of connecting buses. Depreciation and interest (equipment capital cost) included in operating cost under<br />
solely-related cost basis but excluded and charged separately under short-term, long-term avoidable and full cost bases.<br />
From Oc<strong>to</strong>ber 1979 through September 1983, <strong>State</strong> cost increased in stages from 18.5 <strong>to</strong> 48.5 percent of operating loss (including<br />
equipment costs). Between Oc<strong>to</strong>ber 1983 and September 1995, <strong>State</strong> cost was 65 percent of train operating loss for first three<br />
round trips, plus 50 percent of depreciation and interest (equipment capital cost). For the fourth round trip, <strong>State</strong> cost was<br />
70 percent of train operating loss plus equipment capital cost. Between Oc<strong>to</strong>ber 1995 and September 1996, <strong>State</strong> cost was<br />
100 percent of train operating loss and 60 percent of equipment capital cost. Between Oc<strong>to</strong>ber 1996 and September 1997, <strong>State</strong> cost<br />
was 65 percent of train operating loss. Effective Oc<strong>to</strong>ber 1997, <strong>State</strong> is billed contractually specified percentages of most individual<br />
cost elements, plus a fixed amount for certain other cost elements. Also includes <strong>State</strong> payment of costs of special agreements with<br />
Amtrak for use of equipment, and <strong>State</strong> payment of entire net cost of all connecting bus routes.<br />
Beginning in <strong>State</strong> Fiscal Year 1993-94, Amtrak cost is based on billings submitted and reflects cost bases and Amtrak shares as<br />
stated in notes (F2) and (F3) above. However, Amtrak does not include the unbilled Amtrak share of fixed cost elements.<br />
Prior <strong>to</strong> FY 1993-94, data <strong>to</strong> calculate Amtrak cost is not available. Does not represent the difference between Loss and<br />
<strong>State</strong> Cost, as the latter includes bus expenses and equipment capital costs not included in Amtrak costs.<br />
Train loss (deficit) per train passenger-mile. Connecting buses not included in loss per passenger mile data.<br />
Farebox Ratio, the ratio of Revenue <strong>to</strong> Expense.<br />
85
<strong>2005</strong>-<strong>06</strong> – <strong>2015</strong>-<strong>16</strong> <strong>California</strong> <strong>State</strong> <strong>Rail</strong> <strong>Plan</strong><br />
ROUTE DESCRIPTION<br />
There are currently six daily round trip trains on the San Joaquin Route, four<br />
between Oakland and Bakersfield and two between Sacramen<strong>to</strong> and Bakersfield,<br />
with all trains running between S<strong>to</strong>ck<strong>to</strong>n and Bakersfield. In order <strong>to</strong> provide the<br />
six-frequency service between all points on the route, for trains serving Oakland,<br />
connecting buses are provided between S<strong>to</strong>ck<strong>to</strong>n and Sacramen<strong>to</strong>; for trains<br />
serving Sacramen<strong>to</strong>, connecting buses are provided between S<strong>to</strong>ck<strong>to</strong>n, Oakland<br />
and San Francisco.<br />
Scheduled train-running time between Bakersfield and Oakland averages<br />
6 hours-13 minutes. Overall average speed, including station dwell time,<br />
is 50 mph. Scheduled train running time between Sacramen<strong>to</strong> and Bakersfield<br />
averages 5 hours-19 minutes, and overall average speed is 53 mph. The maximum<br />
track speed on the San Joaquin Route is 79 miles per hour.<br />
The San Joaquin Route comprises 363 route miles, extending 314 miles between<br />
Oakland and Bakersfield with 13 intermediate s<strong>to</strong>ps, and 49 miles between<br />
Sacramen<strong>to</strong> and S<strong>to</strong>ck<strong>to</strong>n with one additional intermediate s<strong>to</strong>p. Amtrak operates<br />
the San Joaquins under provisions of its contracts with the BNSF and UP.<br />
Predominant ROW ownership is by the BNSF (Port Chicago-Bakersfield).<br />
The UP owns 39 miles at the north end of the route between Oakland and<br />
Port Chicago and 49 miles in the segment between S<strong>to</strong>ck<strong>to</strong>n and Sacramen<strong>to</strong>.<br />
Figure 7C describes the current ownership, segment mileage, and track and signal<br />
characteristics of the San Joaquin Route.<br />
86
Chapter VII – San Joaquin Route<br />
Figure 7C<br />
Between<br />
Mile<br />
Post<br />
PACIFIC SURFLINER ROUTE<br />
OWNERSHIP AND TRACK CHARACTERISTICS<br />
And<br />
Mile<br />
Post Miles Owner of Track<br />
*No. of<br />
Tracks<br />
Max.<br />
Speed<br />
Signal<br />
System<br />
San Luis Obispo 248.5 East San Luis Obispo 251.5 3.0 UP 2 60 DTC<br />
East San Luis Obispo 251.5 West Santa Barbara 365.2 113.7 UP 1 60 DTC<br />
West Santa Barbara 365.2 East Santa Barbara 368.6 3.4 UP 2 40 DTC<br />
East Santa Barbara 368.6 Moorpark 423.1 54.5 UP 1 70 DTC/CTC<br />
Moorpark<br />
423.1=<br />
426.4 Ventura/LA County Line 442.0 15.6 (a)UP/VCTC 1 70 CTC<br />
Ventura/LA County Line 442.0 Raymer (West of Van Nuys) 453.1 11.1 (a)UP/LACMTA 1 70 CTC<br />
Raymer (West of Van Nuys) 453.1 Burbank Jct. 462.6 9.5 (a)UP/LACMTA 2 79 CTC<br />
462.6=<br />
Burbank Jct.<br />
11.4 Glendale (Fletcher Drive) 4.9 6.5 (a)UP/LACMTA 2 79 CTC<br />
Glendale (Fletcher Drive) 4.9 C.P. Day<strong>to</strong>n 2.1 2.8 LACMTA 2 79 CTC<br />
C.P. Day<strong>to</strong>n (b) 2.1 Mission Tower 0.8 1.3 LACMTA 2 50 CTC<br />
Mission Tower 0.8 L.A. Union Station 0.0 1.6 Catellus 3 15 CTC<br />
Mission Tower 0.0 Redondo Jct. 3.2 LACMTA 1 65 CTC<br />
Redondo Jct. 143.2 Fuller<strong>to</strong>n <strong>16</strong>5.0 21.8 BNSF 1 79 CTC<br />
Fuller<strong>to</strong>n <strong>16</strong>5.0 Santa Ana (Aliso) 175.2 10.2 OCTA 2 79 CTC<br />
Santa Ana (Aliso) 175.2 Orange/San Diego Co. Line 207.4 32.2 OCTA 2 90 CTC/ATS<br />
Orange/San Diego Co. Line 207.4 Del Mar/San Diego City Limits 245.6 38.2 NSDCTDB 1 90 CTC/ATS<br />
Del Mar/San Diego City Limits 245.6 Sorren<strong>to</strong> 249.1 3.5 MTDB 1 90 CTC/ATS<br />
Sorren<strong>to</strong> 249.1 San Diego 267.6 18.5 MTDB 1 79 CTC<br />
Total (includes round trip between Union Station and Mission Tower) 350.6<br />
* General number of mainline tracks<br />
(a) On this segment LACMTA (VCTC between Moorpark and the Ventura/LA County Line) purchased a 40 foot wide<br />
portion of UP’s right-of-way. Between Raymer and Burbank Junction, LACMTA constructed and owns<br />
a second main line track.<br />
(b) Via West Side of Los Angeles River (Downey Avenue Bridge)<br />
Owners:<br />
BNSF - The Burling<strong>to</strong>n Northern and Santa Fe <strong>Rail</strong>way Company<br />
Catellus - Catellus Develop. Corp. (a real estate develop co.; owner of L.A. Union Station)<br />
LACMTA - Los Angeles County Metropolitan Transportation Authority<br />
MTDB - Metropolitan Transit Development Board<br />
NSDCTDB - North San Diego County Transit Development Board<br />
OCTA - Orange County Transportation Authority<br />
UP - Union Pacific <strong>Rail</strong>road Company<br />
VCTC - Ventura County Transportation Commission<br />
Signal Systems:<br />
ATS - Au<strong>to</strong>matic Train S<strong>to</strong>p - Allows speeds of 90 miles per hour. System au<strong>to</strong>matically applies train brakes if<br />
a restrictive signal indication is not observed or warning alarm is not acknowledged.<br />
CTC - Centralized Traffic Control - Wayside signals protect possession of blocks. Signals and powered<br />
switches are also remotely controlled from the dispatching center <strong>to</strong> direct the movement of trains.<br />
DTC - Direct Traffic Control - Dispatching center gives authority for train movement by radio <strong>to</strong> train crew directly.<br />
CONNECTING AMTRAK BUSES<br />
The extensive network of Amtrak dedicated feeder buses connecting with the<br />
San Joaquins is essential <strong>to</strong> the route as at least 60 percent of all San Joaquin<br />
riders (in 2004-05) used one or more buses for a portion of their trip. Ridership<br />
analysis shows that feeder bus riders make longer than average trips, and therefore<br />
produce higher revenues per trip.<br />
The Department contracts with Amtrak for the provision of dedicated feeder bus<br />
services, and Amtrak then contracts with bus opera<strong>to</strong>rs. The bus routes function<br />
as direct parts of the Amtrak system, with coordinated connections, guaranteed<br />
87
<strong>2005</strong>-<strong>06</strong> – <strong>2015</strong>-<strong>16</strong> <strong>California</strong> <strong>State</strong> <strong>Rail</strong> <strong>Plan</strong><br />
seating, integrated fares and ticketing procedures, and inclusion in Amtrak’s<br />
central information and reservation system in the same manner as the trains.<br />
Following is a listing of the San Joaquin bus routes and their origins/destinations,<br />
as well as the Capi<strong>to</strong>l Corridor bus routes that also connect <strong>to</strong> the San Joaquins.<br />
Cities that are San Joaquin train connection points are in italics.<br />
San Joaquin Bus Routes<br />
Route 1 Network–Los Angeles Basin<br />
1A–Bakersfield-Los Angeles/San Diego<br />
1B–Bakersfield-Los Angeles-Long Beach/San Pedro<br />
1C–Bakersfield-Van Nuys/Simi Valley<br />
Route 3–Sacramen<strong>to</strong> Valley<br />
S<strong>to</strong>ck<strong>to</strong>n-Sacramen<strong>to</strong>-Redding<br />
Route 6–South Bay<br />
S<strong>to</strong>ck<strong>to</strong>n-San Jose<br />
Route 7–North Bay/Redwood Empire<br />
Martinez-Eureka/McKinleyville<br />
Route 9–High Desert-Las Vegas<br />
Bakersfield-Las Vegas<br />
Route 10–Valley-South Coast<br />
Bakersfield-Santa Barbara<br />
Route 12–Antelope Valley<br />
Bakersfield-Vic<strong>to</strong>rville<br />
Route 15–Yosemite<br />
Merced-Yosemite National Park<br />
Route 18–Valley-Central Coast<br />
18A–Hanford-San Luis Obispo/Santa Maria<br />
18B–Hanford-Visalia<br />
Route 19–Inland Empire-Coachella Valley<br />
Bakersfield-San Bernardino/Riverside/Indio<br />
Route 34–Bay Area-S<strong>to</strong>ck<strong>to</strong>n<br />
S<strong>to</strong>ck<strong>to</strong>n-Oakland-San Francisco<br />
Route 37–Monterey<br />
Merced-Salinas/Monterey<br />
88
Chapter VII – San Joaquin Route<br />
Capi<strong>to</strong>l Corridor Bus Routes<br />
Route 20–Sierra Foothills/High Sierra<br />
Sacramen<strong>to</strong>-Reno/Sparks<br />
Route 23–Lake Tahoe<br />
Sacramen<strong>to</strong>-<strong>State</strong>line/Carson City<br />
Amtrak Bus Route<br />
Route 99–Trans Bay<br />
Emeryville-San Francisco<br />
ROUTE ADMINISTRATION<br />
The <strong>State</strong> and Amtrak share responsibilities for operating the San Joaquins.<br />
Amtrak operates the trains, and the Department is responsible for the oversight of<br />
the San Joaquin service through its operating contract with Amtrak.<br />
The Department coordinates functions such as marketing, scheduling, and on<br />
board services with Amtrak. The <strong>State</strong> owns all San Joaquin equipment, while<br />
Amtrak maintains it. For a further description of the financial relationship<br />
between Amtrak and the <strong>State</strong>, see Chapter XI.<br />
SAN JOAQUIN VALLEY RAIL COMMITTEE<br />
The San Joaquin Valley <strong>Rail</strong> Committee consists of representatives from each<br />
county served by the San Joaquin trains and other key counties served by feeder<br />
buses. Agency associate members represent Amtrak, CPUC, UP, BNSF,<br />
Metropolitan Transportation Commission, Southern <strong>California</strong> Association of<br />
Governments, and the Department. The committee is informed of all significant<br />
matters affecting the San Joaquins. It provides valuable input <strong>to</strong> the Department<br />
on all aspects of the service. Section 14074.8 of the Government Code provides<br />
that the committee may confer with the Secretary of the Business, Transportation<br />
and Housing Agency (BTH) <strong>to</strong> coordinate intercity passenger rail service for the<br />
San Joaquin Corridor.<br />
89
<strong>2005</strong>-<strong>06</strong> – <strong>2015</strong>-<strong>16</strong> <strong>California</strong> <strong>State</strong> <strong>Rail</strong> <strong>Plan</strong><br />
Figure 8A<br />
90
Chapter VIII – The Capi<strong>to</strong>l Corridor<br />
CHAPTER VIII<br />
THE CAPITOL CORRIDOR<br />
AUBURN-SACRAMENTO-OAKLAND-SAN JOSE<br />
PRINCIPAL <strong>2005</strong>-<strong>06</strong> <strong>to</strong> <strong>2015</strong>-<strong>16</strong> ROUTE OBJECTIVES<br />
• Maintain On-Time Performance at 90% throughout the ten-year period.<br />
• Enhance cus<strong>to</strong>mer satisfaction.<br />
• Improve intermodal connectivity:<br />
o Establish transfer agreements and coordinated schedules with all local<br />
transit systems.<br />
o Participate in the Bay Area’s TransLink program.<br />
• Reduce Travel Times by up <strong>to</strong> 12%.<br />
• Increase annual ridership 88% from 1,323,000 <strong>to</strong> 2,483,000.<br />
• Increase annual revenues 86% from $<strong>16</strong>.0 million <strong>to</strong> $29.8 million.<br />
• Increase revenue/cost (farebox) ratio from 38.9 % <strong>to</strong> 44.6%.<br />
• Increase Service Frequency:<br />
o From 12 <strong>to</strong> 18 daily round-trips between Oakland and Sacramen<strong>to</strong>.<br />
o From 4 <strong>to</strong> <strong>16</strong> daily round-trips between San Jose and Oakland.<br />
o From 1 <strong>to</strong> 8 daily round-trips between Sacramen<strong>to</strong> and Roseville.<br />
o From 1 <strong>to</strong> 4 daily round-trips between Roseville and Auburn.<br />
• Expand Service:<br />
o Sacramen<strong>to</strong>-Reno – first daily round-trip in 2008-09, second daily<br />
round-trip in 2010-11.<br />
o Support Auburn-Oakland Regional <strong>Rail</strong> Service commuter system<br />
planning.<br />
o Coordinate with Caltrain on the Dumbar<strong>to</strong>n <strong>Rail</strong> Corridor commuter rail<br />
expansion.<br />
This Chapter presents the ten-year operational and service improvement and train<br />
service expansion plans for the Capi<strong>to</strong>l Corridor Route. The Chapter also<br />
provides information on administration, route his<strong>to</strong>ry, route performance, and<br />
route description. Figure 8A is the Capi<strong>to</strong>l Corridor route map, including the<br />
connecting buses.<br />
91
<strong>2005</strong>-<strong>06</strong> – <strong>2015</strong>-<strong>16</strong> <strong>California</strong> <strong>State</strong> <strong>Rail</strong> <strong>Plan</strong><br />
ROUTE ADMINISTRATION<br />
The administrative structure of the Capi<strong>to</strong>l Corridor Route differs from the<br />
Pacific Surfliner and San Joaquin Routes. The CCJPA has responsibility for<br />
management of the Route, while the <strong>State</strong> continues <strong>to</strong> fund the service operation<br />
and many capital projects. Amtrak operates the trains, the CCJPA is responsible<br />
for the oversight of the Capi<strong>to</strong>l Corridor service through its operating contract<br />
with Amtrak, and the <strong>State</strong> funds the service. The CCJPA coordinates functions<br />
such as marketing, scheduling, and on board services with Amtrak, and also<br />
coordinates some functions with the Department, such as marketing. The <strong>State</strong><br />
owns all Capi<strong>to</strong>l Corridor equipment, while Amtrak maintains it and the CCJPA<br />
oversees Amtrak’s maintenance work. For a description of the financial<br />
relationship between Amtrak and the <strong>State</strong>, see Chapter XI.<br />
Local agencies have always had an active role in planning and promoting the<br />
Capi<strong>to</strong>l Corridor. Initially the Assembly Concurrent Resolution (ACR) Policy<br />
Advisory Committee, formed as part of the ACR 132 study, acted in an advisory<br />
capacity <strong>to</strong> make recommendations about the route. Chapter 263, Statutes of 1996<br />
(SB 457 - Kelly), allowed the <strong>State</strong> <strong>to</strong> enter in<strong>to</strong> an interagency transfer agreement<br />
(ITA) with a joint powers authority <strong>to</strong> assume responsibility for intercity rail<br />
services on the Capi<strong>to</strong>l Corridor. The Department and the CCJPA executed an<br />
ITA on July 1, 1998, transferring the responsibilities of management for the<br />
Capi<strong>to</strong>l Corridor <strong>to</strong> the CCJPA. The BART General Manager and designated<br />
BART staff provide administrative support <strong>to</strong> the CCJPA.<br />
Pursuant <strong>to</strong> the ITA, BTH has responsibility for allocating operating funds <strong>to</strong> the<br />
CCJPA. BTH also reviews and approves the CCJPA’s business plan that includes<br />
future service levels and funding needs. Chapter 263 specified the composition of<br />
the CCJPA. The CCJPA Board must have the following <strong>16</strong> members:<br />
six representatives from the BART Board of Direc<strong>to</strong>rs (two residents each from<br />
Alameda County, Contra Costa County, and the City and County of<br />
San Francisco); and two members each from the Board of Direc<strong>to</strong>rs of the<br />
Sacramen<strong>to</strong> Regional Transit District, the Board of Direc<strong>to</strong>rs of VTA,<br />
the Yolo County Transportation District, the Solano Transportation Authority, and<br />
the Placer County Transportation <strong>Plan</strong>ning Agency.<br />
TEN-YEAR OPERATIONAL AND SERVICE IMPROVEMENT<br />
PLANS<br />
ON-TIME PERFORMANCE<br />
The CCJPA’s goal is <strong>to</strong> maintain OTP at a minimum of 90 percent throughout the<br />
<strong>Plan</strong> period. This goal is based on the full implementation of the unconstrained<br />
capital program described in Chapter II. Increased OTP provides improved<br />
service reliability and faster running times. The OTP in 2003-04 and 2004-05<br />
improved considerably <strong>to</strong> about 86 percent, as compared <strong>to</strong> OTP in 2002-03 of<br />
92
Chapter VIII – The Capi<strong>to</strong>l Corridor<br />
79 percent. The improved OTP is primarily the result of management and<br />
organizational changes at the UP. In December 2003, Amtrak, CCJPA and UP<br />
revised the incentive payments for OTP of Capi<strong>to</strong>l Corridor trains. They are now<br />
calculated separately from UP’s incentive payments for other Amtrak trains <strong>to</strong><br />
give the UP more incentive <strong>to</strong> increase OTP on this route. OTP over 92 percent<br />
receives increased incentive payments.<br />
Capital projects on the Route have had a large impact in improving OTP.<br />
In February 2004 the Yolo Causeway double-track project was completed which<br />
was the last remaining single track segment between Oakland and Sacramen<strong>to</strong>.<br />
This project increased reliability and reduced travel times by ten minutes.<br />
ENHANCE CUSTOMER SATISFACTION<br />
The CCJPA’s June <strong>2005</strong> Vision <strong>Plan</strong> contains a number of goals for improving<br />
cus<strong>to</strong>mer satisfaction, including in the near-term: expand passenger on board<br />
surveys and comment cards; implement new technologies <strong>to</strong> improve cus<strong>to</strong>mer<br />
experience such as implement wireless internet access service and outdoor ticket<br />
vending machines at all unstaffed stations; improve food quality and variety; and<br />
provide printed multi-lingual information. In the longer term, the CCJPA plans <strong>to</strong><br />
implement a business/cus<strong>to</strong>m class service with one upgraded car per train with<br />
additional amenities.<br />
INTERMODAL CONNECTIVITY<br />
Intermodal connectivity is one of the CCJPA’s Core Service Objectives in their<br />
<strong>2005</strong> Vision <strong>Plan</strong>. The Route has stations that connect <strong>to</strong> BART, Caltrain, ACE,<br />
VTA, and Sacramen<strong>to</strong> Regional Transit Light <strong>Rail</strong> (projected for fall 20<strong>06</strong>).<br />
The CCJPA plans <strong>to</strong> expand their Transit Transfer Program where free transfers <strong>to</strong><br />
local transit are offered <strong>to</strong> passengers, <strong>to</strong> additional transit providers. The CCJPA<br />
is also looking for opportunities <strong>to</strong> coordinate with local transit providers <strong>to</strong> offer<br />
connecting bus service <strong>to</strong> the Capi<strong>to</strong>l Corridor.<br />
TRAVEL TIMES<br />
Current Oakland <strong>to</strong> Sacramen<strong>to</strong> travel times average 1 hour-50 minutes (for trains<br />
starting or ending in Oakland), Oakland <strong>to</strong> San Jose averages 1 hour-13 minutes,<br />
and Sacramen<strong>to</strong> <strong>to</strong> Auburn averages one hour and four minutes. The CCJPA’s<br />
goal is <strong>to</strong> reduce average travel time by 12 percent. This goal assumes that the<br />
unconstrained capital program described in Chapter II is fully implemented.<br />
A number of planned capital projects will provide running time reductions.<br />
The planned new trackage and signal improvement projects currently under<br />
construction between Oakland and San Jose will improve running-times by<br />
facilitating both passenger and freight train movements and by providing more<br />
opportunities for trains <strong>to</strong> pass each other. Also a third main track near the<br />
Oakland station will reduce passenger and freight conflicts and improve running<br />
times. Additionally, while construction is occurring between Oakland and<br />
93
<strong>2005</strong>-<strong>06</strong> – <strong>2015</strong>-<strong>16</strong> <strong>California</strong> <strong>State</strong> <strong>Rail</strong> <strong>Plan</strong><br />
San Jose, time has been added <strong>to</strong> the schedule that will be taken out at the<br />
completion of construction. (See Chapter II for additional information about<br />
capital projects.)<br />
RIDERSHIP, REVENUE, AND FAREBOX RATIO<br />
The CCJPA’s goals for ridership, revenue, and farebox will be achieved through<br />
the capital, operational and service improvements, and service expansions<br />
discussed in this Chapter as well as in Chapters II, III, and IV.<br />
• Increase annual ridership 88 percent from 1,323,000 <strong>to</strong> 2,483,000.<br />
• Increase annual revenues 86 percent from $<strong>16</strong>.0 million <strong>to</strong> $29.8 million.<br />
• Increase revenue/cost (farebox) ratio from 38.9 percent <strong>to</strong> 44.6 percent.<br />
TEN-YEAR PLANNED TRAIN SERVICE EXPANSION PLANS<br />
INCREASED SERVICE FREQUENCIES<br />
The Department, in conjunction with the CCJPA, anticipates there will be eventual<br />
demand for eighteen round-trips on the Capi<strong>to</strong>l Corridor between Sacramen<strong>to</strong> and<br />
Oakland.<br />
It is important <strong>to</strong> note that the start-up dates for service are based on projected<br />
service needs. Demonstrated ridership demand, approval from Amtrak and the<br />
relevant railroad(s), availability of capital funding and equipment, completion of<br />
necessary capital projects, and availability of additional operating funding will<br />
affect when each of the service improvements can be implemented.<br />
The Department and the CCJPA’s proposed expansion of the Capi<strong>to</strong>l Corridor is<br />
as follows:<br />
20<strong>06</strong>-07 San Jose-Oakland, fifth, sixth, and seventh round-trips.<br />
Sacramen<strong>to</strong>-Roseville, second and third round-trips.<br />
Roseville-Auburn, second round-trip.<br />
2008-09 San Jose-Oakland, eighth and ninth round-trips.<br />
Oakland-Sacramen<strong>to</strong>, thirteenth and fourteenth round-trips.<br />
2010-11 San Jose-Oakland, tenth and eleventh round-trips.<br />
Oakland-Sacramen<strong>to</strong>, fifteenth and sixteenth round-trips.<br />
Sacramen<strong>to</strong>-Roseville, fourth round-trip.<br />
Auburn-Oakland, third round-trip.<br />
2012-13 San Jose -Oakland, twelfth and thirteenth round-trips.<br />
Oakland -Sacramen<strong>to</strong>, seventeenth and eighteenth round-trips.<br />
Sacramen<strong>to</strong>-Roseville, fifth and sixth round-trips.<br />
Roseville-Auburn, fourth round-trip.<br />
94
Chapter VIII – The Capi<strong>to</strong>l Corridor<br />
2014-15 San Jose-Oakland, fourteenth, fifteenth, and sixteenth round-trips.<br />
Sacramen<strong>to</strong>-Roseville, seventh and eighth round-trips.<br />
SACRAMENTO-RENO EXTENSION<br />
The extension of intercity rail service from Sacramen<strong>to</strong> <strong>to</strong> Reno would bring <strong>State</strong>supported<br />
rail service <strong>to</strong> the Truckee/Tahoe and Reno/Sparks <strong>to</strong>urist areas as well<br />
as provide relief <strong>to</strong> the highly congested I-80 Bay Area <strong>to</strong> Reno corridor.<br />
The Department’s and the CCJPA’s plan includes the extension of<br />
one Capi<strong>to</strong>l Corridor round-trip from Auburn <strong>to</strong> Reno/Sparks in 2008-09,<br />
and a second round-trip in 2010-11. This rail service would be supplemented by<br />
continued operation of existing bus service that runs over the same route as the<br />
train, but at other times of the day. This service would require an appropriate level<br />
of financial participation from Nevada. For more detailed information on this<br />
route expansion, see Chapter X.<br />
DUMBARTON RAIL CORRIDOR<br />
The CCJPA is participating in the development of the Dumbar<strong>to</strong>n <strong>Rail</strong> Corridor as<br />
an extension of Caltrain <strong>to</strong> extend commuter rail service across the Bay between<br />
the Peninsula and the East Bay. The new service is planned <strong>to</strong> start in 2010 with<br />
three round-trips. This new rail corridor could connect <strong>to</strong> the Capi<strong>to</strong>l Corridor at<br />
Union City where the BART station would be reconstructed as a multimodal<br />
terminal. The CCJPA’s ten-year capital improvement program includes funding<br />
for station and track work <strong>to</strong> allow the Capi<strong>to</strong>l Corridor trains <strong>to</strong> service the new<br />
Union City terminal. For more detailed information on this route expansion,<br />
see Chapter IX.<br />
AUBURN-OAKLAND REGIONAL RAIL SERVICE<br />
Five agencies, including the CCJPA, have partnered <strong>to</strong> develop a service concept<br />
plan for a new regional commuter rail service in the urban corridor extending from<br />
Auburn (Bowman) <strong>to</strong> Oakland. The Auburn-Oakland Regional <strong>Rail</strong> Service<br />
Concept <strong>Plan</strong> (<strong>Plan</strong>) released in June <strong>2005</strong> envisions that the new service would<br />
augment existing Capi<strong>to</strong>l Corridor intercity service by providing additional peak<br />
period capacity for within the greater Sacramen<strong>to</strong> urban area and between<br />
Sacramen<strong>to</strong> and the Bay Area. The two services would utilize the same<br />
equipment, staff, and fare structure, and thus would appear fully unified <strong>to</strong> the<br />
riding public. The <strong>Plan</strong> includes three-phases; a first phase, planned for 2010<br />
would add four new Sacramen<strong>to</strong>-Oakland round-trips. The second phase, planned<br />
for <strong>2015</strong>, would include four new Sacramen<strong>to</strong>-Auburn round-trips and one<br />
additional Oakland <strong>to</strong> Sacramen<strong>to</strong> round-trip. The third phase, planned for 2020,<br />
would add new stations, primarily in the Sacramen<strong>to</strong> metropolitan area. For more<br />
detailed information on this route expansion, see Chapter X.<br />
95
<strong>2005</strong>-<strong>06</strong> – <strong>2015</strong>-<strong>16</strong> <strong>California</strong> <strong>State</strong> <strong>Rail</strong> <strong>Plan</strong><br />
ROUTE HISTORY AND PERFORMANCE<br />
Intercity rail service started on the Capi<strong>to</strong>l Corridor in 1991, making this route the<br />
newest of the three <strong>State</strong>-supported routes. ACR 132 (Hannigan), Statutes of<br />
1988, directed the Metropolitan Transportation Commission (MTC), with<br />
assistance from the Sacramen<strong>to</strong> Area Council of Governments and the Department<br />
<strong>to</strong> conduct a study of the Auburn-Sacramen<strong>to</strong>-Oakland-San Jose intercity rail<br />
corridor. The final report titled ACR 132 Intercity <strong>Rail</strong> Corridor Upgrade Study<br />
was published by MTC in 1990 and provided the basis for the initiation of service<br />
on the Route.<br />
Service has increased from the original three round-trips <strong>to</strong> the current twelve<br />
round-trips from Oakland <strong>to</strong> Sacramen<strong>to</strong> as follows:<br />
12/12/91 San Jose-Oakland-Sacramen<strong>to</strong>: three round-trips with one<br />
continuing <strong>to</strong> Roseville.<br />
4/2/95 Oakland-San Jose: one round-trip discontinued (except on Saturday<br />
northbound and Friday, Saturday, Sunday southbound).<br />
4/14/96 Oakland-Sacramen<strong>to</strong>: fourth round-trip added.<br />
6/17/96 Oakland-San Jose round-trip that was discontinued April 2, 1995, is<br />
res<strong>to</strong>red.<br />
1/26/98 Train <strong>to</strong> Roseville extended <strong>to</strong> Colfax.<br />
10/25/98 Oakland-Sacramen<strong>to</strong>: fifth round-trip added.<br />
2/21/99 Oakland-Sacramen<strong>to</strong>: sixth round-trip added.<br />
2/27/00 Oakland-Sacramen<strong>to</strong>: seventh round-trip added.<br />
2/27/00 Oakland-San Jose: fourth round-trip added.<br />
2/27/00 Colfax round-trip cut back <strong>to</strong> Auburn.<br />
4/29/01 Oakland-Sacramen<strong>to</strong>: eighth and ninth round-trips added.<br />
4/29/01 Oakland-San Jose: fifth and sixth round-trips, added on weekends<br />
only.<br />
10/27/02 Oakland-Sacramen<strong>to</strong>: tenth round-trip, added on weekdays only.<br />
1/6/03 Oakland-Sacramen<strong>to</strong>: eleventh round-trip, added on weekdays only.<br />
4/28/03 Oakland-Sacramen<strong>to</strong>: twelfth round-trip, added on weekdays only.<br />
96
Chapter VIII – The Capi<strong>to</strong>l Corridor<br />
Figure 8B<br />
CAPITOL CORRIDOR<br />
Annual Operating Performance - <strong>State</strong> Fiscal Years<br />
<strong>State</strong> Ridership Data Financial Data for Operations<br />
Fiscal<br />
Train Loss Farebox<br />
Year Ridership PM/TM Revenue Expense Loss <strong>State</strong> Cost Amtrak Cost per PM Ratio<br />
Notes (F1) (F2) (F3) (F4) (F5) (F6)<br />
1991-92 (S1) 173,672 96.3 $ 1,973,255 $ 4,848,967 $ 2,875,712 $ 1,592,907<br />
15.0¢ 40.7%<br />
1992-93 238,785 67.7 $ 2,970,103 $ 8,333,093 $ 5,362,990 $ 6,712,017<br />
20.1¢ 35.6%<br />
1993-94 364,070 101.2 $ 3,598,978 $ 9,911,735 $ 6,312,757 $ 6,714,761 $ 1,697,460 15.7¢ 36.3%<br />
1994-95 (S2) 349,056 101.7 $ 3,757,146 $ 9,678,401 $ 5,921,255 $ 6,012,315 $ 1,584,692 14.9¢ 38.8%<br />
1995-96 (S3) 403,050 111.9 $ 4,805,072 $ 11,077,485 $ 6,272,413 $ 6,434,940 $ 273,025 14.9¢ 43.4%<br />
1996-97 496,586 111.3 $ 5,938,072 $ 20,509,999 $ 14,571,927 $ 9,701,519 $ 4,871,345 31.6¢ 29.0%<br />
1997-98 (S4) 484,458 109.4 $ 6,212,150 $ 20,597,133 $ 14,384,983 $ 10,830,123 $ 3,555,755 31.8¢ 30.2%<br />
1998-99 (S5) 515,768 90.8 $ 6,939,702 $ 22,343,915 $ 15,404,213 $ 14,543,722 $ 969,291 32.6¢ 31.1%<br />
1999-00 (S6) 684,334 90.1 $ 8,546,453 $ 25,048,098 $ <strong>16</strong>,501,645 $ 17,120,868 $ 194,932 28.2¢ 34.1%<br />
2000-01 (S7) 1,030,837 1<strong>06</strong>.0 $ 11,091,742 $ 27,670,759 $ <strong>16</strong>,579,017 $ 18,558,681 $ 92,014 21.0¢ 40.1%<br />
2001-02 1,090,713 96.9 $ 12,321,755 $ 32,683,794 $ 20,362,039 $ 21,263,811 $ 99,311 25.3¢ 37.7%<br />
2002-03 (S8) 1,129,683 92.0 $ 12,550,182 $ 35,390,303 $ 22,840,121 $ 22,413,396 $ 170,254 28.1¢ 35.5%<br />
2003-04 1,148,047 86.3 $ 13,012,8<strong>06</strong> $ 36,231,990 $ 23,219,184 $ 23,<strong>16</strong>8,004 $ 9,584 28.0¢ 35.9%<br />
2004-05 1,239,082 93.1 $ 14,788,299 $ 39,<strong>16</strong>0,356 $ 24,372,057 $ 24,372,057<br />
27.3¢ 37.8%<br />
TOTAL 9,348,141 $ 108,505,715 $ 303,486,028 $ 194,980,313 $ 189,439,121<br />
(S1)<br />
(S2)<br />
(S3)<br />
(S4)<br />
(S5)<br />
(S6)<br />
(S7)<br />
(S8)<br />
Service started 12/12/91 with three <strong>State</strong>-supported round trips between Sacramen<strong>to</strong> and San Jose,<br />
with one round trip extended <strong>to</strong> Roseville. Data is for six and one-half months only.<br />
One round trip discontinued 4/2/95 between Oakland and San Jose (except on Saturday northbound and<br />
Friday, Saturday, Sunday southbound.) Feeder bus connection substituted for train.<br />
Fourth round trip added 4/14/96 between Sacramen<strong>to</strong> and Oakland.<br />
Effective 6/17/96, round trip referred <strong>to</strong> in (S2) above res<strong>to</strong>red <strong>to</strong> daily service between Oakland and San Jose.<br />
Effective 1/26/98, the round trip that previously originated and terminated at Roseville was extended <strong>to</strong> Colfax.<br />
Fifth round trip added 10/25/98 and sixth round trip added 2/21/99 between Sacramen<strong>to</strong> and Oakland.<br />
Effective 2/27/00, seventh round trip added between Sacramen<strong>to</strong> and Oakland; fourth round trip added between Oakland and<br />
San Jose; the round trip <strong>to</strong> Colfax was cut back <strong>to</strong> Auburn.<br />
Effective 4/29/01, eighth and ninth round trips added between Sacramen<strong>to</strong> and Oakland;<br />
fifth and sixth round trips added between Oakland and San Jose on weekends only.<br />
Effective 10/27/02, tenth round trip added; effective 1/6/03, eleventh round trip added; effective 4/28/03, twelfth round trip<br />
added. These additional trains operate weekdays only between Sacramen<strong>to</strong> and Oakland.<br />
(F1)<br />
(F2)<br />
(F3)<br />
(F4)<br />
(F5)<br />
(F6)<br />
Passenger-miles per train mile (PM/TM), a measure of the average load on a train over its entire route.<br />
Through September 1995, all trains billed on long term avoidable cost basis; includes cost of connecting buses.<br />
Effective Oc<strong>to</strong>ber 1996, all trains billed on Full Cost (Train, Route and System) Basis.<br />
Though September 1995, <strong>State</strong> cost was 65 percent of train operating loss. Between Oc<strong>to</strong>ber 1995 and<br />
September 1996, <strong>State</strong> cost was 100 percent of train operating loss. Between Oc<strong>to</strong>ber 1996 and September 1997,<br />
<strong>State</strong> cost was 55 percent of the train operating loss. Effective Oc<strong>to</strong>ber 1997, <strong>State</strong> is billed contractually specified<br />
percentages of most individual cost elements, plus a fixed amount for certain other cost elements. Also includes <strong>State</strong><br />
payment of costs of special agreements with Amtrak for use of equipment, special payments for service continuation<br />
and <strong>State</strong> payment for entire net cost of all connecting bus routes. Effective Oc<strong>to</strong>ber 1999, the Capi<strong>to</strong>l Corridor Joint<br />
Powers Authority (CCJPA) and Amtrak entered in<strong>to</strong> a 12 month fixed price operating contract, including all train and<br />
bus services. The <strong>State</strong> Costs shown represent the fixed price contract payment less any performance assessments.<br />
Beginning in <strong>State</strong> Fiscal Year 1993-94, Amtrak cost is based on billings submitted and reflects cost bases and Amtrak shares as<br />
stated in notes (F2) and (F3) above. However, Amtrak does not include the unbilled Amtrak share of fixed cost elements.<br />
Prior <strong>to</strong> FY 1993-94, data <strong>to</strong> calculate Amtrak cost is not available. Does not represent the difference between Loss and<br />
<strong>State</strong> Cost, as the latter includes bus expenses and equipment capital costs not included in Amtrak costs.<br />
Train loss (deficit) per train passenger-mile. Connecting buses not included in loss per passenger mile data.<br />
Farebox Ratio, the ratio of Revenue <strong>to</strong> Expense.<br />
97
<strong>2005</strong>-<strong>06</strong> – <strong>2015</strong>-<strong>16</strong> <strong>California</strong> <strong>State</strong> <strong>Rail</strong> <strong>Plan</strong><br />
HISTORICAL PERFORMANCE<br />
Figure 8B shows ridership and financial performance data on an annual basis from<br />
the start of <strong>State</strong>-supported Amtrak rail passenger service in 1991-92 through<br />
2004-05. Ridership and revenues have increased over that period, as have<br />
expenses, loss, and <strong>State</strong> cost. The farebox ratio on this Route has not fluctuated<br />
as much as on the San Joaquins and Pacific Surfliners for a number of reasons.<br />
First, when the Capi<strong>to</strong>l Corridor service started, Amtrak had already begun<br />
increasing costs that are included in the farebox ratio. By 1996-97, Amtrak was<br />
charging a cost basis similar <strong>to</strong> the current basis. Also, the Capi<strong>to</strong>l Corridor<br />
service is still relatively new and has added frequencies at a relatively fast rate.<br />
Thus, the growth tends <strong>to</strong> be offset by new costs for increased frequencies. The<br />
Capi<strong>to</strong>l Corridor service has a lower a farebox ratio than the other two routes,<br />
primarily as a result of its shorter trip length. The Capi<strong>to</strong>l Corridor farebox ratio<br />
(37.8 percent in 2004-05) has ranged between a high of 43.4 percent in 1995-96<br />
and a low of 29 percent in 1996-97.<br />
OTP on the Capi<strong>to</strong>l Corridor was fairly low during the initial years of the service.<br />
With the completion in early 1999 of major track and signal work over much of<br />
the route, OTP improved considerably. In 2004-05, OTP averaged 86.6 percent.<br />
The planned new trackage and signal improvement projects between Oakland and<br />
San Jose will improve the Capi<strong>to</strong>l Corridor’s reliability and OTP by facilitating<br />
both passenger and freight train movements and by providing more opportunities<br />
for trains <strong>to</strong> pass each other.<br />
ROUTE DESCRIPTION<br />
The Capi<strong>to</strong>l Corridor now has four weekday round-trips between Oakland and<br />
San Jose (six on weekends), twelve weekday round-trips between Oakland and<br />
Sacramen<strong>to</strong> (nine on weekends), and one daily Sacramen<strong>to</strong> <strong>to</strong> Auburn round-trip.<br />
Scheduled running time between Oakland and Sacramen<strong>to</strong> averages<br />
1 hour-50 minutes (for trains starting or ending in Oakland) with the overall speed<br />
averaging 44 mph. Scheduled running time between Oakland and San Jose<br />
averages 1 hour-13 minutes with the overall speed averaging 36 mph. Scheduled<br />
running time between Sacramen<strong>to</strong> and Auburn averages one hour and four<br />
minutes with the overall speed averaging 33 mph.<br />
The Capi<strong>to</strong>l Corridor extends <strong>16</strong>9 rail miles from Auburn <strong>to</strong> San Jose (35 miles<br />
east of Sacramen<strong>to</strong> and 134 miles west of Sacramen<strong>to</strong>.) Except for three miles of<br />
ROW owned by the Peninsula Corridor Joint Powers Board, UP owns this entire<br />
route. Amtrak operates the Capi<strong>to</strong>l Corridor under provisions of its contract with<br />
UP. Figure 8C describes the current ownership, segment mileage, and track and<br />
signal characteristics of the Capi<strong>to</strong>l Corridor.<br />
98
Chapter VIII – The Capi<strong>to</strong>l Corridor<br />
Figure 8C<br />
Between Mile Post And Mile Post<br />
Route<br />
Miles<br />
Owner of<br />
Track<br />
*No. of<br />
Tracks<br />
Max.<br />
Speed<br />
Signal<br />
System<br />
San Jose 47.3 Santa Clara 44.4 2.9 PCJPB 3 60 CTC<br />
Santa Clara 44.4 Newark 31.4 13.8 UP 1 70 CTC<br />
Newark 34.9 Niles Tower 29.7 5.2 UP 1 79 CTC<br />
Niles Tower 29.7 West Elmhurst 13.5 <strong>16</strong>.2 UP 1 70 CTC<br />
West Elmhurst<br />
13.5<br />
Oakland Jack London<br />
Square 7.0 6.5 UP 2 60 ABS<br />
Oakland - Jack London<br />
Square 7.0<br />
Oakland 10th Street<br />
**4.2 2.8 UP 2 40/60 CTC<br />
Oakland 10th Street **2.2 Martinez 31.7 29.5 UP 2 40/60 CTC<br />
Martinez 31.7 Davis 75.5 43.8 UP 2 79 CTC<br />
Davis 75.5 West Causeway 81.1 5.6 UP 2 79 CTC<br />
West Causeway 81.1 East Causeway 85.2 4.1 UP 2 79 CTC<br />
East Causeway 85.2 Sacramen<strong>to</strong> River 88.4 3.2 UP 2 79 CTC<br />
Sacramen<strong>to</strong> River 88.4 Sacramen<strong>to</strong> 89.0 0.5 UP 2 30 CTC<br />
Sacramen<strong>to</strong> 89.0 Elvas 91.8 2.8 UP 2 35 CTC<br />
Elvas 91.8 Roseville 1<strong>06</strong>.6 14.8 UP 2 60 CTC<br />
Roseville 1<strong>06</strong>.6 Auburn 124.2 17.6 UP 1 50 ABS<br />
Total <strong>16</strong>9.3<br />
*General number of mainline tracks<br />
Owners:<br />
CAPITOL CORRIDOR<br />
OWNERSHIP AND TRACK CHARACTERISTICS<br />
**Mileage represents distance between mile posts <strong>to</strong> an approximate location at 10th Street in Oakland<br />
PCJPB - Peninsula Corridor Joint Powers Board<br />
UP - Union Pacific <strong>Rail</strong>road Company<br />
Signal Systems:<br />
ABS - Au<strong>to</strong>matic Block Signals - Possession of a segment of track (block) is protected by a wayside<br />
signal. Switches must be thrown manually by train crews entering sidings.<br />
CTC - Centralized Traffic Control - Wayside signals protect possession of blocks. Signals and powered<br />
switches are also remotely controlled from the dispatching center <strong>to</strong> direct the movement of trains.<br />
99
<strong>2005</strong>-<strong>06</strong> – <strong>2015</strong>-<strong>16</strong> <strong>California</strong> <strong>State</strong> <strong>Rail</strong> <strong>Plan</strong><br />
CONNECTING AMTRAK BUSES<br />
The network of buses connecting with the Capi<strong>to</strong>l Corridor is important <strong>to</strong> the<br />
route’s success because the buses significantly extend the route’s range north <strong>to</strong><br />
McKinleyville (near Eureka) and Redding; northeast <strong>to</strong> Reno, Lake Tahoe, and<br />
Carson City; and south <strong>to</strong> San Luis Obispo and Santa Barbara.<br />
The CCJPA contracts with Amtrak for the provision of dedicated feeder bus<br />
services, and Amtrak then contracts with bus opera<strong>to</strong>rs or local transit opera<strong>to</strong>rs.<br />
The bus routes function as direct parts of the Amtrak system, with coordinated<br />
connections, guaranteed seating, integrated fares and ticketing procedures, and<br />
inclusion in Amtrak’s central information and reservation system in the same<br />
manner as the trains.<br />
Below is a listing of the Capi<strong>to</strong>l Corridor bus routes and their origins/destinations,<br />
as well as the San Joaquin bus routes that also connect <strong>to</strong> the Capi<strong>to</strong>l Corridor.<br />
Cities that are Capi<strong>to</strong>l Corridor train connection points are in italics.<br />
Capi<strong>to</strong>l Corridor Bus Routes<br />
Route 20–High Sierra/Sierra Foothills<br />
Sacramen<strong>to</strong>-Reno/Sparks<br />
Route 21–Monterey Bay/Central Coast<br />
Oakland-San Jose/San Luis Obispo/Santa Barbara<br />
Route 23–Lake Tahoe<br />
Sacramen<strong>to</strong>-<strong>State</strong>line/Carson City<br />
Highway 17 Express - Santa Cruz (through ticketing with local transit opera<strong>to</strong>r)<br />
San Jose-Santa Cruz<br />
Highway 49 Express (through ticketing with local transit opera<strong>to</strong>r)<br />
Auburn-Grass Valley<br />
San Joaquin Route Bus Routes<br />
Route 3–Sacramen<strong>to</strong> Valley<br />
Sacramen<strong>to</strong>-Redding<br />
Route 7–North Bay/Redwood Empire<br />
Martinez-Eureka/McKinleyville<br />
Amtrak Bus Route<br />
Route 99–Trans Bay<br />
Emeryville-San Francisco<br />
100
101<br />
Chapter VIII – The Capi<strong>to</strong>l Corridor
<strong>2005</strong>-<strong>06</strong> – <strong>2015</strong>-<strong>16</strong> <strong>California</strong> <strong>State</strong> <strong>Rail</strong> <strong>Plan</strong><br />
Figure 9A<br />
102
Chapter IX – Commuter <strong>Rail</strong> Services<br />
CHAPTER IX<br />
COMMUTER RAIL SERVICES<br />
This chapter discusses the four existing commuter rail systems in <strong>California</strong>,<br />
including their extension plans: Coaster, Metrolink, Caltrain and ACE. Figure 9A<br />
is a map of existing and potential commuter rail services. Figure 9B is a map of<br />
Southern <strong>California</strong> commuter rail services and Figure 9E is a map of<br />
Northern <strong>California</strong> commuter rail services (shown later in this chapter).<br />
Also discussed are three proposed new commuter rail routes: Ventura and<br />
Santa Barbara Commuter <strong>Rail</strong> Service, Sonoma-Marin-Area <strong>Rail</strong> Transit and<br />
Auburn-Oakland Regional <strong>Rail</strong>.<br />
COASTER COMMUTER RAIL SERVICE<br />
(SAN DIEGO-OCEANSIDE)<br />
PRINCIPAL <strong>2005</strong>-<strong>06</strong> <strong>to</strong> <strong>2015</strong>-<strong>16</strong> ROUTE OBJECTIVES<br />
• Increase ridership and improve mobility in the region.<br />
• Implement timed transfers at various stations and transit centers.<br />
• Initiate and continue implementation of the Cus<strong>to</strong>mer Amenities<br />
Program.<br />
• Implement incremental service increases, if feasible, including:<br />
supplementary mid-day service, reverse peak service, evening service,<br />
and weekend service.<br />
• Construct Oceanside passing track.<br />
• Construct new mainline track between O’Neil and Flores.<br />
• Replace single-track San Diegui<strong>to</strong> River and Santa Margarita bridges<br />
with new two-track concrete bridges.<br />
• Replace other timber bridges with new concrete bridges.<br />
• Upgrade sidings and add second main track segments.<br />
• Continue stabilization of Del Mar Bluffs.<br />
• Construct new parking garage at Oceanside Transit Center.<br />
• Extend platforms at Old Town and Poinsettia Stations.<br />
• Build 500-space parking structure at Solana Beach Station for mixeduse<br />
development.<br />
103
<strong>2005</strong>-<strong>06</strong> – <strong>2015</strong>-<strong>16</strong> <strong>California</strong> <strong>State</strong> <strong>Rail</strong> <strong>Plan</strong><br />
Figure 9B<br />
104
Chapter IX – Commuter <strong>Rail</strong> Services<br />
BACKGROUND<br />
The North San Diego County Transit Development Board (Board) was created by<br />
<strong>State</strong> law in 1975 <strong>to</strong> plan, construct, and operate itself or through a contrac<strong>to</strong>r, a<br />
public transit system in its area of jurisdiction. In 1976, the Board formed the<br />
North County Transit District (NCTD) for the purpose of providing integrated<br />
public transit services within the North San Diego County region.<br />
In 1987, voters approved the Proposition A “TransNet” Ordinance, which<br />
provided funding for future transit projects and improvements <strong>to</strong> the existing<br />
system. At the same time, planning began on the Coaster commuter rail service<br />
between Oceanside and San Diego. In order <strong>to</strong> expand rail passenger services, in<br />
1992 the Board purchased a significant segment of the LOSSAN <strong>Rail</strong> Corridor<br />
from the ATSF.<br />
In 1994, the Board created a non-profit corporation called the San Diego Northern<br />
<strong>Rail</strong>way (SDNR) <strong>to</strong> maintain, enhance, and operate the SDNR facilities and<br />
Coaster Express <strong>Rail</strong> Service. In 2002, SB 1703 consolidated the planning,<br />
programming, and construction functions under the San Diego Association of<br />
Governments. Also in 2002, the Board voted <strong>to</strong> dissolve the SDNR and directly<br />
manage rail services and facilities. Coaster rail service began on February 27,<br />
1995 between Oceanside and San Diego.<br />
The Board owns the portion of the LOSSAN <strong>Rail</strong> Corridor from the<br />
Orange/San Diego County Line (at Mile Post 207.4) south <strong>to</strong> the city limits of<br />
Del Mar/San Diego (at Mile Post 245.6). The Metropolitan Transit Development<br />
Board (MTDB) owns the portion of the LOSSAN <strong>Rail</strong> Corridor from that point<br />
south <strong>to</strong> the Santa Fe Depot in San Diego (at Mile Post 267.6). Per agreement, the<br />
NCTD also provides maintenance of the LOSSAN <strong>Rail</strong> Corridor in MTDB’s area<br />
of ownership.<br />
ORGANIZATIONAL STRUCTURE<br />
The Board of Direc<strong>to</strong>rs of NCTD is comprised of one member of each of the city<br />
councils of the cities of Carlsbad, Del Mar, Encinitas, Escondido, Oceanside,<br />
Solana Beach, San Marcos, and Vista, and one member from the San Diego<br />
County Board of Supervisors.<br />
ROUTE AND SERVICE DESCRIPTION<br />
The Coaster serves eight stations between San Diego and Oceanside and operates<br />
22 trains per day Monday through Thursday, with 26 trains on Friday and frequent<br />
service during peak periods. Eight round-trips are operated on Saturday.<br />
No service is operated on Sunday or holidays. The running time from San Diego<br />
<strong>to</strong> Oceanside is approximately 57 minutes. All Coaster trains are wheelchair<br />
accessible.<br />
105
<strong>2005</strong>-<strong>06</strong> – <strong>2015</strong>-<strong>16</strong> <strong>California</strong> <strong>State</strong> <strong>Rail</strong> <strong>Plan</strong><br />
The Coaster has eight stations: Oceanside Transit Center, Carlsbad Village,<br />
Carlsbad Poinsettia, Encinitas, Solana Beach, Sorren<strong>to</strong> Valley, Old Town Transit<br />
Center and San Diego Santa Fe Depot. All stations have parking facilities.<br />
Parking improvements are currently being developed for the Oceanside Transit<br />
Center and the Solana Beach Station.<br />
FARE STRUCTURE<br />
The Coaster fare structure is based on distance traveled, with four fare zones.<br />
Passengers purchase their tickets from ticket vending machines at station<br />
platforms before boarding the train, and they must present a validated ticket or<br />
monthly pass <strong>to</strong> the conduc<strong>to</strong>r or ticket inspec<strong>to</strong>r upon request. Ticket types<br />
available include one-way tickets, ten-ride tickets, monthly plus pass, and youth<br />
monthly plus pass. Discounts of approximately 50 percent are offered <strong>to</strong> seniors<br />
and the disabled.<br />
The <strong>Rail</strong> 2 <strong>Rail</strong> program allows Coaster and Amtrak <strong>to</strong> accept certain tickets<br />
issued by each other’s rail services. Therefore, Coaster monthly pass holders<br />
traveling between Oceanside and San Diego can increase their train service<br />
options at no additional cost. Amtrak ticket holders also enjoy the same privilege<br />
on Coaster trains within the limits of their ticket at no additional charge.<br />
CONNECTING SERVICES<br />
Coaster passengers can connect with Amtrak trains at Oceanside, Solana Beach,<br />
Old Town Station, and Down<strong>to</strong>wn Santa Fe Station in San Diego. At Oceanside<br />
Transit Center, connections are available <strong>to</strong> Metrolink commuter service <strong>to</strong><br />
Los Angeles. Connections are made <strong>to</strong> San Diego Transit, San Diego Trolley,<br />
County Transit System, Metropolitan Transit System, Chula Vista Transit, and<br />
National City Transit at these stations: Sorren<strong>to</strong> Valley Station, Old Town Transit<br />
Center, and San Diego’s Santa Fe Depot. The link <strong>to</strong> San Diego <strong>State</strong> University<br />
is at the Old Town Transit Center using the San Diego Trolley’s new Green Line<br />
Mission Valley East Extension. In addition, there is a free connection from the<br />
San Diego terminal <strong>to</strong> the San Diego International Airport through San Diego<br />
Transit. The NCTD Breeze buses provide several North San Diego County region<br />
connections. Also, the Carlsbad Village Coaster Connection and the<br />
Sorren<strong>to</strong> Valley Connection provide peak hour shuttle service <strong>to</strong> the Coaster.<br />
1<strong>06</strong>
Chapter IX – Commuter <strong>Rail</strong> Services<br />
PERFORMANCE<br />
Figure 9C shows the annual Coaster<br />
ridership data from the beginning of<br />
service in 1995 through <strong>2005</strong>. As<br />
traffic on I-5 and I-805 continues <strong>to</strong><br />
increase, more commuters have<br />
turned <strong>to</strong> the Coaster, whose ridership<br />
has increased <strong>to</strong> almost 1.5 million in<br />
<strong>2005</strong>.<br />
Figure 9C<br />
Coaster Ridership<br />
Calendar Years 1995-<strong>2005</strong><br />
Year Ridership Year Ridership<br />
1995 514,453 2001 1,258,263<br />
1996 850,999 2002 1,300,047<br />
1997 945,739 2003 1,366,479<br />
1998 1,132,445 2004 1,474,360<br />
1999 1,251,238 <strong>2005</strong> 1,485,125<br />
2000 1,183,058<br />
CAPITAL IMPROVEMENT PROGRAM<br />
The Coaster is working <strong>to</strong> improve its infrastructure, including rail equipment<br />
purchases and major system overhauls, bridge and track improvements, facility<br />
and maintenance improvements, radio communication upgrades, technology<br />
enhancements, and emergency response and system safety upgrades. These<br />
projects will increase safety, ridership, and improve reliability of the service.<br />
Double-Tracking Projects<br />
Oceanside Passing Track – This Department project entails two components.<br />
The first is construction of a 1.2 mile long passing track extension that will cross<br />
Loma Alta Creek on a new concrete bridge. The second is <strong>to</strong> replace the existing<br />
timber trestle bridge over Loma Alta Creek with a concrete bridge.<br />
O’Neil-Flores Second Track – This Department project involves connecting the<br />
existing Stuart and Pulgas sidings by constructing 1.8 miles of new mainline track<br />
between control point (CP) O’Neil at MP 219.0 and CP Flores at MP 220.8.<br />
The project also includes rehabilitating the existing 0.9 mile Pulgas siding from<br />
CP Flores <strong>to</strong> CP Pulgas at MP 218.1 <strong>to</strong> mainline track standards and shifting<br />
4,050 feet of existing mainline and siding track. When completed, the length of<br />
double-track available for train meets and passes will extend from CP Pulgas <strong>to</strong><br />
CP Puller at MP 222.8 for a <strong>to</strong>tal length of 4.7 miles.<br />
San Diegui<strong>to</strong> River Bridge Replacement and Second Main Track – This<br />
project replaces a single-track bridge with a double-track concrete bridge, and<br />
adds 1.1 miles of second main track <strong>to</strong> connect the existing passing tracks at<br />
Solana Beach and Del Mar. The resultant double-track will be 2.8 miles in length.<br />
Santa Margarita Bridge Replacement and Second Main Track – This project<br />
will consist of three components: (1) replacement of the existing single-track<br />
Santa Margarita River <strong>Rail</strong>road Bridge with a new two-track bridge,<br />
(2) construction of a 0.8 mile new second main track, and (3) an upgrade and<br />
realignment of the existing 1.7 mile Fallbrook Junction Passing Track.<br />
In addition, the westerly 0.2-mile of the existing Stuart Mesa Passing Track will<br />
107
<strong>2005</strong>-<strong>06</strong> – <strong>2015</strong>-<strong>16</strong> <strong>California</strong> <strong>State</strong> <strong>Rail</strong> <strong>Plan</strong><br />
be realigned <strong>to</strong> accommodate new turnouts, signal modifications, retained<br />
embankments, and drainage facilities.<br />
Rehabilitation and Replacement Projects<br />
Bridge 230.6 Replacement Project – Significant marine borer pile damage has<br />
been detected on this 196-foot long timber trestle spanning the Agua Hedionda<br />
Lagoon in south Carlsbad, requiring its replacement.<br />
Del Mar Bluffs Stabilization-Phase 2-Preserving Track Bed Support –<br />
An alternatives analysis will be done <strong>to</strong> evaluate options <strong>to</strong> stabilize the track bed<br />
support within high-risk s<strong>to</strong>rm erosion areas including <strong>to</strong>p of bluff, <strong>to</strong>e of bluff,<br />
and bluff face stabilization.<br />
Del Mar Bluffs Stabilization-Phase 3-Additional Bluff Stabilization – Eroded<br />
track bed support will be replaced, the bluff face will be protected, and the bluff<br />
<strong>to</strong>e will be reinforced in high-risk s<strong>to</strong>rm erosion areas, as identified in the<br />
geotechnical study.<br />
Station Improvement Projects<br />
Encinitas Station Parking Lot Expansion – Additional parking facilities will be<br />
provided.<br />
Oceanside Transit Center – Landscaping and signage will be enhanced.<br />
Oceanside Transit Center Parking Structure – A new parking garage is being<br />
constructed at Oceanside Transit Center, just north of the station. The three-s<strong>to</strong>ry<br />
garage will house approximately 450 parking spaces and will be completed in<br />
April 20<strong>06</strong>.<br />
Old Town Station Platform Extension – This project will extend the station<br />
platform.<br />
Poinsettia Station Platform Extension – This project will extend both station<br />
platforms.<br />
Solana Beach Station Parking – A 500-space parking structure will be<br />
constructed as part of a mixed-use development located at the Station.<br />
108
Chapter IX – Commuter <strong>Rail</strong> Services<br />
METROLINK COMMUTER RAIL SERVICE<br />
(LOS ANGELES, ORANGE, RIVERSIDE, SAN BERNARDINO, AND<br />
VENTURA COUNTIES)<br />
PRINCIPAL <strong>2005</strong>-<strong>06</strong> <strong>to</strong> <strong>2015</strong>-<strong>16</strong> ROUTE OBJECTIVES<br />
• Improve cus<strong>to</strong>mer service and accessibility.<br />
• Improve integration with other transit services.<br />
• Purchase 43 <strong>to</strong> 66 new rail cars.<br />
• Initiate a study of Sealed Corridor safety improvements on SCRRAowned<br />
lines.<br />
• Complete systemwide rail line rehabilitation/renovation projects.<br />
• Design and construct Eastern Area maintenance facility.<br />
• Perform various projects <strong>to</strong> improve system performance.<br />
• Purchase and rebuild used locomotives.<br />
• Install Lincoln Avenue double-track.<br />
• Construct 5 th lead track at LAUS.<br />
• Construct new rolling s<strong>to</strong>ck s<strong>to</strong>rage facility at Keller Street in<br />
Los Angeles.<br />
• Implement Perris Valley extension, Redlands extension, Santa Paula<br />
Branch Line, and Fuller<strong>to</strong>n-Laguna Niguel/Mission Viejo service<br />
enhancements.<br />
BACKGROUND<br />
In June 1990, the <strong>California</strong> Legislature enacted SB 1402 which required the<br />
transportation commission of the counties of Los Angeles, Orange, Riverside, and<br />
San Bernardino <strong>to</strong> develop a plan for regional transit services within the multicounty<br />
region.<br />
In August 1991, the SCRRA, a joint powers agency, was created <strong>to</strong> plan, design,<br />
construct, and administer the operation of a regional passenger rail system serving<br />
the counties of Los Angeles, Orange, Riverside, San Bernardino, and Ventura.<br />
The SCRRA named the regional commuter rail system “Metrolink.”<br />
Today, Metrolink serves up <strong>to</strong> 41,000 daily trips in 238 cities or census-defined<br />
places throughout Southern <strong>California</strong>.<br />
The first three lines, San Bernardino, Santa Clarita (now Antelope Valley), and<br />
Ventura County, began service <strong>to</strong> Los Angeles on Oc<strong>to</strong>ber 26, 1992.<br />
The Riverside Line was added in June 1993, and the Orange Line was added in<br />
April 1994. The sixth line, Inland Empire-Orange County, was added in<br />
Oc<strong>to</strong>ber 1995. In May of 2002, the 91 Line between Los Angeles and Riverside<br />
109
<strong>2005</strong>-<strong>06</strong> – <strong>2015</strong>-<strong>16</strong> <strong>California</strong> <strong>State</strong> <strong>Rail</strong> <strong>Plan</strong><br />
was opened for commuters traveling via Fuller<strong>to</strong>n. The Orange County <strong>to</strong><br />
Los Angeles Line extends as far south as Oceanside in San Diego County.<br />
The SCRRA contracts with Connex <strong>Rail</strong>road LLC <strong>to</strong> operate the commuter rail<br />
service, Bombardier for rail equipment maintenance, Los Angeles County<br />
Sheriff’s Department for security, Herzog Contracting Corporation for track and<br />
structure maintenance, and Mass Electric Construction Company for signal and<br />
communications maintenance.<br />
ORGANIZATIONAL STRUCTURE<br />
The SCRRA is a joint powers agency consisting of 11 board members and a<br />
number of member agencies. Member agencies include Los Angeles County<br />
Metropolitan Commission, Orange County Transportation Authority, Riverside<br />
County Transportation Commission, San Bernardino Associated Governments,<br />
and Ventura County Transportation Commission. Ex-officio member agencies<br />
include Southern <strong>California</strong> Association of Governments, San Diego Association<br />
of Governments, and the <strong>State</strong> of <strong>California</strong>.<br />
ROUTE AND SERVICE DESCRIPTION<br />
Metrolink presently operates 142 daily trains weekdays, serving 54 stations on the<br />
following seven lines:<br />
Ventura County Line – Montalvo, Oxnard, Camarillo, Moorpark, Simi Valley,<br />
Chatsworth, Northridge, Van Nuys, Bob Hope Burbank Airport, Down<strong>to</strong>wn<br />
Burbank, Glendale, Los Angeles.<br />
Antelope Valley Line – Lancaster, Palmdale, Vincent Grade/Ac<strong>to</strong>n,<br />
Via Princessa, Santa Clarita, Newhall, Sylmar/San Fernando, Sun Valley,<br />
Down<strong>to</strong>wn Burbank, Glendale, Los Angeles.<br />
San Bernardino Line – San Bernardino, Rial<strong>to</strong>, Fontana, Rancho Cucamonga,<br />
Upland, Montclair, Claremont, Pomona (North), Covina, Baldwin Park, El Monte,<br />
Cal <strong>State</strong> L.A., Los Angeles.<br />
Riverside Line – Riverside, Pedley, East Ontario, Down<strong>to</strong>wn Pomona, Industry,<br />
Montebello/Commerce, Los Angeles.<br />
Orange County Line – Oceanside, San Clemente, San Juan Capistrano, Laguna<br />
Niguel/Mission Viejo, Irvine, Tustin, Santa Ana, Orange, Anaheim, Fuller<strong>to</strong>n,<br />
Norwalk/Santa Fe Springs, Commerce, Los Angeles.<br />
Inland Empire-Orange County Line – San Bernardino, Riverside Down<strong>to</strong>wn,<br />
Riverside La Sierra, West Corona, Anaheim Canyon, Orange, Santa Ana, Tustin,<br />
Irvine, Laguna Niguel/Mission Viejo, San Juan Capistrano, San Clemente,<br />
Oceanside.<br />
91 Line – Riverside Down<strong>to</strong>wn, Riverside La Sierra, West Corona, Fuller<strong>to</strong>n,<br />
Norwalk/Santa Fe Springs, Los Angeles.<br />
110
Chapter IX – Commuter <strong>Rail</strong> Services<br />
Saturday and Sunday service is also operated on the San Bernardino Line, and<br />
Saturday service is run on the Antelope Valley Line. Most weekday trains operate<br />
during peak commuting hours before 8:30 a.m. and after 3:30 p.m. Trains run on<br />
modified schedules on three holidays but are not run on four major holidays.<br />
Metrolink has 512 route miles in its regional rail system. All Metrolink stations<br />
have ticket vending machines. Stations on the Metrolink routes are owned by the<br />
cities or regional transportation commissions, and 22,464 parking spaces are<br />
provided, most of which are free.<br />
During FY <strong>2005</strong>-<strong>06</strong>, Metrolink expects <strong>to</strong> expand service <strong>to</strong> 146 trains each<br />
weekday, 32 regular weekend trains, and 12 Summerlink weekend trains serving<br />
the Inland Empire and Orange County areas from July <strong>to</strong> Oc<strong>to</strong>ber. Average<br />
weekday ridership is projected <strong>to</strong> <strong>to</strong>tal 40,250 daily one-way trips for the FY.<br />
In FY <strong>2005</strong>-<strong>06</strong>, <strong>to</strong>tal rolling s<strong>to</strong>ck available will be 39 locomotives (including one<br />
leased from Sound Transit) and 151 commuter rail cars including<br />
37 cab cars (four leased from Sound Transit) and 114 passenger cars (eight leased<br />
from Sound Transit). In addition <strong>to</strong> operating commuter rail service, SCRRA<br />
dispatches and maintains in excess of 60 percent of the terri<strong>to</strong>ry over which it<br />
operates. On a daily basis, SCRRA currently dispatches 142 Metrolink trains,<br />
up <strong>to</strong> 36 Amtrak intercity trains between Moorpark and San Diego,<br />
22 NCTD-operated Coaster trains, and between 70 and 80 freight trains.<br />
SCRRA is also responsible for the maintenance of over 337 track-miles of ROW<br />
owned by SCRRA member agencies.<br />
FARE STRUCTURE<br />
Metrolink has a barrier free system with ticket vending machines at all stations.<br />
Tickets must be purchased in advance from au<strong>to</strong>mated ticket vending machines<br />
located at all station platforms. The machines accept cash, credit card, or debit<br />
cards and tickets can also be purchased at Union Station, through employee<br />
transportation coordina<strong>to</strong>rs or through the mail. Through June 30, <strong>2005</strong>,<br />
the system had a multi-zone fare structure and ticket prices were based on the<br />
number of zones traveled. On July 1, <strong>2005</strong>, SCRRA began a ten-year transition <strong>to</strong><br />
distance-based fares. All tickets are designed <strong>to</strong> include free transfers <strong>to</strong><br />
connecting public transportation. The system has a proof-of-payment system<br />
where riders must show proof of their ticket when asked <strong>to</strong> do so during random<br />
spot checks by fare enforcement personnel. Ticket types available include oneway<br />
tickets, round-trip tickets, ten-ride tickets, and monthly passes. Discounts of<br />
50 percent are offered <strong>to</strong> seniors and the disabled. Youth may travel at half the<br />
fare for all types of tickets on weekends only.<br />
Metrolink participates in the <strong>Rail</strong> 2 <strong>Rail</strong> program, which began in 2002, and<br />
allows Metrolink and Amtrak <strong>to</strong> accept certain tickets, issued from each other’s<br />
rail services. Metrolink monthly pass holders for the Orange County and Ventura<br />
County Lines can use any Amtrak train for any part of their travel within the limits<br />
111
<strong>2005</strong>-<strong>06</strong> – <strong>2015</strong>-<strong>16</strong> <strong>California</strong> <strong>State</strong> <strong>Rail</strong> <strong>Plan</strong><br />
of their pass at no additional cost. Amtrak ticket holders also enjoy the same<br />
privilege on Metrolink trains within the limits of their ticket at no additional<br />
charge.<br />
CONNECTING SERVICES<br />
Each county has a transit plan <strong>to</strong> ensure integration of Metrolink service with other<br />
transit systems and transportation modes. The fare is designed <strong>to</strong> provide a free<br />
transfer either from feeder bus or <strong>to</strong> local transit at the destination station.<br />
Metrolink passengers can connect with Amtrak trains at Anaheim, Burbank-<br />
Bob Hope Airport, Camarillo, Chatsworth, Fuller<strong>to</strong>n, Glendale, Irvine, Moorpark,<br />
Oceanside, Oxnard, San Juan Capistrano, Santa Ana, Simi Valley, and Van Nuys.<br />
Metrolink passengers can connect <strong>to</strong> the Metro Red Line subway and the<br />
Metro Gold Line at LAUS, <strong>to</strong> the Metro Green Line at Norwalk, and <strong>to</strong> the<br />
Metro Blue Line at the 7 th Street/Metro Station at no additional charge. Shuttle<br />
service is provided at the Down<strong>to</strong>wn Burbank and Bob Hope Burbank Airport<br />
stations <strong>to</strong> the Burbank-Bob Hope Airport. LAUS also provides rail connection <strong>to</strong><br />
Amtrak long distance trains such as the Sunset Limited, Southwest Chief,<br />
Coast Starlight, and the San Joaquin route Amtrak trains via a thruway bus.<br />
Union Station also provides connections with various local and city bus and<br />
shuttle services, including service <strong>to</strong> Los Angeles International Airport.<br />
<strong>Plan</strong>ned light rail additions that will provide direct connections with Metrolink<br />
trains include the Metro East Side Line, the Metro Exposition Line, and the<br />
Metro Gold Line Foothill Extension.<br />
PERFORMANCE<br />
Figure 9D<br />
Figure 9D shows Metrolink’s<br />
ridership data on an annual basis<br />
from its start in 1992 through <strong>2005</strong>.<br />
Ridership has grown steadily <strong>to</strong><br />
10.2 million in <strong>2005</strong> as routes were<br />
added and service expanded.<br />
Metrolink Ridership<br />
Calendar Years 1992-<strong>2005</strong><br />
Year Ridership Year Ridership<br />
1992 <strong>16</strong>5,<strong>16</strong>4 1999 7,229,677<br />
1993 1,889,980 2000 8,<strong>06</strong>2,573<br />
1994 4,132,625 2001 8,522,555<br />
1995 4,645,561 2002 8,979,107<br />
1996 5,688,814 2003 9,099,985<br />
1997 6,314,368 2004 9,786,531<br />
1998 6,745,282 <strong>2005</strong> 10,245,609<br />
112
Chapter IX – Commuter <strong>Rail</strong> Services<br />
CAPITAL IMPROVEMENT PROGRAM<br />
Principal Metrolink capital improvements, with estimated costs, which are planned<br />
for the next ten years, include:<br />
Rolling S<strong>to</strong>ck Procurement - $<strong>16</strong>2.8 million<br />
This project would procure up <strong>to</strong> 46 additional rail cars, with options for up <strong>to</strong><br />
20 more. The specifications for the cab cars will include crash energy<br />
management <strong>to</strong> minimize the damage from a collision in passenger-occupied<br />
spaces.<br />
Sealed Corridor Study - $250,000<br />
This project will study safety improvements along the Antelope Valley and<br />
Ventura County Lines including improvements such as quad gates, median<br />
islands, longer gate arms, grade crossing closure, and gates <strong>to</strong> limit access <strong>to</strong> the<br />
rail ROW. Additional funding will be added <strong>to</strong> study the San Bernardino Line and<br />
the Perris Valley Line.<br />
Systemwide <strong>Rail</strong> Line Rehabilitation/Renovation Projects - $55.2 million<br />
These projects include track, signal and bridgework, tunnels, stations, drainage,<br />
engine and rolling s<strong>to</strong>ck overhaul and rehabilitation, and passenger information<br />
throughout the system.<br />
Eastern Area Maintenance Facility - $19.5 million<br />
This project consists of the completion of design and engineering, as well as the<br />
construction of an additional facility <strong>to</strong> provide maintenance on SCRRA<br />
equipment.<br />
Purchase and Rebuild Used Locomotives - $13.3 million<br />
This project provides for the purchase and complete overhaul of used locomotives,<br />
including their remanufacture with higher horsepower engines, current operating<br />
sub-systems, painting, and other work necessary <strong>to</strong> allow operation of longer<br />
trains.<br />
Lincoln Avenue Double-track - $12.6 million<br />
This is a multi-year project <strong>to</strong> install a second main line on the last segment of<br />
single main track between Fuller<strong>to</strong>n and Laguna Niguel, a 1.8-mile segment<br />
between Santa Ana and Orange.<br />
Fifth Lead Track at LAUS - $6.9 million<br />
The design phase of the project is complete and consisted of concept designs,<br />
property research and documentation, utility documentation, track and signal<br />
system design, and cost estimating for the fifth lead track. Construction will also<br />
include extensive signal installation and programming.<br />
113
<strong>2005</strong>-<strong>06</strong> – <strong>2015</strong>-<strong>16</strong> <strong>California</strong> <strong>State</strong> <strong>Rail</strong> <strong>Plan</strong><br />
Keller Street (Los Angeles) Rolling S<strong>to</strong>ck S<strong>to</strong>rage Facility - $5 million<br />
This project includes design and construction of the Keller Street S<strong>to</strong>rage Facility<br />
in Los Angeles needed for Metrolink rolling s<strong>to</strong>ck.<br />
Eliminate Mail Dock at LAUS - $3 million<br />
This project will res<strong>to</strong>re an unused track for passenger services by demolishing a<br />
mail dock, reconfiguring the skylight, and constructing a new passenger platform<br />
and connecting ramps.<br />
Upgrade Ticket Vending Machines - $2.8 million<br />
This project is nearing completion and will provide for the final installation of new<br />
and/or upgraded passenger rail ticket vending machines at Metrolink and Amtrak<br />
stations.<br />
PROPOSED SERVICE ENHANCEMENTS<br />
Perris Valley Extension<br />
The Riverside County Transportation Commission (RCTC) plans <strong>to</strong> request<br />
Federal Transit Administration (FTA) New Starts funds <strong>to</strong> extend the Metrolink<br />
91 Line <strong>to</strong> South Perris in Riverside County. The Metrolink 91 Line currently<br />
operates between down<strong>to</strong>wn Los Angeles and down<strong>to</strong>wn Riverside via Fuller<strong>to</strong>n<br />
and Corona. The extension would add approximately 21.3 miles <strong>to</strong> the route of<br />
the 91 Line and serve the University of <strong>California</strong> at Riverside, Moreno Valley,<br />
and the Perris area. The entire length of the line was purchased by RCTC in 1993.<br />
<strong>Rail</strong> service in this corridor is expected <strong>to</strong> begin in 2008 and would operate three<br />
trains from Perris <strong>to</strong> Riverside with continuing service <strong>to</strong> Los Angeles during the<br />
morning period. Two mid-day, off-peak trains would operate daily, one in each<br />
direction. In the afternoon peak period, three trains would operate from<br />
Los Angeles <strong>to</strong> Perris. Travel time would be 40 minutes. Headways would be<br />
50-60 minutes during the peak periods. Rolling s<strong>to</strong>ck would be additional bi-level<br />
commuter coaches acquired for the Metrolink fleet.<br />
Daily ridership is estimated at 4,151 by 2010 and up <strong>to</strong> 7,472 by 2025. Capital<br />
costs are estimated at $179 million and the annual operating and maintenance cost<br />
is estimated <strong>to</strong> be $6.1 million in 2010 and $8.4 million in 2025.<br />
Redlands Extension<br />
San Bernardino Associated Governments (SANBAG) purchased the Redlands<br />
Subdivision from the Santa Fe <strong>Rail</strong>way (now BNSF) in 1993. The Redlands rail<br />
service is currently being planned by SANBAG and service is anticipated <strong>to</strong> begin<br />
in <strong>2015</strong>. The proposed Redlands service entails two options: (1) Metrolink<br />
extension of service, and (2) Fixed <strong>Rail</strong> Transit.<br />
Option 1 – A proposed Metrolink extension of the San Bernardino Line from<br />
San Bernardino <strong>to</strong> Redlands (approximately 8.5 miles).<br />
114
Chapter IX – Commuter <strong>Rail</strong> Services<br />
Option 2 – Fixed rail vehicles would operate along the railroad ROW from<br />
University Street in Redlands <strong>to</strong> the existing San Bernardino Metrolink Station or<br />
alternatively, Metrolink service could be extended <strong>to</strong> a new station at E Street in<br />
down<strong>to</strong>wn San Bernardino and meet the new SANBAG service at this location.<br />
The vehicle type would be compliant passenger vehicle – Diesel Multiple Unit<br />
(DMU) – capable of operating with freight rail services and Metrolink type trains.<br />
Most of the existing track would be constructed <strong>to</strong> be double-tracked <strong>to</strong> allow for<br />
15-minute headways – all day. There may be sections that could be single-track in<br />
order <strong>to</strong> reduce initial capital costs but still maintain service quality.<br />
Daily ridership is projected at 7,104 for Option 1 and 11,000 for Option 2.<br />
The estimated capital cost is $156 million for Option 1 and $144 million for<br />
Option 2. The annual operating and maintenance cost is estimated <strong>to</strong> be about<br />
$71 million for either option.<br />
Santa Paula Branch Line<br />
Ventura County Transportation Commission (VCTC) acquired the Santa Paula<br />
Branch Line from the Southern Pacific <strong>Rail</strong>road in 1995. The 32-mile long rail<br />
line includes approximately 29 miles of existing track from Montalvo <strong>to</strong> Piru and<br />
3 miles of abandoned (removed) track between Piru and Rancho Camulos. At the<br />
western end of the line, there is a Metrolink layover facility and station at<br />
Montalvo. At the eastern end of the line, in the City of Santa Clarita is the Saugus<br />
Metrolink rail station, which serves the Santa Clarita Line.<br />
The City of Santa Clarita and the Newhall Land & Farming Company have<br />
expressed interest in reinstituting branch line service <strong>to</strong> connect <strong>to</strong> the Saugus<br />
station and Metrolink service.<br />
Currently, excursion services are operated between Fillmore and Santa Paula.<br />
The UP provides limited freight rail service on this corridor. VCTC recently<br />
initiated a study <strong>to</strong> investigate rail options on the Santa Paula Branch Line. There<br />
are also plans for a recreational trail in the ROW.<br />
Fuller<strong>to</strong>n-Laguna Niguel/Mission Viejo Service Enhancement<br />
The Orange County Transportation Authority (OCTA) decided at its Oc<strong>to</strong>ber 14,<br />
<strong>2005</strong> meeting <strong>to</strong> pursue increased Metrolink service frequencies between Fuller<strong>to</strong>n<br />
and Laguna Niguel/Mission Viejo. OCTA proposes <strong>to</strong> operate daily trains every<br />
20 <strong>to</strong> 30 minutes between 5 a.m. and midnight. Currently Metrolink provides<br />
mostly weekday peak-period service.<br />
115
<strong>2005</strong>-<strong>06</strong> – <strong>2015</strong>-<strong>16</strong> <strong>California</strong> <strong>State</strong> <strong>Rail</strong> <strong>Plan</strong><br />
Figure 9E<br />
1<strong>16</strong>
Chapter IX – Commuter <strong>Rail</strong> Services<br />
CALTRAIN COMMUTER RAIL SERVICE<br />
(SAN FRANCISCO-SAN JOSE-GILROY)<br />
PRINCIPAL <strong>2005</strong>-<strong>06</strong> <strong>to</strong> <strong>2015</strong>-<strong>16</strong> ROUTE OBJECTIVES<br />
• Evaluate and fine-tune the newly inaugurated Baby Bullet service.<br />
• Increase parking at stations impacted by initiation of Baby Bullet<br />
service.<br />
• Increase employer bus shuttles as demand grows.<br />
• Implement Translink regional ticketing system.<br />
• Reduce costs and gain productivity and performance through au<strong>to</strong>mated<br />
ticket purchasing and track and system capital improvements.<br />
• <strong>Plan</strong> and design service extensions <strong>to</strong> down<strong>to</strong>wn San Francisco, across<br />
the Dumbar<strong>to</strong>n Bridge, and <strong>to</strong> Salinas.<br />
• Complete Centralized Maintenance Facility.<br />
• Improve operations capacity at targeted stations and other route<br />
locations, including outside boarding platforms and additional<br />
crossovers.<br />
• Complete cus<strong>to</strong>mer service improvements, including improved station<br />
access and amenities at selected stations.<br />
• Improve ROW by designing various grade separations in<br />
San Mateo County, and rehabilitate bridges, culverts, tracks, and<br />
tunnels.<br />
• Prepare design plans, specifications, and estimates <strong>to</strong> electrify the route<br />
between San Francisco and Gilroy.<br />
• Implement Dumbar<strong>to</strong>n rail service extension.<br />
• Implement extension <strong>to</strong> Salinas.<br />
BACKGROUND<br />
The Caltrain commuter rail service (previously known as the Peninsula Commute<br />
Service) operates on one of the oldest railroad lines in <strong>California</strong>.<br />
The SP operated passenger rail service on the peninsula between San Francisco<br />
and San Jose from the 1860s until 1980 when SP decided <strong>to</strong> phase the service out.<br />
The Department and the counties of San Francisco, San Mateo, and Santa Clara<br />
reached a service agreement <strong>to</strong> preserve the passenger rail service.<br />
Between 1980 and July 1991, the Department’s District 4 administered a<br />
purchase-of-service agreement with SP <strong>to</strong> continue operating and partially funding<br />
the service in cooperation with local agencies. The Department’s responsibilities<br />
117
<strong>2005</strong>-<strong>06</strong> – <strong>2015</strong>-<strong>16</strong> <strong>California</strong> <strong>State</strong> <strong>Rail</strong> <strong>Plan</strong><br />
included planning, marketing, engineering and design, fare and schedule setting,<br />
performance moni<strong>to</strong>ring, and cus<strong>to</strong>mer service.<br />
In 1987, the commuter rail service was renamed “Caltrain” and the City and<br />
County of San Francisco, San Mateo County Transit District (SamTrans), and the<br />
Santa Clara County Transit Agency (now called VTA) formed the Peninsula<br />
Corridor Joint Powers Board (JPB) and transferred administrative responsibility of<br />
the Peninsula Commute Service from the <strong>State</strong> <strong>to</strong> the local level.<br />
In July 1992, the JPB <strong>to</strong>ok over the management of Caltrain from the <strong>State</strong> and<br />
contracted with Amtrak <strong>to</strong> operate the Caltrain commuter rail service. At the same<br />
time, SamTrams officially assumed the operation and administration of the JPB.<br />
Service in 1980 consisted of 22 weekday round-trip trains from San Francisco <strong>to</strong><br />
San Jose. Under JPB management, service has increased <strong>to</strong> 43 weekday roundtrips.<br />
An extension <strong>to</strong> Gilroy with two weekday round-trips was added in 1992,<br />
with service later expanded <strong>to</strong> four round-trips. Baby Bullet express service was<br />
added in 2004.<br />
ORGANIZATIONAL STRUCTURE<br />
The JPB currently includes representatives from San Francisco, San Mateo, and<br />
Santa Clara counties. The JPB consists of nine members and each county has<br />
three members on the board. The San Francisco members represent the mayor’s<br />
office, the San Francisco County Board of Supervisors and the San Francisco<br />
Municipal Transportation Agency. The San Mateo members represent SamTrans<br />
Board of Direc<strong>to</strong>rs and the Santa Clara members represent the VTA, and the cities<br />
of San Jose and Santa Clara. Staff from the San Mateo County Transit District<br />
provides administrative support <strong>to</strong> the JPB.<br />
The JPB contracts with Amtrak <strong>to</strong> operate service on the corridor between<br />
San Francisco and Gilroy. As part of this agreement, Amtrak is responsible for<br />
day-<strong>to</strong>-day operation and maintenance of the trains. The Caltrain commuter<br />
service is awarded on a competitive basis. SamTrans continues <strong>to</strong> operate and<br />
administer the service for the JPB.<br />
ROUTE AND SERVICE DESCRIPTION<br />
Caltrain operates seven days a week on 77 miles of track owned by the JPB from<br />
San Francisco and San Jose and by UP from San Jose <strong>to</strong> Gilroy, and serves<br />
20 cities with 34 stations between San Francisco, San Jose, and Gilroy in<br />
San Francisco, San Mateo, and Santa Clara counties. The system has a mixture of<br />
local, limited, and express trains and serves work centers in San Francisco,<br />
the Peninsula, and Silicon Valley including developing residential areas in<br />
southern Santa Clara County. Caltrain operates 96 trains on weekdays between<br />
San Francisco and San Jose. Of the 96 trains, 22 are Express trains (known as the<br />
Baby Bullet) that serve 12 stations. Forty-eight provide limited service <strong>to</strong> more<br />
stations than the express service, and 39 operate as local service. Scheduled<br />
118
Chapter IX – Commuter <strong>Rail</strong> Services<br />
weekday trains run on 30-minute headways at major stations and one-hour<br />
headways at minor stations. Also, on weekdays, six trains are extended <strong>to</strong> and<br />
from Gilroy.<br />
The system provides extensive weekend service, which consists of 32 trains on<br />
Saturday, and 28 on Sundays. The weekend trains provide local service between<br />
San Francisco and San Jose Diridon stations on one-hour headways.<br />
Buses provide a connection between Diridon and Tamien stations.<br />
FARE STRUCTURE<br />
Caltrain uses a six-zone fare structure based on distance traveled. Trips of longer<br />
distances are charged higher fares but at a lower cost per mile. Tickets, including<br />
one-way tickets, one-day passes, ten-ride tickets, and monthly passes, must be<br />
purchased in advance at staffed stations, from au<strong>to</strong>mated ticket vending machines<br />
located at station platforms, by mail, at selected employment sites throughout the<br />
Bay Area, or over the Internet. Seniors, the disabled, and youth may travel at half<br />
the fare for all types of tickets. Riders must show proof of their ticket when asked<br />
<strong>to</strong> do so during random spot checks by fare enforcement personnel.<br />
Caltrain monthly pass holders receive a local fare credit on SamTrans buses and<br />
on VTA buses and light rail vehicles. For SamTrans patrons, the pass must be two<br />
zones or greater <strong>to</strong> receive the credit. For VTA passengers, the monthly pass must<br />
be two zones or greater for adult and senior/disabled riders, three zones or greater<br />
for youth riders. A two-zone Caltrain monthly pass also is valid for a free transfer<br />
<strong>to</strong> the Dumbar<strong>to</strong>n Express bus. Caltrain cus<strong>to</strong>mers connecting with San Francisco<br />
Muni may purchase a discounted Muni Pass along with their Caltrain monthly<br />
pass <strong>to</strong> make the connection.<br />
Caltrain is currently participating in a program called TransLink, a universal fare<br />
smart card (a form of electronic cash card) with a microchip that s<strong>to</strong>res fare<br />
information. Riders can use the smart card <strong>to</strong> pay for fares on any public transit<br />
service in the Bay Area. When fully operational, it is expected that all Bay Area<br />
opera<strong>to</strong>rs will use TransLink. TransLink is expected <strong>to</strong> be ready for universal use<br />
on Caltrain in 20<strong>06</strong>.<br />
CONNECTING SERVICES<br />
Caltrain has a direct connection with other major opera<strong>to</strong>rs on its route. Many of<br />
Caltrain’s stations are multimodal and facilitate transfers between other transit<br />
opera<strong>to</strong>rs, including Muni, BART, SamTrans, VTA light rail and buses,<br />
AC Transit, the Dumbar<strong>to</strong>n Express bus, and ACE that provides commuter service<br />
from S<strong>to</strong>ck<strong>to</strong>n <strong>to</strong> San Jose. ACE shares stations with Caltrain at Santa Clara and<br />
San Jose Diridon stations.<br />
Caltrain connects directly with the intercity Capi<strong>to</strong>l Corridor and Amtrak’s longdistance<br />
Coast Starlight, at the San Jose Diridon Station. Amtrak San Joaquin and<br />
119
<strong>2005</strong>-<strong>06</strong> – <strong>2015</strong>-<strong>16</strong> <strong>California</strong> <strong>State</strong> <strong>Rail</strong> <strong>Plan</strong><br />
Capi<strong>to</strong>l Corridor route feeder bus s<strong>to</strong>ps are located at the Caltrain station in<br />
San Francisco.<br />
Local transit services link many Caltrain stations <strong>to</strong> local city destinations and<br />
employment centers where they can serve patrons more directly than the fixed<br />
route rail service. For example, the San Jose Diridon station serves eight VTA bus<br />
lines and Highway 17 Express bus service <strong>to</strong> Santa Cruz.<br />
In addition Caltrain operates about 33 shuttle routes connecting stations <strong>to</strong> major<br />
employment sites throughout the San Francisco peninsula. In 2004, the Caltrain<br />
shuttle service carried approximately 4,000 riders per weekday. Caltrain stations<br />
also are served by locally operated paratransit services.<br />
PERFORMANCE<br />
Figure 9F<br />
Figure 9F shows the annual ridership<br />
data from 1992 through <strong>2005</strong>.<br />
Ridership was 10.5 million in 2001<br />
but declined in 2002 and 2003 due <strong>to</strong><br />
employment reductions in the Silicon<br />
Valley as well as the temporary<br />
suspension of weekend service <strong>to</strong><br />
accommodate construction of<br />
additional track capacity for the Baby<br />
Bullet services. Caltrain ridership<br />
was 8.1 million in 2003. But in <strong>2005</strong>,<br />
with the new of the Baby Bullet and<br />
the return of weekend service,<br />
ridership was 9.9 million.<br />
Caltrain Ridership<br />
Calendar Years 1978-<strong>2005</strong><br />
Year Ridership Year Ridership<br />
1978 4,341,011 1992 6,833,290<br />
1979 5,699,4<strong>06</strong> 1993 6,889,941<br />
1980 6,122,890 1994 7,021,182<br />
1981 5,895,129 1995 7,143,091<br />
1982 5,195,819 1996 7,765,115<br />
1983 5,009,130 1997 8,367,683<br />
1984 5,232,527 1998 8,643,158<br />
1985 5,384,013 1999 8,990,864<br />
1986 5,4<strong>16</strong>,303 2000 10,267,000<br />
1987 5,540,630 2001 10,497,640<br />
1988 5,600,582 2002 8,978,675<br />
1989 5,790,712 2003 8,107,324<br />
1990 6,970,696 2004 8,768,157<br />
1991 7,111,365 <strong>2005</strong> 9,867,498<br />
PLANNED IMPROVEMENTS<br />
The following list of improvements is taken from the Caltrain Short Range Transit<br />
<strong>Plan</strong> 2004-2013:<br />
Caltrain Express Service – The JPB will continue <strong>to</strong> evaluate and fine-tune the<br />
Baby Bullet service. There will be an onboard survey and a special count <strong>to</strong> better<br />
understand the success of the new service. From the data, staff will make<br />
refinements in the service <strong>to</strong> better respond <strong>to</strong> cus<strong>to</strong>mer needs.<br />
120
Chapter IX – Commuter <strong>Rail</strong> Services<br />
Station Access – Baby-Bullet service substantially changed the travel patterns of<br />
existing and new Caltrain riders. Many cus<strong>to</strong>mers travel further from their homes<br />
<strong>to</strong> access an express station, especially the intermediary stations of<br />
Mountain View, Palo Al<strong>to</strong>, Hillsdale, and Millbrae. Common <strong>to</strong> all of these<br />
stations, except Millbrae, is the stress placed on parking access. Efforts are<br />
underway <strong>to</strong> increase parking supplies at these stations.<br />
Shuttle Service – During the downturn in the economy, several companies pulled<br />
out of the employer shuttle program. Prior <strong>to</strong> the “dotcom bust,” there were<br />
48 Caltrain shuttles. Currently there are 33 shuttle routes. Just recently, there has<br />
been moderate interest by former and new companies <strong>to</strong> participate in the shuttle<br />
program. Over the next few years, attention will be given <strong>to</strong> increase shuttles as<br />
demand grows.<br />
Fare Policy and Process – In 2003, the JPB approved massive changes in the<br />
Caltrain fare structure and fully implemented proof-of-payment. Proof-ofpayment<br />
allows train conduc<strong>to</strong>rs <strong>to</strong> focus on cus<strong>to</strong>mer service instead of ticketing<br />
activities since all ticket sales are performed before boarding. The next major<br />
improvement in the fare process is the introduction of TransLink,<br />
a universal fare instrument that will eventually be recognized by all Bay Area<br />
opera<strong>to</strong>rs. TransLink is expected <strong>to</strong> be available throughout the Caltrain system<br />
in 20<strong>06</strong>.<br />
Productivity – The JPB will be striving <strong>to</strong> make greater gains in performance<br />
over the next few years <strong>to</strong> help reduce cost. For example, as ticket purchases<br />
become more au<strong>to</strong>mated, train personnel will be able <strong>to</strong> perform other vital<br />
cus<strong>to</strong>mer functions. Also, as track and system capital improvements come on line,<br />
train and crew will become better utilized.<br />
Regional Extensions – Service via extensions <strong>to</strong> down<strong>to</strong>wn San Francisco, across<br />
the Dumbar<strong>to</strong>n Bridge, <strong>to</strong> Salinas/Monterey, or via High Speed <strong>Rail</strong> in <strong>California</strong><br />
is not included in this operations plan, although planning and design for these<br />
projects continue and are funded by third parties. Depending upon the availability<br />
of funding, some of the extensions may occur during the life of the Short Range<br />
Transit <strong>Plan</strong>.<br />
CAPITAL IMPROVEMENT PROGRAM<br />
The capital improvements in the Caltrain Short Range Transit <strong>Plan</strong> 2004-2013<br />
consist primarily of previously committed scheduled replacement and<br />
rehabilitation projects, station improvements, some capacity expansion<br />
enhancement projects, and construction of a centralized maintenance facility.<br />
These projects will improve OTP, reduce travel time, and improve cus<strong>to</strong>mer<br />
satisfaction and ridership in the corridor. Following are the projects that will<br />
provide the greatest service improvements and benefit <strong>to</strong> cus<strong>to</strong>mers.<br />
121
<strong>2005</strong>-<strong>06</strong> – <strong>2015</strong>-<strong>16</strong> <strong>California</strong> <strong>State</strong> <strong>Rail</strong> <strong>Plan</strong><br />
Centralized Maintenance Facility – A new Centralized Equipment Maintenance<br />
and Operations Facility is scheduled for completion in 20<strong>06</strong>. It will allow for<br />
maintenance of the Caltrain fleet <strong>to</strong> be performed at one location and with the<br />
most modern equipment, improving fleet reliability and performance with lower<br />
operating costs.<br />
Operational Capacity Improvements – Several stations will receive outside<br />
boarding platforms <strong>to</strong> allow two trains <strong>to</strong> operate at a station at the same time.<br />
Additional improvements include station center track fences, signalized pedestrian<br />
at-grade crossings, and new crossovers. These improvements will reduce travel<br />
times, increase train speeds, and improve service flexibility.<br />
Cus<strong>to</strong>mer Service Improvements – Improvements are planned in San Francisco<br />
and Hillsdale stations <strong>to</strong> provide better access and station amenities, audible signs,<br />
and upgrades <strong>to</strong> the public address systems.<br />
Right-of way Improvements – In San Mateo County, various grade separations<br />
are under design <strong>to</strong> improve safety by separating the railroad from vehicle and<br />
pedestrian flow. Other projects in San Mateo County include bridge, culvert,<br />
track, and tunnel rehabilitations.<br />
Electrification – The environmental process is nearly completed with preparation<br />
of design plans, specifications and estimates soon <strong>to</strong> follow for conversion of the<br />
existing diesel engine mode of propulsion <strong>to</strong> electric power from San Francisco <strong>to</strong><br />
Gilroy.<br />
PROPOSED SERVICE EXTENSIONS<br />
Down<strong>to</strong>wn San Francisco<br />
In 2001, the City and County of San Francisco in collaboration with other<br />
Bay Area transportation agencies agreed <strong>to</strong> build a new multimodal transportation<br />
terminal in San Francisco. The new center, <strong>to</strong> be located at the existing Transbay<br />
Terminal at First and Mission Streets in down<strong>to</strong>wn San Francisco, will be one of<br />
the largest multimodal transportation centers on the west coast. When completed,<br />
the terminal will allow a subsurface extension of Caltrain commuter service from<br />
its current location at Fourth and King Streets <strong>to</strong> Down<strong>to</strong>wn San Francisco.<br />
The new center will also serve AC Transit, Golden Gate Transit, SamTrans,<br />
Greyhound, Amtrak feeder buses, Muni buses and light rail, and BART.<br />
Dumbar<strong>to</strong>n <strong>Rail</strong> Corridor<br />
The former SP discontinued rail service in the 1980s on the 20.5-mile Dumbar<strong>to</strong>n<br />
<strong>Rail</strong> Corridor between Redwood Junction and Newark Junction. A 1991<br />
San Mateo County Transportation Authority (SMCTA) long range study <strong>to</strong><br />
determine the feasibility of operating commuter rail service in the corridor<br />
recommended a rail service option. As a result, the SamTrans purchased the<br />
ROW in early 1994. Funds were programmed for the Dumbar<strong>to</strong>n <strong>Rail</strong> Corridor in<br />
122
Chapter IX – Commuter <strong>Rail</strong> Services<br />
the MTC’s Regional Transportation <strong>Plan</strong>, and a project study report on the rail<br />
corridor was completed in February 2004.<br />
The Dumbar<strong>to</strong>n Commuter <strong>Rail</strong> service will initiate new cross-bay commuter rail<br />
service between the Peninsula and the East Bay. The project will involve<br />
rehabilitating and reconstructing rail facilities on the existing railroad alignment<br />
and ROW. The new service is planned <strong>to</strong> start in 2010, providing three roundtrips<br />
between Union City and San Francisco and three round-trips between Union<br />
City and San Jose. Other service variations include trains originating in<br />
Livermore and Union City, with higher service levels projected for the future.<br />
The new rail corridor will link Caltrain, ACE, the Capi<strong>to</strong>l Corridor, and BART.<br />
It will also connect with East Bay bus systems at the multimodal transit center in<br />
Union City.<br />
Daily ridership is estimated at 4,800 in 2,010 and 6,900 by 2025. Capital costs are<br />
estimated at $300 million, including new rolling s<strong>to</strong>ck, with annual operating and<br />
maintenance costs of $8 million.<br />
Salinas Extension<br />
The Caltrain Extension <strong>to</strong> Monterey County project, which is sponsored by the<br />
Transportation Agency for Monterey County (TAMC), proposes <strong>to</strong> extend the<br />
existing San Francisco <strong>to</strong> Gilroy service <strong>to</strong> Salinas with s<strong>to</strong>ps in Pajaro and<br />
Castroville. TAMC has conducted a number of studies on train service options<br />
between San Francisco and Salinas/Monterey. The 2000 Extension of Caltrain<br />
Commuter Service <strong>to</strong> Monterey County Business <strong>Plan</strong> found that transportation<br />
alternatives are needed in Monterey County <strong>to</strong> improve commuter and healthcare<br />
access <strong>to</strong> the San Francisco Bay Area and <strong>to</strong> relieve congestion on the county’s<br />
interregional highway connections. Currently, residents of Monterey County who<br />
work in Santa Clara County must use private vehicles <strong>to</strong> travel between home and<br />
work. The Commuter <strong>Rail</strong> Extension <strong>to</strong> Monterey County Project Study Report is<br />
near completion, and a Draft Environmental Impact Report/ Environmental<br />
Assessment (DEIR/EA) is due out in spring 20<strong>06</strong>.<br />
The proposed route would use the current Caltrain-owned ROW between<br />
San Francisco and San Jose. The route between San Jose and Salinas is owned by<br />
UP and used for passenger service by Caltrain <strong>to</strong> Gilroy and by the Amtrak<br />
Coast Starlight <strong>to</strong> Salinas and beyond <strong>to</strong> Los Angeles. The initial service is<br />
proposed <strong>to</strong> start in 2009 with two round-trips per weekday, expanding <strong>to</strong> four<br />
within ten years, or as demand warrants.<br />
Annual ridership is estimated at about 525,000. Capital costs are estimated at<br />
$75 million, with annual operating and maintenance costs starting at $1.5 million<br />
and declining <strong>to</strong> $1.0 million after three years.<br />
123
<strong>2005</strong>-<strong>06</strong> – <strong>2015</strong>-<strong>16</strong> <strong>California</strong> <strong>State</strong> <strong>Rail</strong> <strong>Plan</strong><br />
ACE COMMUTER RAIL SERVICE<br />
(STOCKTON-SAN JOSE)<br />
PRINCIPAL <strong>2005</strong>-<strong>06</strong> <strong>to</strong> <strong>2015</strong>-<strong>16</strong> ROUTE OBJECTIVES<br />
• Continue service improvements.<br />
• Improve on-time performance.<br />
• Increase ridership on existing routes.<br />
• Improve service coordination with other service providers such as<br />
BART, Caltrain, Capital Corridor, and shuttle service providers.<br />
• Acquire ROW, perform engineering work, and begin construction of rail<br />
maintenance and layover facility in San Joaquin County.<br />
• Purchase passenger rail cars and locomotive for fourth train.<br />
• Upgrade signal system between S<strong>to</strong>ck<strong>to</strong>n and Fremont.<br />
• Replace ties between Niles Junction and Santa Clara.<br />
• Upgrade diamond at Lyoth and replace switch at Hunter Street.<br />
• Upgrade passenger cars and locomotives.<br />
• Evaluate potential extensions and new services in the Central Valley.<br />
BACKGROUND<br />
In 1989, the San Joaquin Council of Governments, the S<strong>to</strong>ck<strong>to</strong>n Chamber of<br />
Commerce and the Building Industry Association of the Delta began the<br />
development of a 20-year transportation plan for a future sales tax vote in<br />
San Joaquin County. Measure K, the half-cent sales tax for transportation, was<br />
strongly supported by voters in 1990, and the number one project identified for<br />
funding was Altamont passenger rail service. In 1995, the seven cities and<br />
San Joaquin County formed a joint powers agreement that created the San Joaquin<br />
Regional <strong>Rail</strong> Commission (SJRRC) <strong>to</strong> implement the rail plan and <strong>to</strong> explore<br />
agreements with the counties of Santa Clara and Alameda. This created a<br />
five-member board of direc<strong>to</strong>rs appointed by the San Joaquin Council of<br />
Governments. San Joaquin County has contributed over $40 million in Measure K<br />
funding for Altamont Commuter Express (ACE) rail service.<br />
In May 1997, SJRRC, the Alameda County Congestion Management Agency<br />
(ACCMA), and VTA executed an agreement <strong>to</strong> create the Altamont Commuter<br />
Express Joint Powers Authority (JPA). The JPA agreement identified the SJRRC<br />
as the managing agency for the ACE service, overseeing the day-<strong>to</strong>-day<br />
management, planning, and support services necessary <strong>to</strong> operate the trains.<br />
The SJRRC issued a contract for operations and maintenance of equipment <strong>to</strong><br />
Herzog Transit Services, Inc., and service began on Oc<strong>to</strong>ber 19, 1998.<br />
Initially there were two westbound morning trains and two eastbound evening<br />
124
Chapter IX – Commuter <strong>Rail</strong> Services<br />
trains. In March 2001 a third train was inaugurated which gave ACE passengers<br />
later departure options and eased overcrowding.<br />
Funding for the operation and management of the ACE service is provided by<br />
passenger fares, San Joaquin County Congestion Mitigation and Air Quality<br />
(CMAQ) Federal grant funds, Measure K, Transportation Development Act<br />
(TDA) funds, Federal and <strong>State</strong> grants, and operating support from the three<br />
member agencies. Each member agency's annual share is based on the percentage<br />
of <strong>to</strong>tal ACE daily boardings and alightings that occur in each county.<br />
Cost sharing for capital projects, excluding stations, during the initial 36 months of<br />
service was determined by the JPA on a case-by-case basis and approved by each<br />
of the member agencies. Station improvements are the responsibility of the<br />
member agency for the county in which the station is located.<br />
ORGANIZATIONAL STRUCTURE<br />
The SJRRC is a Joint Powers Authority consisting of the County of San Joaquin<br />
and the cities of Escalon, Lathrop, Lodi, Manteca, Ripon, S<strong>to</strong>ck<strong>to</strong>n, and Tracy.<br />
The commission is governed by a Board of Direc<strong>to</strong>rs which consists of six elected<br />
officials appointed by the San Joaquin Council of Governments from nominations<br />
by local agencies, and is supplemented by two elected officials appointed by the<br />
ACCMA <strong>to</strong> address rail service issues affecting Alameda County. Ex-officio<br />
members represent Caltrans, the San Joaquin Regional Transit District, and the<br />
San Joaquin Council of Governments.<br />
In July 2003, the SJRRC became the designated owner, opera<strong>to</strong>r and policymaking<br />
body of the ACE service in accordance with the Cooperative Service<br />
Agreement between the SJRRC, the ACCMA, and VTA, which superseded and<br />
rescinded the prior 1997 agreement. As the designated owner of the ACE service,<br />
the SJRRC <strong>to</strong>ok title <strong>to</strong> all of the assets and assumed the liabilities that were<br />
previously under ownership of the ACE Joint Powers Authority, which was<br />
dissolved.<br />
The purpose of the Cooperative Services Agreement is <strong>to</strong> improve and expand the<br />
ACE service and protect the interests of the three counties along the corridor.<br />
As part of this agreement, the SJRRC is required <strong>to</strong> provide a baseline three-train<br />
service <strong>to</strong> Santa Clara and Alameda Counties in return for a “capped”<br />
contribution.<br />
ROUTE AND SERVICE DESCRIPTION<br />
ACE operates Monday through Friday over 85 miles of track, providing three<br />
round-trips between S<strong>to</strong>ck<strong>to</strong>n and San Jose during morning and evening peak<br />
periods. The running time between S<strong>to</strong>ck<strong>to</strong>n and San Jose is approximately<br />
2 hours-18 minutes.<br />
125
<strong>2005</strong>-<strong>06</strong> – <strong>2015</strong>-<strong>16</strong> <strong>California</strong> <strong>State</strong> <strong>Rail</strong> <strong>Plan</strong><br />
ACE serves these stations: S<strong>to</strong>ck<strong>to</strong>n, Lathrop/Manteca, Tracy, Vasco, Livermore,<br />
Pleasan<strong>to</strong>n, Fremont, Great America, Santa Clara, and San Jose. Free parking is<br />
available at all stations, except at the Santa Clara and San Jose stations where<br />
there is a daily fee of $1.50.<br />
FARE STRUCTURE<br />
The ACE has five fare zones based on distance traveled. The system has a proofof-payment<br />
system where riders must show proof of ticket purchase when asked <strong>to</strong><br />
do so. Ticket types are one-way, round-trip, weekly, 20-ride, and monthly passes.<br />
The ACE is working with the CCJPA on a pilot program <strong>to</strong> integrate service ideas<br />
and amenities common <strong>to</strong> both systems <strong>to</strong> control costs and benefit passengers on<br />
both corridors. These efforts include a common global positioning system (GPS),<br />
joint au<strong>to</strong>mated ticketing, public address (PA) announcements, and electronic fare<br />
media at shared stations.<br />
CONNECTING SERVICES<br />
Bus and rail transit connections and dedicated shuttles are an integral part of the<br />
ACE system, providing a seamless commuting link between stations and riders’<br />
workplaces. All stations with the exception of the Tracy station have some form<br />
of connecting transit. In addition, three stations have direct connections <strong>to</strong> rail<br />
services. The S<strong>to</strong>ck<strong>to</strong>n station has connections <strong>to</strong> the San Joaquin Route trains.<br />
The Santa Clara-Great America station connects with Caltrain and the Capi<strong>to</strong>l<br />
Corridor. At San Jose, connections are made with Caltrain, the Capi<strong>to</strong>l Corridor,<br />
and the Amtrak long distance Coast Starlight.<br />
PERFORMANCE<br />
Figure 9G<br />
In <strong>2005</strong> calendar year, ACE ridership<br />
was over 667,000. ACE is improving<br />
marketing outreach <strong>to</strong> increase<br />
ridership. Passenger fares in 2004<br />
approximated $3.5 million.<br />
ACE’s OTP in 2004 averaged<br />
83 percent. This is a decrease from<br />
previous years and is due <strong>to</strong> weather<br />
conditions and increased UP freight<br />
traffic on the railroad line used by<br />
ACE.<br />
Figure 9G shows ACE’s annual<br />
ridership from 1998 through <strong>2005</strong>.<br />
ACE Ridership<br />
Calendar Years 1998-<strong>2005</strong><br />
Year Ridership Year Ridership<br />
1998 67,222 2002 803,522<br />
1999 424,988 2003 607,017<br />
2000 714,259 2004 640,753<br />
2001 922,976 <strong>2005</strong> 667,029<br />
126
Chapter IX – Commuter <strong>Rail</strong> Services<br />
PLANNED IMPROVEMENTS<br />
ACE service will continue with three round-trip trains in the morning and evening<br />
commute windows. ACE will continue <strong>to</strong> focus on improving OTP and train<br />
speeds, expanding options for communicating train status <strong>to</strong> passengers, providing<br />
more opportunities for passengers <strong>to</strong> participate in the ACE planning process, and<br />
implementing new schedules as necessary <strong>to</strong> improve coordination and<br />
performance. ACE will invest in infrastructure projects that will allow for higher<br />
track speeds or improved reliability. A pilot program of on board ticket vending<br />
machines <strong>to</strong> allow on board collection of fares is being planned. Efforts are<br />
underway <strong>to</strong> implement a fourth train.<br />
CAPITAL IMPROVEMENT PROGRAM<br />
The ACE <strong>2005</strong>/<strong>06</strong> capital improvement program <strong>to</strong>tals $31.3 million.<br />
Principal projects include:<br />
<strong>Rail</strong> Maintenance and Layover Facility in San Joaquin County - $8.2 million<br />
This is a multi-year project with funds for ROW acquisition, engineering, and partial<br />
Phase I construction.<br />
Passenger <strong>Rail</strong> Cars and Locomotive - $9.9 million<br />
This is a multi-year project with only funds for FY <strong>2005</strong>-<strong>06</strong> identified.<br />
The purchase of 12 <strong>to</strong> 18 new rail cars and four locomotives will provide<br />
equipment for the fourth train. While this train is not scheduled <strong>to</strong> begin service<br />
until the existing train service reaches 85 percent capacity, there is 18 <strong>to</strong> 24<br />
months lead time for the rolling s<strong>to</strong>ck <strong>to</strong> be constructed.<br />
Signal Upgrade Project (S<strong>to</strong>ck<strong>to</strong>n <strong>to</strong> Fremont) - $6.0 million<br />
This is a multi-year project, which began in FY 2004-05, <strong>to</strong> upgrade the signal<br />
system between S<strong>to</strong>ck<strong>to</strong>n and Fremont and improve service reliability. The <strong>to</strong>tal<br />
estimated project cost is $11.5 million, and funds identified are for work <strong>to</strong> be<br />
completed in FY <strong>2005</strong>/<strong>06</strong>.<br />
Major Tie Replacement Program - $2.3 million<br />
This project is jointly funded by ACE, the CCJPA, and the UP. The <strong>to</strong>tal cost is<br />
estimated at $7 million, with each entity funding one third. The project is between<br />
Niles Junction and Santa Clara.<br />
Track Upgrade - $0.7 million<br />
This project includes upgrade of the diamond at Lyoth and replacement of the switch<br />
at Hunter Street.<br />
Capital Spares/Upgrades for Passenger Cars and Locomotives - $0.5 million<br />
This project includes new seat cushions for the original eight passenger cars, two<br />
new air conditioning units and the overhaul of 18 more units, locomotive and<br />
passenger car wheels, and two locomotive traction mo<strong>to</strong>rs.<br />
127
<strong>2005</strong>-<strong>06</strong> – <strong>2015</strong>-<strong>16</strong> <strong>California</strong> <strong>State</strong> <strong>Rail</strong> <strong>Plan</strong><br />
PROPOSED SERVICE EXTENSIONS<br />
The SJRRC is beginning a study on potential extensions and new services in the<br />
Central Valley. At the SJRRC Board <strong>Plan</strong>ning Workshop held on May 5, <strong>2005</strong>,<br />
a number of corridors and extensions of the ACE service were identified for study,<br />
such as a direct connection <strong>to</strong> BART in the Livermore Valley, Merced <strong>to</strong><br />
Sacramen<strong>to</strong> commuter service, commuter service <strong>to</strong> the East Bay via the BNSF<br />
alignment from S<strong>to</strong>ck<strong>to</strong>n <strong>to</strong> Oakland, the Westside line from Los Banos <strong>to</strong> Tracy,<br />
and coordination with BART in their proposed E-BART service.<br />
PROPOSED COMMUTER RAIL SERVICES<br />
Three potential new commuter rail services are being proposed. They are<br />
discussed below.<br />
VENTURA AND SANTA BARBARA COMMUTER RAIL SERVICE<br />
There is interest in expanding commuter rail service in Ventura and Santa Barbara<br />
Counties. Currently, Metrolink operates the Ventura County line between<br />
Los Angeles and Montalvo and the Pacific Surfliner operates five daily roundtrips<br />
from Los Angeles <strong>to</strong> Goleta, with two trips continuing <strong>to</strong> San Luis Obispo.<br />
Thus, commuter and intercity rail service now serves Ventura County and intercity<br />
rail service serves Santa Barbara County.<br />
The Department has expanded its LOSSAN North Strategic <strong>Plan</strong> <strong>to</strong> study the<br />
potential for commuter rail service in Ventura and Santa Barbara Counties.<br />
(See the “Corridor Strategic <strong>Plan</strong>ning” section in Chapter II for further<br />
information on the Strategic <strong>Plan</strong>.) The study will be completed by April 20<strong>06</strong>.<br />
The study will look at alternatives including additional Amtrak intercity rail<br />
service and commuter rail service utilizing existing equipment types or DMU<br />
technology. For each alternative, the study will develop an operational analysis<br />
including: service scenarios, equipment needs, as well as estimates for ridership,<br />
revenues, operating and maintenance costs, and operating deficit. <strong>Rail</strong> capacity<br />
analysis will be done as part of the study.<br />
SONOMA MARIN-AREA RAIL TRANSIT<br />
The purpose of the Sonoma Marin Area <strong>Rail</strong> Transit District (SMART) is <strong>to</strong><br />
provide passenger rail passenger service <strong>to</strong> Sonoma and Marin County residents<br />
along the Northwestern Pacific (NWP) rail corridor. The NWP generally parallels<br />
Highway 101 and is located in Sonoma and Marin counties, north of<br />
San Francisco. AB 2224 (2002) authorized the creation of the SMART <strong>Rail</strong><br />
District. The legislation designated SMART as the owner of the NWP corridor<br />
from Healdsburg <strong>to</strong> Corte Madera, and as the opera<strong>to</strong>r for passenger rail service.<br />
Passenger rail service on the line was provided as late as 1958, with service <strong>to</strong><br />
San Rafael. Public acquisition of the line began in the 1970's and was completed<br />
in the mid-1990's. Numerous transportation planning studies, dating back <strong>to</strong> the<br />
128
Chapter IX – Commuter <strong>Rail</strong> Services<br />
1980's have recommended the utilization of the NWP for passenger rail service.<br />
Prior <strong>to</strong> the formation of the SMART <strong>Rail</strong> District, the project was planned by the<br />
joint county SMART Commission, which was replaced by the SMART District<br />
Board of Direc<strong>to</strong>rs in 2003.<br />
The SMART Commission sponsored the Sonoma Marin Transportation and Land<br />
Use Study, in 1995, which recommended specific station locations and rail line<br />
termini. In 2001, the Commission oversaw the Commuter <strong>Rail</strong> Implementation<br />
<strong>Plan</strong>, which recommended 30-minute service along the line. Work <strong>to</strong> refine that<br />
<strong>Plan</strong> and produce environmental clearance for the project was initiated in 2001.<br />
Consultant contracts <strong>to</strong> develop rail systems planning work (2001), environmental<br />
analysis (2003), community outreach (2002), and station planning (2003) are<br />
on-going. The Draft Environmental Impact Report is expected in fall, <strong>2005</strong>.<br />
Current implementation plans include service start up in 2009-10 along a 70-mile<br />
corridor with service from Cloverdale <strong>to</strong> the existing Larkspur ferry terminal.<br />
Fourteen stations are planned: nine in Sonoma County and five in Marin County.<br />
Service assumptions include 30-minute peak period headways and twelve trains<br />
per day. Initial ridership is estimated at about 5,000 per day. DMU rail vehicles<br />
are currently being evaluated for use along the corridor.<br />
The SMART estimates capital costs (in 2004 dollars) <strong>to</strong> upgrade tracks, build<br />
stations and a maintenance facility, and purchase vehicles at $340 million for the<br />
full 70-mile corridor. Projected operating costs are $10-12 million per year.<br />
Approximately $120 million in local, <strong>State</strong> and Federal funding has been set aside<br />
for the project. The remaining funding for the project, including on-going<br />
operating funds, would come from a district wide one-quarter-cent sales tax<br />
measure. It is anticipated that measure will be placed on the ballot in<br />
November 20<strong>06</strong>.<br />
AUBURN-OAKLAND REGIONAL RAIL SERVICE<br />
Six agencies have partnered <strong>to</strong> develop a service concept plan for a new regional<br />
commuter rail service in the urban corridor extending from Auburn (Bowman) <strong>to</strong><br />
Oakland. The agencies are: the CCJPA, Contra Costa Transportation Authority,<br />
Solano Transportation Authority, Yolo County Transportation District,<br />
Sacramen<strong>to</strong> Regional Transit District, and Placer County Transportation <strong>Plan</strong>ning<br />
Agency. The UP, the Sacramen<strong>to</strong> Area Council of Governments, and the<br />
Department also participated in the study that was originated in 2002. The new<br />
service would augment existing Capi<strong>to</strong>l Corridor intercity service by providing<br />
additional peak period capacity for within the greater Sacramen<strong>to</strong> urban area and<br />
between Auburn and the Bay Area. The two services would utilize the same<br />
equipment, staff, and fare structure, and thus would appear fully unified <strong>to</strong> the<br />
riding public.<br />
129
<strong>2005</strong>-<strong>06</strong> – <strong>2015</strong>-<strong>16</strong> <strong>California</strong> <strong>State</strong> <strong>Rail</strong> <strong>Plan</strong><br />
The Auburn-Oakland Regional <strong>Rail</strong> Service Concept <strong>Plan</strong> (<strong>Plan</strong>) was released in<br />
June <strong>2005</strong>. The <strong>Plan</strong> was endorsed by the group’s steering committee in<br />
September <strong>2005</strong>. This <strong>Plan</strong> contains a near-term and a long-term implementation<br />
action plan. However, at this time the UP will not participate in any further<br />
capacity modeling for potential new passenger rail services due <strong>to</strong> major freight<br />
congestion problems the railroad is experiencing within this and other corridors.<br />
The <strong>Plan</strong> includes three-phases, with a first phase in 2010, planned <strong>to</strong> add four<br />
new Sacramen<strong>to</strong>-Oakland round-trips. The second phase planned for <strong>2015</strong>, would<br />
include four new Sacramen<strong>to</strong>-Auburn round-trips and one additional Oakland <strong>to</strong><br />
Sacramen<strong>to</strong> round-trip. When mixed with Capi<strong>to</strong>l Corridor trains, 30-minute<br />
intervals (headways) would be provided during peak periods in both directions.<br />
The third phase, planned for 2020 would add new stations, primarily in the<br />
Sacramen<strong>to</strong> metropolitan area. Daily ridership of 6,900 is projected by<br />
implementation of the third phase.<br />
Auburn-Oakland Regional <strong>Rail</strong> would initially serve all existing stations along the<br />
Capi<strong>to</strong>l Corridor: Auburn, Rocklin, Roseville, Sacramen<strong>to</strong>, Davis,<br />
Suisun/Fairfield, Martinez, Richmond, Berkeley, Emeryville, and Oakland.<br />
Additional station s<strong>to</strong>ps would be phased in at Bowman (5 miles north of Auburn),<br />
Antelope, Swans<strong>to</strong>n, West Sacramen<strong>to</strong>, Dixon, Fairfield/Vacaville, Benicia, and<br />
Hercules for a <strong>to</strong>tal of 19 stations.<br />
The <strong>Plan</strong> projects the <strong>to</strong>tal cost of operating and maintaining the Regional <strong>Rail</strong><br />
service <strong>to</strong> be approximately $15.5 million annually, including fees paid <strong>to</strong> the UP<br />
and Amtrak, vehicle and station maintenance, and administrative expenses. The<br />
capital requirements, including new rolling s<strong>to</strong>ck, track work and signals, stations<br />
and parking, and maintenance facility and other system wide improvements, are<br />
estimated <strong>to</strong> cost $380 million. The <strong>Plan</strong> anticipates that the funding for Regional<br />
<strong>Rail</strong> will come from a mix of sources including Federal New Starts funds, CMAQ<br />
or RSTP, <strong>State</strong> discretionary funds, the Capi<strong>to</strong>l Corridor, and other local funds.<br />
The project is authorized in SAFETEA-LU, under the New Starts Program for<br />
Alternatives Analysis/Preliminary Engineering.<br />
130
131<br />
Chapter IX – Commuter <strong>Rail</strong> Services
<strong>2005</strong>-<strong>06</strong> – <strong>2015</strong>-<strong>16</strong> <strong>California</strong> <strong>State</strong> <strong>Rail</strong> <strong>Plan</strong><br />
Figure 10A<br />
132
Chapter X – Potential New Services<br />
CHAPTER X<br />
POTENTIAL NEW SERVICES<br />
This Chapter contains a discussion on six potential intercity passenger rail routes,<br />
four of them proposed by the Department for service in the ten-year period.<br />
Figure 10A displays the six potential intercity passenger rail routes. Also, highspeed<br />
rail and magnetic levitation projects in <strong>California</strong> are discussed. Chapter IX<br />
discusses proposed extensions of existing commuter rail services as well as<br />
proposed new commuter rail services.<br />
PROPOSED INTERCITY RAIL ROUTES<br />
This section includes a description of the four new routes that the Department<br />
proposes for service in this ten-year plan. The routes are discussed in order of<br />
potential implementation by year: San Francisco <strong>to</strong> San Luis Obispo (and<br />
Los Angeles); Sacramen<strong>to</strong> <strong>to</strong> Reno; Sacramen<strong>to</strong> <strong>to</strong> Redding; and Los Angeles <strong>to</strong><br />
Indio. Included for each route is a summary of current service <strong>to</strong> the area, recent<br />
studies of the route, and the Department’s current service proposal.<br />
The implementation of all new service is subject <strong>to</strong> demonstrated ridership<br />
demand, approval from Amtrak and the relevant railroad(s), availability of<br />
operating and capital funding and equipment, and completion of necessary capital<br />
projects.<br />
SAN FRANCISCO TO SAN LUIS OBISPO (AND LOS ANGELES) VIA<br />
COAST ROUTE<br />
The extension of the Pacific Surfliners from San Luis Obispo <strong>to</strong> San Francisco<br />
would close a key gap in the <strong>State</strong>-supported intercity rail system by providing<br />
direct train service from San Francisco <strong>to</strong> Los Angeles. Regional transportation<br />
planning agencies have led the planning for this extension and will continue <strong>to</strong><br />
provide an important role in the planning and operation of this extension.<br />
Background<br />
Currently only one daily round-trip Coast Starlight train connects Oakland and<br />
San Jose with Los Angeles via the Coast with intermediate s<strong>to</strong>ps including<br />
Salinas, Paso Robles, San Luis Obispo, and Santa Barbara on its route from<br />
Seattle. Also a round-trip Amtrak Thruway bus from San Luis Obispo <strong>to</strong><br />
San Francisco started on November 17, 2004 with the inauguration of the second<br />
Los Angeles-San Luis Obispo Pacific Surfliner. Ridership on this entire bus route<br />
was over 18,000 in 2004-05. Additionally, one round-trip Amtrak Thruway bus<br />
from San Jose <strong>to</strong> Santa Barbara connects the Capi<strong>to</strong>l Corridor <strong>to</strong> Santa Barbara.<br />
Ridership on this bus route was 12,000 in 2004-05.<br />
133
<strong>2005</strong>-<strong>06</strong> – <strong>2015</strong>-<strong>16</strong> <strong>California</strong> <strong>State</strong> <strong>Rail</strong> <strong>Plan</strong><br />
There has been interest for many years in providing additional Coast Route service<br />
<strong>to</strong> better link <strong>California</strong>’s two largest metropolitan areas. In 1992, H.R. 39 was<br />
passed requesting a Coast Corridor intercity rail corridor upgrade study be<br />
conducted by the regional transportation planning agencies along the Corridor in<br />
cooperation with the Department. As a result, concerned local agencies formed<br />
the Coast <strong>Rail</strong> Coordinating Council (CRCC) that is staffed by the San Luis<br />
Obispo Council of Governments. The Coast <strong>Rail</strong> Improvement Study issued in<br />
the fall of 1994 resulted from H.R. 39. Then in 1996, the Coast Route<br />
Infrastructure Assessment Report was completed. One of the main goals of the<br />
CRCC is <strong>to</strong> “close the gap” in <strong>State</strong>-supported train services by connecting<br />
down<strong>to</strong>wn Los Angeles and down<strong>to</strong>wn San Francisco with daily train services.<br />
In 2000, the CCRC issued a Coast Daylight Implementation <strong>Plan</strong> that envisions<br />
daily service operating on Caltrain tracks from San Francisco <strong>to</strong> San Jose, and then<br />
on UP tracks <strong>to</strong> Moorpark, and then on Metrolink tracks <strong>to</strong> Los Angeles. Stations<br />
are planned in San Francisco, Millbrae, Palo Al<strong>to</strong>, Mountain View, Santa Clara,<br />
San Jose, Gilroy, Pajaro, Salinas, King City, Paso Robles, San Luis Obispo, and<br />
south <strong>to</strong> Los Angeles s<strong>to</strong>pping at existing Pacific Surfliner stations. The study<br />
includes operating costs, but no capital costs.<br />
In fall 2004, the CRCC released the Capacity Analysis for this service.<br />
The analysis identified several capital improvements that would be helpful in<br />
order <strong>to</strong> increase train frequencies on the Coast Route. The CRCC is now working<br />
with Amtrak, UP, and the Department <strong>to</strong> identify how <strong>to</strong> move forward since<br />
capital funding for the improvements is extremely limited. Additionally, at this<br />
time, the UP is not considering new passenger routes due <strong>to</strong> an increase in freight<br />
traffic and their need <strong>to</strong> accommodate this demand.<br />
Operating <strong>Plan</strong><br />
The Department’s ten-year operating plan includes one round-trip train between<br />
San Francisco and San Luis Obispo, starting in 2007-08, with a second train in<br />
2013-14. The first train would be operated from San Luis Obispo <strong>to</strong> Los Angeles<br />
as an extension of the new Pacific Surfliner train added in November 2004, and<br />
would provide through train service between San Francisco and Los Angeles.<br />
The second train would operate as an extension of the planned third Los Angeles-<br />
San Luis Obispo round-trip. Direct train connections <strong>to</strong> San Diego at Los Angeles<br />
would be available on most trips.<br />
The Department believes this extension is a good candidate for rail service<br />
because:<br />
• It would be the only <strong>State</strong>-supported route <strong>to</strong> provide direct train service<br />
between the two major population centers of the <strong>State</strong>, thus closing a key<br />
gap in the system.<br />
134
Chapter X – Potential New Services<br />
• There is strong ridership on the one daily Coast Starlight round-trip and on<br />
the three daily Amtrak Thruway buses.<br />
• An existing local organization –the CRCC, is actively planning the service,<br />
and implementation plans have been completed.<br />
SACRAMENTO TO RENO<br />
The extension of intercity rail service from Sacramen<strong>to</strong> <strong>to</strong> Reno would bring <strong>State</strong>supported<br />
rail service <strong>to</strong> the Truckee/Tahoe and Reno/Sparks <strong>to</strong>urist areas as well<br />
as provide relief <strong>to</strong> the highly congested I-80 –Bay Area <strong>to</strong> Reno corridor.<br />
Background<br />
Amtrak’s <strong>California</strong> Zephyr and connecting buses <strong>to</strong> the Capi<strong>to</strong>l Corridor and<br />
San Joaquins serve Reno and intermediate I-80 Corridor points.<br />
The <strong>California</strong> Zephyr makes s<strong>to</strong>ps at Reno, Truckee, Colfax, Roseville, and<br />
Sacramen<strong>to</strong> once daily in each direction on its route <strong>to</strong> Chicago. Also, Amtrak<br />
buses connect <strong>to</strong> three San Joaquins and four Capi<strong>to</strong>l Corridor trains and serve<br />
Reno/Sparks, Truckee, Soda Springs, Colfax, Auburn, Rocklin, Roseville, and<br />
Sacramen<strong>to</strong>. Ridership on this bus route was 37,000 in 2004-05.<br />
In 1995, the Department and the Nevada Department of Transportation published<br />
the Sacramen<strong>to</strong>-Tahoe-Reno Intercity <strong>Rail</strong> Study that examined the feasibility of<br />
expanding passenger rail service along the I-80/Tahoe corridor from Sacramen<strong>to</strong><br />
<strong>to</strong> Truckee and Reno/Sparks on the UP line on which the <strong>California</strong> Zephyr<br />
currently operates. A number of scenarios were studied involving extending<br />
varying numbers of Capi<strong>to</strong>l Corridor trains from Sacramen<strong>to</strong> <strong>to</strong> Reno/Sparks, and<br />
all scenarios were determined <strong>to</strong> be feasible. In 2002, the CCJPA and the<br />
Placer County Transportation <strong>Plan</strong>ning Agency initiated a study <strong>to</strong> extend the<br />
Capi<strong>to</strong>l Corridor <strong>to</strong> Reno. The study was intended <strong>to</strong> provide current ridership,<br />
revenue, and train operating cost estimates for the train extension, and the capital<br />
costs for necessary station and track improvements. However, the study was<br />
suspended in March <strong>2005</strong> as a result of the UP’s decision <strong>to</strong> not conduct additional<br />
network modeling or consider operation of new passenger train service <strong>to</strong> Reno at<br />
this time. The UP has experienced a significant increase in freight traffic and has<br />
made a business decision <strong>to</strong> focus its efforts at this time on addressing additional<br />
freight demand.<br />
Operating <strong>Plan</strong><br />
The Department’s ten-year operating plan includes the extension of one<br />
Capi<strong>to</strong>l Corridor round-trip from Auburn <strong>to</strong> Reno/Sparks in 2008-09, and<br />
a second round-trip in 2010-11. This rail service would be supplemented by<br />
continued operation of existing bus service that runs over the same route as the<br />
train, but at other times of the day. This service would require an appropriate level<br />
of financial participation from the <strong>State</strong> of Nevada (and potentially Nevada<br />
business interests).<br />
135
<strong>2005</strong>-<strong>06</strong> – <strong>2015</strong>-<strong>16</strong> <strong>California</strong> <strong>State</strong> <strong>Rail</strong> <strong>Plan</strong><br />
The Department believes this corridor is a good candidate for rail corridor service<br />
because:<br />
• Amtrak currently operates the <strong>California</strong> Zephyr on the route so that<br />
stations at the major destination points already exist.<br />
• I-80 is extremely congested at <strong>to</strong>urist peak periods and there is a very<br />
strong gaming, skiing, and general recreation market in the Reno/Truckee<br />
area.<br />
• Current bus ridership on this route is strong.<br />
SACRAMENTO TO REDDING<br />
Operation of intercity rail service from Sacramen<strong>to</strong> <strong>to</strong> Redding would extend<br />
<strong>State</strong>-supported intercity rail service <strong>to</strong> a fast growing northern <strong>California</strong> area not<br />
presently served by the <strong>State</strong>-supported intercity passenger rail network.<br />
Background<br />
Connecting buses <strong>to</strong> the San Joaquin and Capi<strong>to</strong>l Corridor trains currently serve<br />
the northern Sacramen<strong>to</strong> Valley. Buses connect <strong>to</strong> three of the San Joaquins in<br />
S<strong>to</strong>ck<strong>to</strong>n, and one in Sacramen<strong>to</strong>, and travel north through Sacramen<strong>to</strong>,<br />
Marysville, Chico, and Redding. Four Capi<strong>to</strong>l Corridor trains in Sacramen<strong>to</strong> also<br />
have a bus connection <strong>to</strong> Redding. Ridership on this bus route is the second<br />
highest of all <strong>California</strong> dedicated bus routes after Los Angeles-Bakersfield, with<br />
82,000 riders in 2004-05. Additionally, the single daily round-trip of the<br />
Coast Starlight connects Redding and Chico with Sacramen<strong>to</strong>, the Bay Area, and<br />
Los Angeles on its route from Seattle.<br />
The most recent study on the Sacramen<strong>to</strong>-Redding corridor is the Northern<br />
Sacramen<strong>to</strong> Valley Intercity Passenger <strong>Rail</strong> Study, Interim Findings Report,<br />
produced in 1995 for the Butte County Association of Governments.<br />
The Department in <strong>2005</strong> had planned a further study on this Route, which was<br />
deferred due <strong>to</strong> the UP’s decision not <strong>to</strong> consider operation of new passenger<br />
trains at this time.<br />
Operating <strong>Plan</strong><br />
The Department’s ten-year operating plan includes one daily round-trip between<br />
Sacramen<strong>to</strong> and Redding in 2009-10 with a second round-trip starting in 2013-14.<br />
This rail service would be supplemented by bus service that would run over the<br />
same route as the train, but at other times of the day.<br />
The Department believes this extension is a good candidate for rail service<br />
because:<br />
• Amtrak currently operates the Coast Starlight on this Route, with existing<br />
stations at Sacramen<strong>to</strong>, Chico, and Redding.<br />
136
Chapter X – Potential New Services<br />
• The demographics of the Route are positive: the northern Sacramen<strong>to</strong><br />
Valley has a fast growing population; Redding represents the urban hub for<br />
the northern part of the <strong>State</strong>; and the <strong>California</strong> <strong>State</strong> University at Chico<br />
is a focus of activity and population.<br />
• Current ridership on this bus route is the second highest of all <strong>California</strong><br />
dedicated bus routes after Los Angeles-Bakersfield.<br />
LOS ANGELES TO INDIO (COACHELLA VALLEY)<br />
<strong>State</strong>-supported intercity passenger rail service from Los Angeles <strong>to</strong> Indio would<br />
extend rail service <strong>to</strong> a fast growing population center in the southeast of the <strong>State</strong>.<br />
Background<br />
Currently Amtrak’s Sunset Limited provides three-times per week service from<br />
Los Angeles <strong>to</strong> Pomona, Ontario, and Palm Springs on its route <strong>to</strong> New Orleans.<br />
San Joaquin trains provide once a day connecting buses <strong>to</strong> the Coachella Valley.<br />
Ridership on this route was 32,000 in 2004-05.<br />
There has been strong local interest in rail service <strong>to</strong> the Coachella Valley since<br />
1991 when the RCTC published the Los Angeles-Coachella Valley-Imperial<br />
County Intercity <strong>Rail</strong> Feasibility Study that evaluated the feasibility of operating<br />
three daily round-trip <strong>State</strong>-supported intercity trains on the route. In 1995,<br />
the Department published the Calexico-Coachella Valley-Los Angeles <strong>Rail</strong><br />
Corridor Study for the <strong>California</strong> Transportation Commission.<br />
The most recent study titled the Coachella Valley Passenger <strong>Rail</strong> Feasibility Study<br />
was prepared for the Coachella Valley Association of Governments in 1999.<br />
The study includes operating and capital cost estimates for the route and proposes<br />
two daily intercity round-trip trains. The study proposes operating from<br />
Los Angeles <strong>to</strong> the Coachella Valley using the BNSF route between Los Angeles<br />
and Col<strong>to</strong>n, and the UP route eastward <strong>to</strong> Indio. Stations are proposed at<br />
Los Angeles, Fuller<strong>to</strong>n, Riverside, Palm Springs, Palm Desert, and Indio.<br />
The study estimates $9.3 million in capital costs, not including rolling s<strong>to</strong>ck.<br />
The study proposes local funding for the new station at Palm Desert. The City of<br />
Indio received a <strong>State</strong>-matching grant of $1.5 million <strong>to</strong> construct its new station.<br />
A serious impediment <strong>to</strong> intercity rail service between Los Angeles and Indio is<br />
the UP’s recent decision not <strong>to</strong> consider operation of new passenger train corridors<br />
at this time. This route has heavy freight traffic that makes the operation of<br />
passenger service difficult.<br />
137
<strong>2005</strong>-<strong>06</strong> – <strong>2015</strong>-<strong>16</strong> <strong>California</strong> <strong>State</strong> <strong>Rail</strong> <strong>Plan</strong><br />
Operating <strong>Plan</strong><br />
The Department’s ten-year operating plan includes one daily round-trip between<br />
Los Angeles and Indio in 2010-11 and a second daily round-trip in 2013-14.<br />
The Department believes this extension is a good candidate for intercity rail<br />
service because:<br />
• There is existing Amtrak intercity rail service on a good part of the route,<br />
and all but one station already exists.<br />
• There is strong local support and financial commitment.<br />
• There is existing moderate bus ridership on the route, with a growing<br />
population.<br />
POTENTIAL INTERCITY RAIL ROUTES<br />
This section includes a discussion of two routes where funding is not proposed in<br />
the time period of this plan: San Francisco <strong>to</strong> Monterey and Los Angeles <strong>to</strong><br />
Las Vegas.<br />
SAN FRANCISCO TO MONTEREY<br />
<strong>State</strong>-supported intercity rail service from San Francisco <strong>to</strong> Monterey would<br />
connect the San Francisco Bay Area <strong>to</strong> an important <strong>to</strong>urist and population center<br />
of the <strong>State</strong> that currently has very inadequate intercity transportation.<br />
Background<br />
Currently, the only Amtrak service existing between Monterey and San Francisco<br />
is via the Coast Starlight, which provides one daily round-trip from Oakland <strong>to</strong><br />
Salinas, with bus connections <strong>to</strong> San Francisco from Oakland and <strong>to</strong> Monterey<br />
from Salinas. In June <strong>2005</strong>, Caltrans discontinued Capi<strong>to</strong>l Corridor feeder bus<br />
service from San Jose <strong>to</strong> Monterey due <strong>to</strong> low ridership.<br />
The TAMC has conducted a number of studies on train service options between<br />
San Francisco and Monterey. The San Francisco-Monterey Intercity <strong>Rail</strong> Service<br />
Implementation <strong>Plan</strong> was completed in 1998. In 2003, TAMC completed the<br />
Monterey Intercity <strong>Rail</strong> Project Study, which included conceptual engineering,<br />
initial cost estimates, and environmental screening for the project.<br />
In the near-term, TAMC is planning a new service <strong>to</strong> link Monterey <strong>to</strong><br />
San Francisco through a combination of local service and Caltrain commuter rail<br />
service. Starting in 2009, local light rail or bus rapid transit service is planned <strong>to</strong><br />
connect Monterey and Marina, and later extend <strong>to</strong> Castroville and possibly<br />
Salinas. The TAMC is concurrently working with Caltrain <strong>to</strong> extend commuter<br />
rail service in 2009 <strong>to</strong> Salinas from its current terminus in Gilroy. The extension<br />
of Caltrain commuter rail service <strong>to</strong> Monterey County would serve new stations in<br />
Pajaro and Castroville, and end in Salinas. The TAMC is working <strong>to</strong> ensure that<br />
138
Chapter X – Potential New Services<br />
the local service would connect with the Caltrain service via cross-platform<br />
transfers in Castroville. Bus connections <strong>to</strong> work and visi<strong>to</strong>r destinations, as well<br />
as transit-oriented developments, are planned at key locations along the way in<br />
Monterey County <strong>to</strong> maximize the usage of both services. (See Chapter IX for<br />
more detail on this proposed Caltrain extension.)<br />
In the longer term, TAMC is planning intercity rail service between Monterey and<br />
San Francisco. The intercity service would have s<strong>to</strong>ps in Monterey, Marina,<br />
Castroville, Pajaro, San Jose, San Francisco Airport (at Millbrae), and down<strong>to</strong>wn<br />
San Francisco, with a possible s<strong>to</strong>p in Palo Al<strong>to</strong>. The TAMC envisions<br />
two round-trips on weekdays and three on weekends for the Monterey <strong>to</strong><br />
San Francisco service.<br />
The proposed intercity route would use the current Caltrain owned ROW between<br />
San Francisco and San Jose. The route between San Jose and Castroville is owned<br />
by UP and used for passenger service by Caltrain <strong>to</strong> Gilroy and by the<br />
Coast Starlight <strong>to</strong> Castroville (and beyond <strong>to</strong> Los Angeles). The TAMC<br />
purchased the Monterey Branch Line between Castroville and the Seaside City<br />
limits from UP in 2003; the portion from Seaside <strong>to</strong> Monterey is already owned by<br />
Seaside City and Monterey. Currently there is no rail passenger service on this<br />
branch line and it requires substantial capital rehabilitation. Approximately<br />
$4.0 million remains in Proposition 1<strong>16</strong> funds that can be used for the Monterey<br />
Branch line rehabilitation construction activities. The TAMC has previously<br />
secured $2.2 million in <strong>State</strong> and Federal funds, and estimates <strong>to</strong>tal project capital<br />
costs including capital equipment costs at $75-$230 million depending on the type<br />
of service and equipment chosen. The TAMC plans <strong>to</strong> utilize TCRP funding,<br />
STIP funding, and future transportation sales tax funds <strong>to</strong> match Federal new starts<br />
funding <strong>to</strong> pay for the remainder of the capital costs.<br />
Operating <strong>Plan</strong><br />
The Department proposes, contingent on the start of local service in 2009,<br />
two intercity rail weekday round-trips and three weekend round-trips between<br />
San Francisco and Monterey. No funding for this service is included in the<br />
ten-year operating plan, as the start date of this route is uncertain at this time.<br />
The Department believes there are several advantages <strong>to</strong> this intercity rail service,<br />
including:<br />
• Monterey is an important <strong>to</strong>urist destination that currently has very<br />
inadequate access via intercity mass transportation.<br />
• The TAMC has strong local support for rail service. It is working <strong>to</strong> secure<br />
a local transportation sales tax <strong>to</strong> help support rail projects and<br />
Chapter 103, Statutes of 1999 (SB 886, McPherson) allows TAMC <strong>to</strong> be a<br />
party in an operations contract between the Department and Amtrak.<br />
139
<strong>2005</strong>-<strong>06</strong> – <strong>2015</strong>-<strong>16</strong> <strong>California</strong> <strong>State</strong> <strong>Rail</strong> <strong>Plan</strong><br />
• $14 million in Proposition 1<strong>16</strong> capital funds were earmarked for intercity<br />
rail service on this Route.<br />
LOS ANGELES TO LAS VEGAS<br />
In 1997, Amtrak discontinued the tri-weekly Desert Wind that ran from<br />
Los Angeles <strong>to</strong> Chicago via Las Vegas. Currently, San Joaquin trains provide<br />
connecting buses from Bakersfield <strong>to</strong> Las Vegas via Lancaster. Ridership on this<br />
route was 15,000 in 2004-05.<br />
In 1998, Amtrak announced plans <strong>to</strong> start service from Los Angeles <strong>to</strong> Las Vegas<br />
with one daily round-trip. However, due <strong>to</strong> continuing funding shortfalls and<br />
increased capital requirements <strong>to</strong> initiate service, the new service was not<br />
implemented.<br />
The Regional Transportation Commission of Southern Nevada is conducting a<br />
feasibility study on multi-frequency rail service between Las Vegas and the<br />
Los Angeles area. This study is being funded equally by the FRA and the <strong>State</strong> of<br />
Nevada. The Department will be working with the Commission on the study that<br />
will include ridership, cost and revenue projections; track, station, maintenance<br />
facility and property acquisition needs; equipment recommendations; and<br />
schedules for planning purposes.<br />
The Department presently includes no operating or capital costs for this service in<br />
its ten-year plan because costs and implementation schedules are dependant on the<br />
results of the Nevada study as well as agreement between <strong>California</strong> and Nevada<br />
on cost sharing.<br />
HIGH-SPEED RAIL<br />
BACKGROUND<br />
High-speed rail has been studied in <strong>California</strong> for over a decade.<br />
The Department participated in a number of studies in the late 1980s and early<br />
1990s. The Department was a member of the Los Angeles-Fresno-Bay Area/<br />
Sacramen<strong>to</strong> High-Speed <strong>Rail</strong> Corridor Study Group. The group published its<br />
report in 1990 as required by Chapter 197, Statutes of 1988 (AB 971 - Costa).<br />
Under Chapter 1104, Statutes of 1990 (SB 1307 - Garamendi), the Department in<br />
1991, completed a work plan for a feasibility study for the development of an<br />
integrated public, private, or combined public/private high-speed intercity and<br />
commuter rail system. Under Proposition 1<strong>16</strong>, the Department completed<br />
a preliminary engineering and feasibility study on high-speed service between<br />
Bakersfield and Los Angeles.<br />
Senate Concurrent Resolution 6 (1993) established the <strong>California</strong> Intercity<br />
High-Speed <strong>Rail</strong> Commission. This Commission, while using some Department<br />
staff resources, was not part of the Department. The Final Report of the<br />
Commission was sent <strong>to</strong> the Legislature at the end of 1996 and indicated that high-<br />
140
Chapter X – Potential New Services<br />
speed rail is technically, environmentally, and economically feasible, and once<br />
constructed, could be operationally self-sufficient. The Commission<br />
recommended a San Francisco/San Jose/Sacramen<strong>to</strong>-Central Valley-Los Angeles-<br />
San Diego alignment. The commission also recommended using either steelwheel-on-steel-rail<br />
high-speed technology or magnetic levitation (maglev).<br />
CALIFORNIA HIGH-SPEED RAIL AUTHORITY<br />
The <strong>California</strong> High-Speed <strong>Rail</strong> Act, enacted by Chapter 796, Statutes of 1996<br />
(SB 1420 - Kopp and Costa), established the <strong>California</strong> High-Speed <strong>Rail</strong> Authority<br />
(CHSRA) <strong>to</strong> direct the development and implementation of intercity high-speed<br />
rail service. The act defined high-speed rail as "intercity passenger rail service<br />
that utilizes an alignment and technology that make it capable of sustained speeds<br />
of 200 miles per hour or greater."<br />
Chapter 791, Statutes of 2000 (AB 1703 - Florez), modified the CHSRA’s<br />
exclusive authorization and responsibility for planning, construction, and<br />
operation of high-speed passenger train service <strong>to</strong> cover speeds exceeding<br />
125 miles per hour. Previously, the CHSRA had such authorization and<br />
responsibility for speeds exceeding 100 miles per hour. AB 1703 also extended<br />
the tenure of the CHSRA through 2003. Then Chapter 696, Statues of 2002<br />
(SB 796 - Costa) repealed the sunset date for the CHSRA, making it a permanent<br />
authority. The CHSRA is composed of nine members. The Governor appoints<br />
five members, the Senate Committee on Rules appoints two members, and the<br />
Speaker of the Assembly appoints two members.<br />
In 2000, the CHSRA completed its Business <strong>Plan</strong>, Building a High-Speed Train<br />
System for <strong>California</strong>. The Business <strong>Plan</strong> found that a high-speed train system is a<br />
smart investment in mobility, an evolutionary step for transportation, and a project<br />
in keeping with <strong>California</strong>’s standards for environmental quality and economic<br />
growth. The Business <strong>Plan</strong> determined that the next project step is <strong>to</strong> initiate a<br />
formal environmental clearance process with the development of a <strong>State</strong>-level<br />
program EIR.<br />
To implement the environmental process, the CHSRA prepared a Draft Program<br />
CEQA EIR and a NEPA Tier 1 EIS. The CHSRA is the <strong>State</strong> lead agency for<br />
CEQA and the FRA is the Federal lead agency for NEPA. The draft programlevel<br />
EIR/EIS was released on January 27, 2004. After extensive review, the Final<br />
EIR/EIS was posted on the Federal Register on September 23, <strong>2005</strong>.<br />
On November 2, <strong>2005</strong>, the Authority certified the Final EIR/EIS.<br />
The EIR/EIS describes the potential environmental impacts of three transportation<br />
system alternatives and compares how well they would meet <strong>California</strong>’s current<br />
and future transportation needs. The alternatives that were studied are:<br />
141
<strong>2005</strong>-<strong>06</strong> – <strong>2015</strong>-<strong>16</strong> <strong>California</strong> <strong>State</strong> <strong>Rail</strong> <strong>Plan</strong><br />
• The “No Project/No Action” alternative evaluates the <strong>State</strong>’s current<br />
transportation system, including highway and airport improvements<br />
planned <strong>to</strong> be operational by 2020.<br />
• The “High-Speed Train System” alternative evaluates a proposed new<br />
network of electrically powered trains, at least 700 miles long, connecting<br />
<strong>California</strong>’s major metropolitan areas and traveling 220 miles per hour.<br />
• The “Modal” alternative evaluates additional improvements <strong>to</strong> existing<br />
highways and airports that could serve the same travel demand as the<br />
proposed high-speed train system.<br />
Based on the analysis, the CHSRA and the FRA have identified the high-speed<br />
train system as the preferred system alternative <strong>to</strong> meet <strong>California</strong>’s future<br />
intercity travel demand. Service <strong>to</strong> urban centers would be on shared tracks with<br />
other passenger rail services at moderate speeds. Stations would be in close<br />
proximity <strong>to</strong> most major airports, and there would be station connections with<br />
major transit hubs in metropolitan areas. The EIR/EIS identifies preferred<br />
alignments, as follows:<br />
• Northern Mountain Crossing – a broad corridor containing a number of<br />
feasible route options have been identified for further study. The corridor<br />
is bounded by Pacheco Pass (SR-152) <strong>to</strong> the south, Altamont Pass (I-580)<br />
<strong>to</strong> the north, BNSF corridor <strong>to</strong> the east, and Caltrain <strong>to</strong> the west.<br />
• Southern Mountain Crossing – through the Techachapi Mountain Range<br />
between Los Angeles and Bakersfield via a crossing through Palmdale and<br />
the Antelope Valley.<br />
• Bay Area – service on the Peninsula and in the East Bay.<br />
• Central Valley – Highway 99 corridor (mostly BNSF alignment).<br />
• San Diego – via I-215/ I-15 corridor <strong>to</strong> down<strong>to</strong>wn.<br />
• Orange County – Los Angeles <strong>to</strong> Orange County via Pacific Surfliner<br />
Route.<br />
In August <strong>2005</strong>, the Authority also approved an Implementation <strong>Plan</strong>, which<br />
outlines the structure and institutional organization <strong>to</strong> manage construction work.<br />
The <strong>Plan</strong> calls for maximum participation and risk sharing from the private sec<strong>to</strong>r<br />
and for private companies <strong>to</strong> adapt existing high-speed rail technology <strong>to</strong> meet<br />
<strong>California</strong>’s needs.<br />
142
Chapter X – Potential New Services<br />
The next steps in the environmental process include:<br />
• The FRA certifies compliance with the National Environmental Protection<br />
Act.<br />
• The Authority and FRA prepare a program level environmental review for<br />
the “Bay Area-Central Valley” segment <strong>to</strong> select a preferred alignment and<br />
station locations.<br />
• The Authority determines whether <strong>to</strong> advance individual segments of the<br />
system <strong>to</strong> project-specific review.<br />
• The Bay Area Metropolitan Transportation Commission’s statewide<br />
ridership/revenue study is completed and used <strong>to</strong> update the high-speed<br />
train system’s business plan.<br />
• The CHSRA begins working on ROW preservation and protective advance<br />
acquisition.<br />
The <strong>2005</strong> <strong>State</strong> Budget includes $1.7 million <strong>to</strong> complete the “next tier” programlevel<br />
EIR/EIS for the Northern Mountain Crossing that will determine the best<br />
alignment between the Central Valley and Bay Area. An additional $500,000 has<br />
been allocated <strong>to</strong> update the financing plan for the high-speed train system.<br />
Figure 10B displays the preferred high-speed rail alignments in the Final Program<br />
EIR/EIS as well as the maglev routes currently being studied in <strong>California</strong>.<br />
MAGNETIC LEVITATION<br />
Maglev technology uses magnetic forces <strong>to</strong> lift, propel, and guide a vehicle over a<br />
guideway. Electric power and control systems eliminate contact between the<br />
vehicle and the guideway. In 1989, a 19.5-mile testing track was put in service in<br />
Emsland, Germany. The system is still in operation and carrying visi<strong>to</strong>rs.<br />
In 2002, a 19-mile Transrapid Maglev line was put in operations in Shanghai,<br />
China. The line connects Pudong International Airport with Shanghai subway<br />
station in the financial district. The Shanghai line has been operating at a<br />
maximum speed of 310 mph.<br />
The Maglev Deployment Program was established in 1998 by the Transportation<br />
Equity Act for the 21 st Century (TEA-21; Section 1218 of Public Law 105-178)<br />
with the purpose of demonstrating the feasibility of Maglev technology in the<br />
United <strong>State</strong>s. $55 million was available <strong>to</strong> fund pre-construction planning<br />
activities for FFYs 1998-2003. An additional $950 million was authorized for the<br />
construction and deployment of selected projects.<br />
In 1999, the U.S. Department of Transportation (USDOT) awarded grants <strong>to</strong> seven<br />
states and authorities for pre-construction planning for Maglev high-speed ground<br />
transportation. The FRA selected projects in Southern <strong>California</strong>, Florida,<br />
Georgia, Louisiana, Maryland, Nevada, and Pennsylvania for funding. Each of the<br />
143
<strong>2005</strong>-<strong>06</strong> – <strong>2015</strong>-<strong>16</strong> <strong>California</strong> <strong>State</strong> <strong>Rail</strong> <strong>Plan</strong><br />
grants provided sufficient Federal funds <strong>to</strong> pay up <strong>to</strong> two-thirds of the cost of<br />
preliminary engineering, market studies, environmental assessments, and financial<br />
planning needed <strong>to</strong> determine the feasibility of deploying a Maglev project.<br />
In 2001, USDOT selected two projects, one in Maryland and one in Pennsylvania,<br />
<strong>to</strong> continue <strong>to</strong> the next stage of the competition. Neither the Southern <strong>California</strong><br />
nor the Nevada Maglev project was chosen <strong>to</strong> go forward in the national<br />
competition for construction funding. However, Congress has continued <strong>to</strong><br />
provide planning grants <strong>to</strong> the Southern <strong>California</strong> and Nevada projects in<br />
FFYs 2001-2004, and Nevada received additional funding in FFY <strong>2005</strong>. Of the<br />
original seven projects, funding was discontinued for the Florida, Georgia, and<br />
Louisiana projects in FY 2002.<br />
Recently, Congress authorized $90 million for Maglev deployment as part of the<br />
reauthorization of SAFETEA-LU, with half of these funds allocated <strong>to</strong> the<br />
Las Vegas-Anaheim Maglev project.<br />
The two <strong>California</strong> projects still have significant hurdles <strong>to</strong> overcome.<br />
Their sponsors will need <strong>to</strong> complete engineering work and environmental<br />
documentation <strong>to</strong> further the initial concept design plans. As the projects were not<br />
selected for Federal construction funding, a principal funding source remains <strong>to</strong> be<br />
identified. Coordination must continue with the Department, railroad opera<strong>to</strong>rs,<br />
and local agencies along the corridor.<br />
144
Chapter X – Potential New Services<br />
Figure 10B<br />
145
<strong>2005</strong>-<strong>06</strong> – <strong>2015</strong>-<strong>16</strong> <strong>California</strong> <strong>State</strong> <strong>Rail</strong> <strong>Plan</strong><br />
SOUTHERN CALIFORNIA MAGLEV PROJECT<br />
The initial 92-mile corridor study area of the Southern <strong>California</strong> Maglev Program<br />
extends from Los Angeles International Airport (LAX) via LAUS, east <strong>to</strong> Ontario<br />
International Airport and on <strong>to</strong> March Inland Port in Riverside County.<br />
The Southern <strong>California</strong> Association of Governments (SCAG) is the project<br />
sponsor.<br />
By 2030, the population of Southern <strong>California</strong> is expected <strong>to</strong> grow from<br />
17 million <strong>to</strong> 23 million people. Demand at the region’s airports could increase <strong>to</strong><br />
approximately 170 million annual passengers. Air cargo volume is expected <strong>to</strong><br />
triple <strong>to</strong> nine million annual <strong>to</strong>ns. The prospect of these increases in population,<br />
employment and air travel demands led SCAG <strong>to</strong> adopt a high-speed<br />
intra-regional Maglev system connecting regional airports as part of a<br />
decentralized Aviation System <strong>Plan</strong>. This <strong>Plan</strong> was adopted as part of its Regional<br />
Transportation <strong>Plan</strong> in 1998.<br />
In 2000, the Southern <strong>California</strong> Maglev Deployment Project sponsors submitted a<br />
Project Description <strong>to</strong> the FRA in competing for Federal Maglev funding.<br />
The grant application <strong>to</strong> the FRA described an intra-regional Maglev system, of<br />
which the first line <strong>to</strong> be considered was on the LAX <strong>to</strong> March Inland Port<br />
Corridor. Highlights of the Project Description are:<br />
• The proposed system design is based upon Maglev technology developed<br />
by the German consortium Transrapid.<br />
• The proposed project serves a very dense corridor defined by the Federal<br />
Government as a Corridor of National Significance. By 2020, about<br />
2.5 million long distance trips would be made in the corridor, and the<br />
system would serve approximately 134,000 riders per day. Travel-time<br />
savings from one end of the line <strong>to</strong> the other are estimated <strong>to</strong> be 80 minutes.<br />
• The 92-mile system was estimated <strong>to</strong> cost about $8 billion <strong>to</strong> construct.<br />
Approximately 24 percent of this cost was for the system elements:<br />
vehicles, communications, propulsion, and operation control. The cost of<br />
the guideway was about 43 percent of the <strong>to</strong>tal cost. Stations, yards and<br />
shops, ROW, and other civil works comprise the remainder of the project<br />
costs.<br />
With the FY 2001 Federal funding, SCAG performed additional studies on this<br />
Project, including evaluation of the impacts of the Project on use of highway and<br />
railroad rights-of–way, on LAUS, and on the Metrolink commuter rail system.<br />
The SCAG also completed further work in the areas of technology transfer<br />
agreements, cost and revenue projections, financial plan, public/private partnering<br />
agreements, environmental studies, and public participation.<br />
146
Chapter X – Potential New Services<br />
In December 2002, SCAG’s Regional Council selected a 54-mile segment of the<br />
LAX-March Inland Port Corridor as the Initial Operating Segment (IOS) going<br />
from Ontario Airport <strong>to</strong> West Los Angeles. Pre-construction work on the project<br />
has begun, including completion of more detailed engineering, a <strong>State</strong> EIR, and a<br />
Federal EIS. The joint powers authority for the IOS is being developed.<br />
This phase, budgeted at $15 million, will take about 18 months <strong>to</strong> complete.<br />
In FFY 2001, SCAG received $877,000 in Federal Maglev funding. In FFY 2002,<br />
SCAG received $1.0 million in Federal Maglev funding for continued corridor<br />
planning activities. In FFY 2003, an additional $500,000 in Federal Maglev<br />
funding was provided <strong>to</strong> support further planning studies. In FFY 2004, SCAG<br />
received an additional $1.0 million in Federal Maglev funding.<br />
In addition <strong>to</strong> the project described above, SCAG has undertaken three additional<br />
Maglev feasibility studies along other heavily congested corridors. They are:<br />
1) Los Angeles <strong>to</strong> Palmdale in Antelope Valley, along the SR-14 and I-5 or I-405<br />
freeway corridors; 2) LAX <strong>to</strong> south Orange County, along the I-405 Freeway; and<br />
3) the Orange Line from down<strong>to</strong>wn Los Angeles <strong>to</strong> central Orange County<br />
following the former Pacific Electric <strong>Rail</strong>way corridor. In <strong>2005</strong>, SAFETEA-LU<br />
authorized an additional $280,000 for planning Maglev service on the<br />
Orange Line.<br />
From these studies, SCAG has concluded that the Maglev projects can be selffunded<br />
through a public-private partnership, where the public sec<strong>to</strong>r will donate<br />
land and the private sec<strong>to</strong>r will construct and operate the system. Additionally,<br />
innovative funding strategies, such as Federal Transportation Infrastructure<br />
Finance and Innovation Act (TIFIA) loans and private investment bonds can be<br />
used <strong>to</strong> finance this project. The first of three joint exercise of powers authorities<br />
(JPAs) has been formed <strong>to</strong> deploy the Maglev projects in Southern <strong>California</strong>.<br />
The Orange Line Development Authority has been organized by cities along this<br />
corridor <strong>to</strong> advance the down<strong>to</strong>wn Los Angeles <strong>to</strong> Orange County Maglev system.<br />
LAS VEGAS-ANAHEIM MAGLEV PROJECT<br />
The <strong>California</strong>-Nevada Super Speed Train Commission (CNSSTC) was formed in<br />
1988 <strong>to</strong> promote the development of a 269-mile maglev system connecting<br />
Las Vegas with Anaheim. The CNSSTC and its private sec<strong>to</strong>r partner, American<br />
Magline Group, for its FRA application in 2000, proposed a 40-mile segment from<br />
Las Vegas <strong>to</strong> Primm, on the <strong>California</strong> border. A short segment of the project was<br />
chosen because of the difficulty in raising funds for the entire 269-mile project.<br />
The route travels between two fast-growing and heavily populated regions of the<br />
U.S. The project would have a <strong>to</strong>tal of five segments: Las Vegas <strong>to</strong> Primm,<br />
Primm <strong>to</strong> Bars<strong>to</strong>w, Bars<strong>to</strong>w <strong>to</strong> Vic<strong>to</strong>rville, Vic<strong>to</strong>rville <strong>to</strong> Ontario, and Ontario <strong>to</strong><br />
Anaheim. There would be s<strong>to</strong>ps at each of the endpoints of the segments, for a<br />
<strong>to</strong>tal of at least six s<strong>to</strong>ps. A key advantage of the system is the alignment provided<br />
147
<strong>2005</strong>-<strong>06</strong> – <strong>2015</strong>-<strong>16</strong> <strong>California</strong> <strong>State</strong> <strong>Rail</strong> <strong>Plan</strong><br />
by the Interstate Highway 15 ROW. If available, this alignment would minimize<br />
the need for property acquisition and provides the least complicated construction<br />
scenario possible.<br />
To date the project has received a <strong>to</strong>tal of $9.0 million in Federal funding from<br />
FY 1999 through FY <strong>2005</strong>: $1.4 million in FY 1999; $2.0 million in FY 2000;<br />
$900,000 million in FY 2001; $1.2 million in FY 2002; $1.5 million in<br />
FY 2003; $1.0 million in FY 2004; and $1.0 million in FY <strong>2005</strong>. Also,<br />
$45 million is authorized in SAFETEA-LU for the next five years.<br />
The CNSSTC has done a number of studies <strong>to</strong> date. They prepared and submitted<br />
<strong>to</strong> USDOT a Project Description Report on the Las Vegas <strong>to</strong> Primm segment in<br />
2000. Next the CNSSTC produced the Las Vegas-Primm/Bars<strong>to</strong>w Supplemental<br />
Project Description in August 2002. That report presents projected physical<br />
infrastructure, ridership, costs, benefits, and related information for the extended<br />
segment from Las Vegas <strong>to</strong> Bars<strong>to</strong>w via Primm. The report estimated capital costs<br />
for the segment in 2000 dollars <strong>to</strong> be $5.65 billion.<br />
In May 2004, the FRA agreed <strong>to</strong> prepare a Programmatic Environmental Impact<br />
<strong>State</strong>ment (PEIS) for the project, in cooperation with the Nevada Department of<br />
Transportation. The PEIS will cover the entire corridor between Las Vegas and<br />
Anaheim, and will include a site-specific construction level Program<br />
Environmental Impact Report (PEIR) for the Las Vegas <strong>to</strong> Primm, Nevada<br />
segment. As part of the PEIS, five public meetings were held in June 2004 in key<br />
cities along the route. The CNSSTC has also prepared a preliminary report that<br />
summarizes the results of the public meetings, a purpose and needs statement, and<br />
a work plan. The PEIS/REIR is expected <strong>to</strong> be completed within three years.<br />
The Department will be the lead agency <strong>to</strong> review environmental documents under<br />
CEQA. However, the current PEIS does not trigger CEQA review as it is not<br />
considered a “project” under CEQA definition. Only site-specific environmental<br />
work on corridor segments in <strong>California</strong> will trigger CEQA.<br />
148
Chapter XI – Amtrak<br />
CHAPTER XI<br />
AMTRAK<br />
This chapter provides information on: Amtrak’s relationship with the Department<br />
and with the CCJPA, key Amtrak planning initiatives, and recent Amtrak reform<br />
proposals and budget.<br />
AMTRAK’S RELATIONSHIP WITH THE DEPARTMENT AND<br />
THE CAPITOL CORRIDOR JOINT POWERS AUTHORITY<br />
The Department provides operating funding for three intercity rail passenger<br />
services, the Pacific Surfliners, San Joaquins, and the Capi<strong>to</strong>l Corridor.<br />
Amtrak operates all three services under the provisions of Section 24101(c)(2) of<br />
the Federal <strong>Rail</strong> Passenger Service Act that authorizes Amtrak <strong>to</strong> operate intercity<br />
rail passenger service beyond its basic system services when requested <strong>to</strong> do so by<br />
a state, group of states, or a regional or local agency. The Department directly<br />
administers the Pacific Surfliners and San Joaquins. (Amtrak funds 30 percent of<br />
the Pacific Surfliner service as part of its basic system, and the <strong>State</strong> pays for the<br />
remaining 70 percent of this service.) Since July 1998, the Capi<strong>to</strong>l Corridor Joint<br />
Powers Authority (CCJPA) has administered the Capi<strong>to</strong>l Corridor service under<br />
an interagency transfer agreement with the <strong>State</strong>.<br />
In the past Amtrak provided significant fiscal support <strong>to</strong> state-supported routes.<br />
Then, over time, the share of service costs (called cost basis) that Amtrak required<br />
states <strong>to</strong> pay increased significantly. Between FFY 1992 and FFY 1999 the cost<br />
basis increased each year. Under the cost basis starting in FFY 1999, the <strong>State</strong><br />
paid 100 percent of all variable costs and Amtrak covered all fixed costs.<br />
Since FFY 1999, the cost basis has remained fairly constant. Also, the CCJPA<br />
starting in FFY 2000 entered in<strong>to</strong> a fixed price-operating contract with Amtrak for<br />
the Capi<strong>to</strong>l Corridor service.<br />
In the fall of 2002, Amtrak modified the cost allocation principle slightly <strong>to</strong><br />
recovery of “direct costs” which include all train related costs and a portion of<br />
shared costs, but excludes system overhead, interest and depreciation. Costs on<br />
this basis actually decreased slightly on the Pacific Surfliners for the same level of<br />
service, primarily because the <strong>State</strong> is no longer charged equipment capital costs<br />
for the use of Amtrak owned equipment. <strong>State</strong> contract costs have been constant<br />
for the four years from 2002-03 through <strong>2005</strong>-<strong>06</strong>. <strong>State</strong> operating costs have<br />
never been constant for such a long period of time in the his<strong>to</strong>ry of <strong>State</strong>-supported<br />
service.<br />
149
<strong>2005</strong>-<strong>06</strong> – <strong>2015</strong>-<strong>16</strong> <strong>California</strong> <strong>State</strong> <strong>Rail</strong> <strong>Plan</strong><br />
The Department pays the entire net operating loss of the feeder buses that serve<br />
the <strong>State</strong>-supported routes. The operating loss consists of the entire bus operating<br />
costs (as billed by the contract bus opera<strong>to</strong>r) minus the feeder bus revenue credits.<br />
The bus revenue credits represent a proportional share of the passenger’s entire<br />
rail-bus fare assigned <strong>to</strong> the bus portion of the trip.<br />
Amtrak, in operating service for the <strong>State</strong> or the CCJPA, performs many functions.<br />
Amtrak employees function as train crews and staff stations with ticket offices.<br />
The equipment (whether owned by Amtrak or the Department) is maintained by<br />
Amtrak staff at Amtrak operated facilities in Oakland and Los Angeles.<br />
Amtrak staff at these locations, and <strong>to</strong> a lesser degree in Washing<strong>to</strong>n D.C. and<br />
Philadelphia, also perform administrative and other functions related <strong>to</strong> <strong>California</strong><br />
<strong>State</strong>-supported service.<br />
Amtrak maintains control over many operational functions related <strong>to</strong><br />
<strong>State</strong>-supported service. For example, Amtrak administers fare policy in<br />
accordance with its national goal <strong>to</strong> maximize revenues. However, the<br />
Department approves or disapproves fare changes, as provided in its contract with<br />
Amtrak. In addition, the Department and the CCJPA work with Amtrak <strong>to</strong><br />
develop special <strong>California</strong> or route-specific promotions. Amtrak also has national<br />
service requirements and standards that it maintains. The Department has been<br />
successful in working with Amtrak <strong>to</strong> adapt some of these policies (such as food<br />
service) <strong>to</strong> specific <strong>California</strong> conditions.<br />
AMTRAK PLANNING<br />
AMTRAK STRATEGIC REFORM INITIATIVE AND FY <strong>06</strong> GRANT<br />
REQUEST<br />
In April <strong>2005</strong>, Amtrak released its Amtrak Strategic Reform Initiatives and<br />
FY <strong>06</strong> Grant Request. This document included comprehensive reform initiatives<br />
the railroad is undertaking as corporate actions and others it intends <strong>to</strong> pursue in<br />
legislative actions <strong>to</strong> “revitalize U.S. passenger rail service.” The document also<br />
included the FY <strong>06</strong> grant request of $1.82 billion for capital investment programs<br />
and operations.<br />
Amtrak stated that the initiatives have four fundamental long-term objectives:<br />
• Development of passenger rail corridors utilizing a Federal/state matching<br />
approach common <strong>to</strong> all other modes (generally 80/20). <strong>State</strong>s, not<br />
Amtrak, would lead the development of the corridors, a number of which<br />
have already been Federally designated. Ultimately, Amtrak would be one<br />
of the competitive bidders for functions or for entire services.<br />
150
Chapter XI – Amtrak<br />
• Return of the Northeast Corridor infrastructure <strong>to</strong> a state-of-good-repair and<br />
operational reliability, with phased-in financial responsibility for capital<br />
and operating costs assumed on a proportionate basis by all users, including<br />
Amtrak, freight and commuter railroads.<br />
• Establishment of phased-in financial performance thresholds for Amtrak’s<br />
existing 15 long-distance trains and any future similar proposed service.<br />
Amtrak is initiating a series of actions <strong>to</strong> improve the financial performance<br />
of these trains. Services falling below the thresholds could be continued<br />
through support by state or other authorities, reconfigured or eliminated.<br />
• Creation of markets for competition, private commercial participation and<br />
industrial reforms in various rail functions. This includes competition<br />
among opera<strong>to</strong>rs, including Amtrak, for new corridor routes.<br />
For <strong>California</strong> there are a number of important initiatives included in the<br />
document. First, the recommendation for a Federal 80 percent/state 20 percent<br />
capital match program for state rail capital investment is key <strong>to</strong> allowing<br />
<strong>California</strong> <strong>to</strong> leverage <strong>State</strong> funds with Federal funds <strong>to</strong> continue <strong>to</strong> make<br />
improvements <strong>to</strong> the intercity rail system. Second, the reform initiatives call for<br />
other opera<strong>to</strong>rs <strong>to</strong> be able <strong>to</strong> compete for elements of service (e.g., food service<br />
and mechanical services), and ultimately with Amtrak for operation of routes.<br />
Qualified competi<strong>to</strong>rs could potentially receive the rights <strong>to</strong> private railroad track<br />
at incremental costs, assuming legislative changes contained in the proposal, and<br />
access <strong>to</strong> Amtrak rolling s<strong>to</strong>ck. As part of the proposal, Amtrak would phase out<br />
any operating support for <strong>State</strong>-supported Routes by FY 2011. This may result in<br />
additional costs <strong>to</strong> <strong>California</strong>.<br />
AMTRAK’S 2004 STRATEGIC BUSINESS PLAN<br />
In June 2004, Amtrak released its Amtrak Strategic <strong>Plan</strong> FY <strong>2005</strong>-2009, which is<br />
a strategic capital investment and operating plan that updates the plan released in<br />
2003. Amtrak is now updating the Strategic <strong>Plan</strong> and expects <strong>to</strong> release it in<br />
Spring 20<strong>06</strong>.<br />
Amtrak’s Strategic <strong>Plan</strong> FY <strong>2005</strong>-2009 aims <strong>to</strong> res<strong>to</strong>re Amtrak’s physical plant<br />
and train equipment <strong>to</strong> a state-of-good-repair and improve the railroad’s<br />
operational reliability. The <strong>Plan</strong> identifies four strategies: (1) maintain the focus<br />
on stabilizing the railroad; (2) continue <strong>to</strong> ramp-up the capital program;<br />
(3) continue the emphasis on operating efficiencies through improved fleet<br />
utilization, better service design, and increased productivity; and (4) encourage<br />
investment in improved service, including corridor development. The <strong>Plan</strong> is<br />
based on investments in existing infrastructure and equipment, and proposes no<br />
new significant passenger services – focusing instead on improving the reliability<br />
and cost-efficiency of the passenger railroad’s existing services.<br />
151
<strong>2005</strong>-<strong>06</strong> – <strong>2015</strong>-<strong>16</strong> <strong>California</strong> <strong>State</strong> <strong>Rail</strong> <strong>Plan</strong><br />
The <strong>Plan</strong> outlines the progress made in FFY 2003-04, including establishing a<br />
transparent financial reporting system, implementing zero-based budgeting,<br />
imposing strict headcount control measures, focusing on day-<strong>to</strong>-day passenger<br />
operations, and on maintenance of plant and equipment. The <strong>Plan</strong> continues these<br />
measures for the next five years. Challenges that Amtrak faced in FFY 2003-04<br />
which are likely <strong>to</strong> continue include: 1) continuing deterioration in host railroads’<br />
capacity and infrastructure, and 2) failures and delays attributed <strong>to</strong> deferred<br />
investment in and reconstruction of Amtrak’s plant and equipment.<br />
To support the existing system, the five-year Strategic <strong>Plan</strong> calls for Federal<br />
funding averaging about $1.6 billion per year. The plan holds the line on Federal<br />
support for operating purposes each year at $570 million. The majority of Federal<br />
support is for capital improvements <strong>to</strong> the existing system and <strong>to</strong> bring facilities<br />
and equipment up <strong>to</strong> a state-of-good-repair. The <strong>Plan</strong> reiterates current Federal<br />
policy that Amtrak not initiate new train services unless the state or states served<br />
pays the full operating loss. Amtrak continues <strong>to</strong> seek full state funding for<br />
“direct” operating losses on existing state-supported trains.<br />
<strong>California</strong> Capital Funding<br />
Although the <strong>Plan</strong> is primarily directed <strong>to</strong> preserve and improve Amtrak-owned<br />
assets in the Northeast Corridor, it also proposes funding for several projects in<br />
<strong>California</strong>. It includes $90.1 million for projects which impact <strong>California</strong>, of<br />
which $41.5 million is for projects wholly in <strong>California</strong> and $48.6 million is for<br />
multi-state projects that partially impact <strong>California</strong>. Key projects in <strong>California</strong><br />
include: Phase II of the new maintenance facility in Oakland that was completed<br />
in September 2004 and fully operational in December 2004; overhauls of<br />
Pacific Surfliner equipment; and basic repairs of Amtrak-owned equipment<br />
maintenance facilities in Los Angeles. The actual level of funding for the projects<br />
is dependent on Congressional appropriations during the period of the <strong>Plan</strong>.<br />
Figure 11A lists the <strong>California</strong> related projects included in the Amtrak<br />
Strategic <strong>Plan</strong>.<br />
152
Chapter XI – Amtrak<br />
Figure 11A<br />
Amtrak Five-Year Strategic <strong>Plan</strong> - Capital Projects – FFY <strong>2005</strong>-09<br />
<strong>California</strong> Projects<br />
Summary of Project Scope<br />
Amtrak<br />
Funding<br />
(000)<br />
Los Angeles Yard – New<br />
Equipment<br />
Replace electric carts and shop equipment $ 50<br />
Surfliner Equipment – Replace most parts due for renewal, along with some<br />
Overhauls<br />
upgrades and structural repairs<br />
10,600<br />
Los Angeles Yard Install roof for commissary and material control building,<br />
Improvements<br />
wheel truing machine, sand <strong>to</strong>wer and industrial waste line<br />
2,400<br />
Service & Inspection Replace specialty <strong>to</strong>ols, equipment, etc. for LA and OAK<br />
Facilities Running Repair S&I Facilities<br />
7,500<br />
Los Angeles Yard Track Construct tracks <strong>to</strong> connect <strong>to</strong> 9 th Street 250<br />
Los Angeles Union<br />
Station Improvements<br />
Oakland Maintenance<br />
Facility Phase II<br />
Oakland Maintenance<br />
Facility Yard<br />
Emeryville Station<br />
Lease/Purchase<br />
Extension of Pacific<br />
Surfliner Double-track –<br />
CP Flores <strong>to</strong> CP O’Neal<br />
San Diego – New<br />
Layover and Light<br />
Maintenance Facility<br />
Install tactile warning tiles on Tracks 10,11,12 350<br />
Construction of Commissary and Welfare facilities 14,000<br />
Demolish existing infrastructure in UP Yard 300<br />
Provide funds for lease/purchase of the station 400<br />
Construct 1.8 miles of second mainline track, including<br />
Centralized Traffic Control (CTC)<br />
Participate in the construction of a multi-s<strong>to</strong>ry building, of<br />
which the first floor is <strong>to</strong> be used by Amtrak and Caltrans <strong>to</strong><br />
s<strong>to</strong>re equipment and materials needed for rolling s<strong>to</strong>ck<br />
maintenance<br />
Construct station track, platform, and control point<br />
improvements<br />
1,250<br />
Oakland – Station and<br />
Platform Improvements<br />
680<br />
Rocklin Station Construct improvements <strong>to</strong> meet ADA Requirements 250<br />
Capi<strong>to</strong>l Corridor<br />
Install Closed Circuit Television in 8 stations along Capi<strong>to</strong>l<br />
Corridor<br />
300<br />
San Joaquin Route<br />
Install Closed Circuit Television in 8 stations along San<br />
Joaquin Route<br />
300<br />
Salinas Station Reconstruct Salinas Platform 2,525<br />
<strong>California</strong> Projects Total $ 41,505<br />
Multi-<strong>State</strong> Projects<br />
<strong>Rail</strong> Replacement and<br />
Rehabilitation – Pacific<br />
and Southwest Divisions<br />
Superliner II Equipment –<br />
Overhauls<br />
Superliner I Equipment –<br />
Overhauls<br />
F59PHI Diesel<br />
Locomotive Overhauls<br />
Western Division<br />
Pollution Prevention<br />
Replace and rehabilitate rail, wood ties, and turnouts $ 6,400<br />
Replace most parts due for renewal, along with some<br />
upgrades and structural repairs<br />
350<br />
21,200<br />
Modify or remanufacture existing equipment 13,600<br />
Replace most parts due for renewal, along with some<br />
upgrades and structural repairs<br />
5,200<br />
Construct pollution prevention upgrades and improvements 2,220<br />
Multi-<strong>State</strong> Projects Total $ 48,620<br />
GRAND TOTAL $ 90,125<br />
153
<strong>2005</strong>-<strong>06</strong> – <strong>2015</strong>-<strong>16</strong> <strong>California</strong> <strong>State</strong> <strong>Rail</strong> <strong>Plan</strong><br />
<strong>California</strong> Corridors Highlighted in <strong>State</strong> Corridor Initiatives<br />
The Amtrak 2004 strategic plan also includes an Appendix called the <strong>State</strong><br />
Corridor Initiatives that focuses on state proposals supported by Amtrak for<br />
specific passenger rail corridor development, and strategies <strong>to</strong> protect and upgrade<br />
key facilities owned by freight railroads.<br />
Amtrak surveyed all states and identified those corridors that complied with<br />
Amtrak’s criteria indicating a readiness <strong>to</strong> receive Federal investment. The criteria<br />
includes a long-term master plan, market revenue forecast, operating expense<br />
forecast, infrastructure and equipment investment plans, host railroad acceptance,<br />
agreement <strong>to</strong> fund a 20 percent capital match, and agreement <strong>to</strong> cover any added<br />
operating deficit. Amtrak worked with states <strong>to</strong> clearly identify the corridors, the<br />
congestion and capacity challenges and capital investment needs.<br />
Only eight corridors nationwide achieved the “Tier I” level of ready-<strong>to</strong>-invest,<br />
three of which are <strong>California</strong> <strong>State</strong>-supported corridors (Pacific Surfliner,<br />
San Joaquin, and Capi<strong>to</strong>l Corridor). The other corridors in the Tier I category<br />
included those in Washing<strong>to</strong>n, Oregon, Wisconsin, Illinois, North Carolina, and<br />
Pennsylvania. Amtrak, in conjunction with the states, proposed a Pilot Program of<br />
matched Federal funding for Tier I corridors. Should that come <strong>to</strong> fruition,<br />
<strong>California</strong> would receive over $900 million.<br />
One outgrowth of the Strategic <strong>Plan</strong> and the <strong>State</strong> Corridor Initiatives was a<br />
recognition that many states, as well as Amtrak, desperately need rolling s<strong>to</strong>ck for<br />
existing service and future expansions. <strong>State</strong>s, such as <strong>California</strong>, are working <strong>to</strong><br />
grow the rail market and build the track infrastructure <strong>to</strong> expand service and<br />
reduce trip times <strong>to</strong> meet the demand. Amtrak has joined with ten states <strong>to</strong><br />
develop a standardized specification for single-level and multi-level passenger<br />
coaches, in the hopes of pooling funding from states and Amtrak <strong>to</strong> share expertise<br />
and staff resources, create a national standardized pool of intercity rolling s<strong>to</strong>ck,<br />
and <strong>to</strong> achieve efficiencies of scale inherent in larger procurements. <strong>California</strong><br />
(both the Department and CCJPA) is participating in this effort. The Department<br />
is working with Amtrak <strong>to</strong> upgrade the design specifications of the<br />
Surfliner/<strong>California</strong> Car should funding become available <strong>to</strong> purchase new rolling<br />
s<strong>to</strong>ck.<br />
Amtrak is currently working <strong>to</strong> update the <strong>State</strong> Corridor Initiatives. In the fall of<br />
<strong>2005</strong> the Department submitted updated Corridor Assessments for the<br />
San Joaquins and Pacific Surfliners and the CCJPA submitted an updated<br />
Assessment for the Capi<strong>to</strong>l Corridor. The Assessments include five-year capital<br />
plans for the corridors, and comprise the initial five-year period for the<br />
Department’s ten-year Capital Program shown in Chapter II.<br />
154
Chapter XI – Amtrak<br />
AMTRAK REFORM AND BUDGET<br />
For a number of years Amtrak’s future and budget levels have been hotly debated<br />
in Washing<strong>to</strong>n D.C. According <strong>to</strong> the Congressional Budget Office September<br />
2003 study The Past and Future of U.S. Passenger <strong>Rail</strong> Service “more than three<br />
decades after the Congress and the President created the National <strong>Rail</strong>road<br />
Passenger Corporation, Federal policies <strong>to</strong>ward intercity passenger rail service<br />
remain unsettled. Policymakers have not been able <strong>to</strong> agree about whether the<br />
company should be a private, for-profit enterprise (like airlines and intercity bus<br />
companies) or a public service (like urban mass transit) that would use<br />
government subsidies <strong>to</strong> achieve social objectives.” This conclusion remains true<br />
<strong>to</strong>day in <strong>2005</strong>, two years later.<br />
FFY 2003 BUDGET AND LEGISLATIVE REFORM PROPOSALS<br />
The Administration in June 2002 released its five principles for Amtrak reform.<br />
These principles are <strong>to</strong>: create a system driven by sound economics; require that<br />
Amtrak transition <strong>to</strong> a pure operating company; introduce carefully managed<br />
competition <strong>to</strong> provide quality rail services at reasonable prices; establish a longterm<br />
partnership between the states and the Federal Government <strong>to</strong> support<br />
intercity passenger rail service; and create an effective public partnership, after a<br />
reasonable transition, <strong>to</strong> manage the capital assets of the Northeast Corridor.<br />
These principles have essentially guided the Administration’s budget deliberations<br />
between FFY 2003 and FFY 20<strong>06</strong>.<br />
For FFY 2003, Congress approved $1.05 billion in Amtrak appropriations and<br />
deferred repayment of its $100 million FFY 2002 loan. While this amount was<br />
less than Amtrak’s original $1.2 billion request for FFY 2003, it was significantly<br />
more than the Administration’s initial budget proposal of $521 million.<br />
FFY 2004 BUDGET AND LEGISLATIVE REFORM PROPOSALS<br />
In July 2003, the Administration submitted the “Passenger <strong>Rail</strong> Investment<br />
Reform Act of 2003” (S. 1501) <strong>to</strong> Congress that embodied the five principles<br />
listed above. In August 2003, four Republican Sena<strong>to</strong>rs, led by Kay Bailey<br />
Hutchison of Texas, introduced the “American <strong>Rail</strong> Equity Act of 2003” (S. 1505)<br />
as an alternative proposal <strong>to</strong> the Administration’s bill. S. 1505 significantly<br />
increased Federal operating and capital support for Amtrak. However, neither<br />
legislative proposal moved forward as Congress focused on Amtrak’s<br />
appropriation level for FFY 2004. The FFY04 final appropriations bill included<br />
$1.2 billion for Amtrak, below the $1.8 billion requested by Amtrak but enough <strong>to</strong><br />
continue <strong>to</strong> operate the national system.<br />
155
<strong>2005</strong>-<strong>06</strong> – <strong>2015</strong>-<strong>16</strong> <strong>California</strong> <strong>State</strong> <strong>Rail</strong> <strong>Plan</strong><br />
FFY <strong>2005</strong> BUDGET AND LEGISLATIVE REFORM PROPOSALS<br />
In 2004, Congress was primarily engaged in reauthorizing surface transportation<br />
programs and discussions on the future of Amtrak and intercity rail <strong>to</strong>ok a back<br />
seat. Amtrak’s FY <strong>2005</strong>-2009 Strategic <strong>Plan</strong> called for an annual Federal<br />
appropriations level of $1.6 billion, which would allow Amtrak <strong>to</strong> make progress<br />
on its goal <strong>to</strong>ward achieving a state-of-good-repair. Amtrak initially requested<br />
$1.8 billion from Congress for FFY <strong>2005</strong>, but revised it downward <strong>to</strong> $1.5 billion<br />
based on the ability <strong>to</strong> advance a number of capital projects. In November 2004,<br />
Congress appropriated $1.2 billion for FFY <strong>2005</strong> funding, which included a<br />
$20 million portion of a five-year repayment for the FFY 2002 loan of<br />
$100 million. Amtrak was able <strong>to</strong> operate throughout FFY <strong>2005</strong> within this<br />
appropriation level by drawing down on its working capital reserves.<br />
FFY 20<strong>06</strong> BUDGET AND LEGISLATIVE REFORM PROPOSALS<br />
The Administration opened the FFY 20<strong>06</strong> Amtrak budget deliberations in April<br />
with a proposal that was identical <strong>to</strong> the “Passenger <strong>Rail</strong> Investment Reform Act<br />
of 2003” and proposed zero funding for Amtrak unless reforms were instituted.<br />
This proposal was introduced as H.R. 1713 in April <strong>2005</strong>. Amtrak’s FY 20<strong>06</strong><br />
proposal was contained in their Amtrak Strategic Reform Initiatives and FY <strong>06</strong><br />
Grant Request discussed above. The requested funding level was $1.82 billion.<br />
A bi-partisan bill introduced by Sena<strong>to</strong>rs Lautenberg and Lott (S. 15<strong>16</strong>) was<br />
introduced in July <strong>2005</strong> that averaged about $1.9 billion in funding over the six<br />
years of the bill’s reauthorization.<br />
In June, the full House approved an Amtrak appropriations level of $1.2 billion,<br />
and in July the Senate Appropriations Committee approved a $1.45 billion<br />
appropriations level.<br />
In late November, the President signed “The Transportation and Related Agencies<br />
Appropriations Bill” for FFY <strong>06</strong>. It includes $1.315 billion in funding for Amtrak,<br />
including $780 million for capital projects with $280 million maximum for debt<br />
service, $495 million for operations, and $40 million for efficiency incentive<br />
grants.<br />
156
Chapter XII – Intercity <strong>Rail</strong> Funding<br />
CHAPTER XII<br />
INTERCITY RAIL FUNDING<br />
Funding for intercity rail systems comes primarily from <strong>State</strong> sources, but also<br />
includes local, Federal, Amtrak, and railroad funding sources. Below is an<br />
overview of these funding sources.<br />
PUBLIC TRANSPORTATION ACCOUNT<br />
The PTA is the exclusive source of intercity rail operating funds and a potential<br />
source of intercity rail capital funds. Proposition 1<strong>16</strong> designated the PTA as a<br />
trust fund <strong>to</strong> be used “only for transportation planning and mass transportation<br />
purposes.” (Section 99310.5 of the Public Utilities Code)<br />
USE OF PTA FUNDS<br />
The Public Utilities Code (Sections 99312 and seq.) governs the uses of PTA<br />
funds that are derived from sales tax revenues. Fifty percent of these revenues go<br />
<strong>to</strong> the <strong>State</strong> Transit Assistance (STA) Program, which assists local entities in<br />
funding transit service. The remaining monies are available <strong>to</strong> fund a number of<br />
<strong>State</strong> programs including: intercity rail operations; rail, mass transportation, and<br />
planning staff support; and mass transit capital projects.<br />
In the recent past PTA has not been used for capital projects, but the 2001-02 <strong>State</strong><br />
Budget included $91 million in PTA funds earmarked for intercity rail capital<br />
projects. Currently, Proposition 42 requires that PTA funds be included in the<br />
STIP. Thus, future STIPs will include PTA funds, subject <strong>to</strong> availability.<br />
FUNDING SOURCES<br />
Statute provides five main sources of funds for the PTA: a portion of <strong>State</strong> sales<br />
tax on diesel fuel, a portion of sales tax on gasoline, non-gas tax revenues in the<br />
SHA, TCRP/Proposition 42 funds, and the “spillover.”<br />
• Sales Tax on Diesel Fuel - The PTA’s traditional source of funding is a<br />
4.75 percent portion of the seven percent <strong>State</strong> sales tax on diesel fuel, which<br />
in <strong>2005</strong>-<strong>06</strong> was $2<strong>06</strong> million.<br />
• Sales Tax on Gasoline - A 4.75 percent portion of the 7.25 percent <strong>State</strong> sales<br />
tax on nine cents of the <strong>State</strong>’s 18-cent excise tax on gasoline goes <strong>to</strong> the PTA.<br />
Proposition 111, enacted in 1989, established this funding source. In <strong>2005</strong>-<strong>06</strong>,<br />
this source was $68 million.<br />
157
<strong>2005</strong>-<strong>06</strong> – <strong>2015</strong>-<strong>16</strong> <strong>California</strong> <strong>State</strong> <strong>Rail</strong> <strong>Plan</strong><br />
• Non-Article XIX Revenues in the SHA - The TCRP Program (Chapter 91,<br />
Statutes of 2000) authorized the annual transfer, starting in 2001-02, of all<br />
non-Article XIX tax revenue funds in the SHA <strong>to</strong> the PTA. These SHA funds<br />
are derived from the sale of documents, charges for miscellaneous services <strong>to</strong><br />
the public, rental of <strong>State</strong> property, etc. In <strong>2005</strong>-<strong>06</strong> this source was<br />
$53 million.<br />
• TCRP Program/Proposition 42 Funding – The TCRP established by Chapter<br />
91, Statutes of 2000 (AB 2928, Torlakson) was intended <strong>to</strong> provide significant<br />
additional funding <strong>to</strong> a specific list of TCRP transportation projects and <strong>to</strong> the<br />
PTA from 2001-02 through <strong>2005</strong>-<strong>06</strong>. The major new source of funding was<br />
gasoline sales tax revenues that had previously gone <strong>to</strong> the GF and would<br />
instead go <strong>to</strong> the new Transportation Investment Fund (TIF). The PTA would<br />
receive 20 percent of this gasoline sales tax revenue. However, soon after the<br />
TCRP was enacted, the <strong>State</strong> experienced a fiscal crisis, and Chapter 112,<br />
Statutes of 2001 (AB 438) delayed the transfer of sales tax revenues <strong>to</strong> the TIF,<br />
<strong>to</strong> begin in 2003-04, and <strong>to</strong> continue through 2007-08.<br />
Then, Proposition 42 in March 2002 added Article XIX B <strong>to</strong> the <strong>California</strong><br />
Constitution that eliminated the original sunset date for the TIF and continued<br />
the original TCRP program through 2007-08. Also, beginning in 2008-09, it<br />
makes permanent the transfer of gasoline sales tax revenue <strong>to</strong> the TIF on a<br />
formula basis: 20 percent of the transfers will go the PTA with one-half of this<br />
amount for STIP projects, 40 percent <strong>to</strong> the SHA for STIP projects, and<br />
40 percent for subventions <strong>to</strong> cities and counties for local streets and roads.<br />
Starting in 2008-09, no further funds will go <strong>to</strong> TCRP projects, so formula<br />
funds <strong>to</strong> the PTA, STIP, and local streets and roads will increase. In 2003-04<br />
and 2004-05, the transfers were suspended and are required <strong>to</strong> be paid back by<br />
2008-09.<br />
The <strong>2005</strong>-<strong>06</strong> Budget for the first time provided the PTA funds from the TIF.<br />
$127 went <strong>to</strong> the PTA, with half ($63.5 million) of those funds for STIP<br />
projects and half ($63.5 million) for the STA Program.<br />
• “Spillover” – These revenues are available when revenues from the gasoline<br />
sales tax at the 4.75 percent rate exceed revenues from all taxable sales at the<br />
0.25 percent rate. This source was initiated when the sales tax on gasoline was<br />
established in 1972. For many years there was no spillover, but since 2002-03<br />
there has been a spillover as a result of high gas prices. However, the PTA did<br />
not receive any of these funds due <strong>to</strong> annual legislative action.<br />
158
Chapter XII – Intercity <strong>Rail</strong> Funding<br />
REPAYMENTS TO THE PTA<br />
The Statute specifies that the TIF suspensions in 2003-04 and 2004-05 were loans<br />
that are required <strong>to</strong> be repaid from the Transportation Deferred Investment Fund<br />
(TDIF) by 2008-09. A <strong>to</strong>tal of $212 million was suspended in 2003-04 and<br />
2004-05.<br />
Additionally, a <strong>to</strong>tal of $275 million was loaned from the PTA <strong>to</strong> the TCRF<br />
($180 million in 2001-02 and $95 million in 2002-03) and is scheduled <strong>to</strong> be<br />
repaid by June 30, 2008. The <strong>2005</strong>-<strong>06</strong> Budget anticipated that $122.5 million<br />
would be repaid from bonds backed by tribal gaming revenues. But due <strong>to</strong><br />
pending litigation on these bonds, the $122.5 million has not yet been repaid, and<br />
it is uncertain when these bonds will be sold.<br />
STATE HIGHWAY ACCOUNT<br />
The bulk of the SHA supports the <strong>State</strong>’s highway system, but a portion of the<br />
account also supports rail projects in the STIP. The SHA receives its funds from<br />
<strong>State</strong> gasoline and diesel fuel taxes, <strong>State</strong> vehicle weight fees and reimbursements<br />
from the Federal Trust Fund for Federal-aid projects. Use of the <strong>State</strong> generated<br />
portion of the SHA is governed by Article XIX of the <strong>State</strong> Constitution that<br />
allows the funds <strong>to</strong> be used for research, planning, construction, improvement,<br />
maintenance, and operation of public streets and highways. Additionally, the SHA<br />
can be used for the research, planning, construction, and improvement of public<br />
mass transit guideways (which includes intercity, commuter and urban rail, and<br />
electric trolley bus services) and their fixed facilities. The SHA cannot be used for<br />
mass transit vehicle acquisition or maintenance, or mass transit operating costs.<br />
The 1989 Blueprint Legislation allowed intercity rail projects <strong>to</strong> compete for SHA<br />
funds in the STIP. Then Chapter 622, Statutes of 1997 (SB 45 - Kopp), reserved<br />
for intercity rail and grade separation projects a minimum of nine percent of the<br />
interregional portion of the STIP as part of the ITIP. SB 45 also allowed intercity<br />
rail projects <strong>to</strong> be programmed in the RTIP. As a result, in the 1996 through 2002<br />
STIP biennial cycles, a <strong>to</strong>tal of $468.6 million were programmed for intercity rail<br />
projects from the SHA. Of this amount, $331.3 million has been allocated.<br />
However, as a result of <strong>State</strong> funding constraints, between May 2003 and July<br />
<strong>2005</strong>, only three intercity passenger rail project allocation requests have been<br />
approved for a <strong>to</strong>tal of $11.3 million. The remaining unallocated 2002 STIP<br />
intercity passenger rail projects were included in the 2004 STIP. All 2004 STIP<br />
projects in the 2004-05 year that could not be funded due <strong>to</strong> funding constraints<br />
were moved forward <strong>to</strong> the <strong>2005</strong>-<strong>06</strong> year (in the 2004 STIP).<br />
159
<strong>2005</strong>-<strong>06</strong> – <strong>2015</strong>-<strong>16</strong> <strong>California</strong> <strong>State</strong> <strong>Rail</strong> <strong>Plan</strong><br />
TRAFFIC CONGESTION RELIEF FUND<br />
Chapter 91, Statutes of 2000 (AB 2928 - Torlakson), established the TCRP <strong>to</strong> be<br />
funded from the TCRF. The TCRP specified a list of projects <strong>to</strong> be funded from<br />
the Program, including $2<strong>06</strong>.5 million for specific intercity rail capital projects.<br />
The section above on the PTA describes in general the funding sources for the<br />
TCRP.<br />
Through July <strong>2005</strong>, $42.6 million was allocated from the TCRF <strong>to</strong> intercity rail<br />
projects. In August <strong>2005</strong>, an additional $86.8 million was allocated, for a <strong>to</strong>tal of<br />
$129.4 million. As a result of the Proposition 42 transfer in <strong>2005</strong>-<strong>06</strong>, it is<br />
expected that other TCRP rail projects will also be funded.<br />
TRIBAL COMPACT BONDS<br />
Chapter 91, Statutes of 2004 (AB 687, Nunez) ratified amendments <strong>to</strong> the Tribal-<br />
<strong>State</strong> Gaming compacts negotiated by the Governor and five tribes with gaming<br />
income. The bill authorized the issuance of bonds, secured by up <strong>to</strong> $1.5 billion in<br />
Indian gaming revenue, <strong>to</strong> be dedicated for transportation improvement purposes.<br />
Based on the statute, the PTA would receive $275 million, the SHA would receive<br />
$477 million, the TCRP would receive $453 million, and $192 million would go<br />
<strong>to</strong> local streets and roads. However, the <strong>2005</strong>-<strong>06</strong> Budget authorizes $1 billion in<br />
tribal bond income <strong>to</strong> be used <strong>to</strong> pay most of a <strong>2005</strong>-<strong>06</strong> $1.2 billion GF loan<br />
commitment <strong>to</strong> the TCRF. The remaining $200 million, plus interest, would be<br />
repaid from revenues resulting from future tribal gaming compacts if more<br />
compacts are negotiated. If tribal gaming revenues are not sufficient <strong>to</strong> cover any<br />
part of the $1.2 billion owed, the remainder would be repaid from the GF by<br />
July 1, 2021. However, pending litigation makes the timing of the bond sales and<br />
resulting revenue uncertain.<br />
THE PASSENGER RAIL AND CLEAN AIR BOND ACT OF 1990<br />
(PROPOSITION 108)<br />
The 1989 Blueprint Legislation authorized three $1 billion rail bond measures <strong>to</strong><br />
be placed on the ballot in 1990, 1992, and 1994. In 1990, the voters approved the<br />
first $1 billion rail bond measure, The Passenger <strong>Rail</strong> and Clean Air Bond Act of<br />
1990. To date, almost all bond proceeds have been used <strong>to</strong> fund new rail projects<br />
and improvements <strong>to</strong> existing systems, including $225 million for intercity rail<br />
capital projects. The voters did not approve the subsequent two bond measures in<br />
1992 and 1994.<br />
<strong>16</strong>0
Chapter XII – Intercity <strong>Rail</strong> Funding<br />
CLEAN AIR AND TRANSPORTATION IMPROVEMENT ACT<br />
OF 1990 (PROPOSITION 1<strong>16</strong>)<br />
Proposition 1<strong>16</strong> provided a $1.99 billion one-time source of funding for rail and<br />
transit projects. Proposition 1<strong>16</strong> contained about $382 million for intercity rail<br />
capital projects, $1.37 billion for urban and commuter rail projects, and<br />
$235 million for other transit and transit related projects. Most of these bond<br />
funds have been allocated.<br />
GENERAL FUND<br />
The General Fund can be used for rail projects if there is a specific appropriation<br />
in the budget. Since 1975-76, only the 1999-00 and 2000-01 <strong>State</strong> Budgets have<br />
provided GF money for intercity rail capital projects. The 1999-00 Budget<br />
included $17.5 million for new intercity rail rolling s<strong>to</strong>ck and the 2000-01 Budget<br />
also provided $30 million for this purpose.<br />
LOCAL FUNDS<br />
Although intercity rail passenger services are funded primarily by the <strong>State</strong>,<br />
a substantial amount of local funds have been invested, mainly on the<br />
Pacific Surfliner Route <strong>to</strong> fund commuter rail development. These funds serve <strong>to</strong><br />
enhance commuter rail service improving tracks, signals and stations also used by<br />
intercity trains. Also, intercity rail stations are often owned by cities and funded<br />
with local revenue in addition <strong>to</strong> STIP funding. The Department will work with<br />
local and regional entities that may wish <strong>to</strong> fund higher levels of service than <strong>State</strong><br />
resources are able <strong>to</strong> provide.<br />
FEDERAL FUNDS<br />
Federal transportation funds from various programs are used for intercity rail<br />
projects. In particular, funding has been provided for station projects from the<br />
FTA Section 5307 and 5309 capital programs. However, Federal flexible<br />
transportation funds, such as are provided through the Surface Transportation<br />
Program, are generally not available for intercity rail projects.<br />
In the <strong>2005</strong> Congressional session, Amtrak reform proposals have been introduced<br />
that include Federal funding for intercity rail passenger capital programs.<br />
SB 15<strong>16</strong> (Passenger <strong>Rail</strong> Investment and Improvements Act of <strong>2005</strong>), a bi-partisan<br />
Congressional bill, proposes an 80 percent Federal/20 percent state capital match<br />
program for state intercity passenger rail investment. $4.9 billion in GFs are<br />
proposed for the program over the six years of the bill (FFY 20<strong>06</strong>-2011). The bill<br />
also authorizes tax credit bonds for capital projects, not <strong>to</strong> exceed $1.3 billion<br />
through <strong>2015</strong>. Also, House Resolution 1713, the Administration backed bill,<br />
<strong>16</strong>1
<strong>2005</strong>-<strong>06</strong> – <strong>2015</strong>-<strong>16</strong> <strong>California</strong> <strong>State</strong> <strong>Rail</strong> <strong>Plan</strong><br />
proposes a 50 percent Federal/50 percent state capital match program, with no<br />
funding source specified.<br />
AMTRAK FUNDS<br />
On the operating side, Amtrak supports 30 percent of the Pacific Surfliner Route,<br />
as this portion is considered part of their Basic System, and not <strong>State</strong>-supported<br />
service.<br />
On the capital side, Amtrak develops and funds some <strong>California</strong> intercity rail<br />
capital projects. The largest investment has been in maintenance facilities and<br />
rolling s<strong>to</strong>ck. As a result of the Taxpayer Relief Act of 1997, Amtrak was<br />
provided over $2 billion in capital funds for its nationwide system. Over the past<br />
six years, Amtrak has increased its investment in <strong>California</strong>. For example, Amtrak<br />
purchased 40 new passenger cars and 14 locomotives for the Pacific Surfliner<br />
Route at a cost of about $135 million. See Chapter XI for a list of the proposed<br />
<strong>California</strong> projects included in Amtrak’s Strategic <strong>Plan</strong> for FFY <strong>2005</strong>-09.<br />
RAILROAD FUNDS<br />
The <strong>State</strong> and the railroads owning the ROW of intercity passenger routes<br />
sometimes share in the cost of track and signal improvement projects.<br />
<strong>16</strong>2
Chapter XIII – Environment and Land Use<br />
CHAPTER XIII<br />
ENVIRONMENT AND LAND USE<br />
ENVIRONMENTAL GOALS FOR THE INTERCITY<br />
PASSENGER RAIL PROGRAM<br />
The Department has established ten-year goals for the Intercity Passenger <strong>Rail</strong><br />
Program related <strong>to</strong> congestion relief, travel mode share, air quality, and energy<br />
efficiency.<br />
By 20<strong>16</strong> as the result of intercity rail travel:<br />
• Congestion Relief - cut annual vehicle miles traveled in the <strong>State</strong> by a <strong>to</strong>tal<br />
of 433 million miles (a net reduction of 178 million annual vehicle miles<br />
traveled compared with <strong>2005</strong>).<br />
• Travel Mode Share - increase the intercity rail mode share by 2½ <strong>to</strong><br />
3 times.<br />
• Air Quality:<br />
o Continue <strong>to</strong> achieve a net annual decrease in pollution from<br />
hydrocarbons and carbon monoxide in the <strong>State</strong>.<br />
o Continue <strong>to</strong> keep emissions on all <strong>State</strong>-owned locomotives below <strong>State</strong><br />
and Federal maximum allowable levels for all pollutants.<br />
• Energy Efficiency - save the <strong>State</strong> a net of almost 11 million gallons of<br />
gasoline annually.<br />
CONGESTION RELIEF<br />
The impact of intercity rail on congestion was measured by calculating the vehicle<br />
miles saved as a result of intercity rail passenger services. The first step in the<br />
calculation was estimating the vehicle (au<strong>to</strong>mobile) miles that would be saved by<br />
passengers using <strong>State</strong>-supported intercity rail service in <strong>2005</strong> and the expanded<br />
service proposed in the <strong>State</strong> <strong>Rail</strong> <strong>Plan</strong> for 20<strong>16</strong>. To determine vehicle miles<br />
saved, first the number of <strong>State</strong>-supported intercity train passenger miles for each<br />
year was estimated. Then an average vehicle occupancy rate of 1.43 passengers<br />
per au<strong>to</strong>mobile was applied <strong>to</strong> the passenger miles <strong>to</strong> derive vehicle miles saved in<br />
each of the two years (<strong>2005</strong> and 20<strong>16</strong>). The vehicle miles saved as a result of<br />
<strong>State</strong>-supported intercity rail service were 270 million miles in <strong>2005</strong> and<br />
433 million miles in 20<strong>16</strong>, for a net reduction of 178 million vehicle miles.<br />
<strong>16</strong>3
<strong>2005</strong>-<strong>06</strong> – <strong>2015</strong>-<strong>16</strong> <strong>California</strong> <strong>State</strong> <strong>Rail</strong> <strong>Plan</strong><br />
The Department’s congestion relief goal is <strong>to</strong> cut annual vehicle miles<br />
traveled in the <strong>State</strong> by a <strong>to</strong>tal of 433 million miles by 20<strong>16</strong> (a net reduction of<br />
178 million annual vehicle miles traveled compared with <strong>2005</strong>) as a result of<br />
intercity rail travel.<br />
TRAVEL MODE SHARE<br />
Already 98 percent of the <strong>State</strong>'s population lives in counties served by the <strong>State</strong>supported<br />
intercity rail and connecting bus network. The challenge is <strong>to</strong> increase<br />
the share of the population that will ride the intercity rail and connecting buses.<br />
As already demonstrated in <strong>California</strong> and elsewhere, people will ride intercity<br />
trains and connecting buses if they are frequent, reliable, and provide competitive<br />
travel times. In terms of train frequency, the <strong>State</strong>-supported intercity rail service<br />
will become a significantly more competitive travel mode when the 39 daily<br />
statewide round-trips proposed as ten-year goals in the <strong>State</strong> <strong>Rail</strong> <strong>Plan</strong> are<br />
implemented (13 on the Pacific Surfliner Route, 8 on the San Joaquin Route, and<br />
18 on the Capi<strong>to</strong>l Corridor) as compared <strong>to</strong> 29 round-trips in <strong>2005</strong>.<br />
In June <strong>2005</strong>, Amtrak conducted travel research in Northern and Southern<br />
<strong>California</strong> <strong>to</strong> determine travel metrics and mode usage. Based on the data from<br />
the study, the <strong>2005</strong> mode share for intercity rail along the Pacific Surfliner Route<br />
was 5 percent, and 3 percent for the Capi<strong>to</strong>l Corridor and San Joaquin Routes.<br />
For this analysis, the corridors served by the Capi<strong>to</strong>l Corridor and San Joaquins<br />
were combined because many of their population areas overlap. By comparison,<br />
the study found that air travel in both the northern and southern <strong>California</strong><br />
corridors had a mode share of 14 percent.<br />
The <strong>Rail</strong> Ridership/Revenue Forecasting Model was then used <strong>to</strong> generate the<br />
forecasts of the ridership increases that can be expected as a result of the<br />
improvements proposed in the <strong>State</strong> <strong>Rail</strong> <strong>Plan</strong> (its methodology is summarized in<br />
Chapter IV). The frequency increases mentioned above, <strong>to</strong>gether with the other<br />
improvements proposed for the ten-year period through 20<strong>16</strong>, are projected <strong>to</strong><br />
raise the intercity rail mode share for the <strong>State</strong>-supported routes by 2.5 <strong>to</strong> 3 times<br />
compared <strong>to</strong> <strong>2005</strong>. The Pacific Surfliner Route is projected <strong>to</strong> have a mode share<br />
of between 12.5 and 15 percent, while the combined Capi<strong>to</strong>l Corridor and<br />
San Joaquin Route are projected <strong>to</strong> have a mode share of between 7.5 and<br />
9 percent. These thresholds approach the 14 percent mode share for air travel in<br />
these corridors. Achieving such a mode share would demonstrate that intercity<br />
rail is providing a true alternative mode for travelers.<br />
The Department’s travel mode share goal is <strong>to</strong> increase the intercity rail<br />
mode share by 2.5 <strong>to</strong> 3 times by 20<strong>16</strong>.<br />
<strong>16</strong>4
Chapter XIII – Environment and Land Use<br />
AIR QUALITY<br />
Two pollutants were examined in addressing air quality: hydrocarbons and carbon<br />
monoxide. These were measured in grams of pollutants. The pollution saved by<br />
the reductions in vehicle miles from <strong>2005</strong> <strong>to</strong> 20<strong>16</strong>, were compared <strong>to</strong> the increases<br />
in train pollution resulting from the increases in train miles for the same period.<br />
The first step in the comparison is converting the vehicle miles saved as a result of<br />
<strong>State</strong>-supported intercity rail service in <strong>2005</strong> and 20<strong>16</strong> (described above under<br />
Congestion Relief) <strong>to</strong> au<strong>to</strong>mobile emissions. To do this, the vehicle miles saved<br />
were multiplied by the average pollutants per vehicle mile for the typical<br />
au<strong>to</strong>mobile in <strong>California</strong>. Next, the train miles estimated <strong>to</strong> be operated by the<br />
three <strong>State</strong>-supported services in <strong>2005</strong> and 20<strong>16</strong> were calculated. The <strong>to</strong>tal<br />
amount of au<strong>to</strong>mobile pollution saved due <strong>to</strong> the new train services were then<br />
compared directly <strong>to</strong> the additional pollutants generated by the increased train<br />
miles generated by the added train services. The analysis showed a net annual<br />
decrease in pollution from hydrocarbons and carbon monoxide.<br />
The Department’s first air quality goal is <strong>to</strong> continue <strong>to</strong> achieve a net annual<br />
decrease in pollution from hydrocarbons and carbon monoxide in the <strong>State</strong><br />
through 20<strong>16</strong> as a result of intercity rail travel.<br />
In addition, the U.S. Environmental Protection Agency has instituted new<br />
emissions requirements for diesel locomotives. F59 locomotives, the type that is<br />
predominantly used in the <strong>State</strong>-supported rail system, meet the Tier 0<br />
requirements, which went in<strong>to</strong> effect in 2001. The <strong>State</strong> had ordered F59s that met<br />
this requirement before being required <strong>to</strong> do so. The next set of standards, called<br />
Tier 1, <strong>to</strong>ok effect on January 1, 2004 and requires that passenger locomotives<br />
purchased after that date emit 25 percent less nitrogen oxides (Nox) and 33 percent<br />
less particulates than previously allowed. Tier 2 standards, which <strong>to</strong>ok effect on<br />
January 1, <strong>2005</strong>, required that passenger locomotives purchased after that date<br />
emit 35 percent less NOx and less than half the particulates than previously<br />
allowed. Additionally, the Department plans <strong>to</strong> purchase devices <strong>to</strong> attach <strong>to</strong> the<br />
diesel locomotives that will further reduce fuel consumption and air emissions.<br />
The Department’s second air quality goal is <strong>to</strong> continue <strong>to</strong> keep emissions on<br />
all <strong>State</strong>-owned locomotives below <strong>State</strong> and Federal maximum allowable<br />
levels for all pollutants and <strong>to</strong> pursue funding for research and development<br />
in<strong>to</strong> cleaner locomotive engines.<br />
ENERGY EFFICIENCY<br />
To address energy efficiency, the energy use from the au<strong>to</strong>mobile trips that would<br />
be avoided due <strong>to</strong> expanded intercity rail passenger services included in the <strong>State</strong><br />
<strong>Rail</strong> <strong>Plan</strong> were compared <strong>to</strong> the additional energy use resulting from these<br />
expanded intercity rail passenger services. The analysis used <strong>2005</strong> as the base<br />
year and 20<strong>16</strong> as the final year.<br />
<strong>16</strong>5
<strong>2005</strong>-<strong>06</strong> – <strong>2015</strong>-<strong>16</strong> <strong>California</strong> <strong>State</strong> <strong>Rail</strong> <strong>Plan</strong><br />
In order <strong>to</strong> convert vehicle miles <strong>to</strong> energy use, the vehicle miles saved as a result<br />
of use of <strong>State</strong>-supported intercity rail service in <strong>2005</strong> and 20<strong>16</strong> were multiplied<br />
by the average amount of energy use per vehicle mile, as expressed in British<br />
Thermal Units (BTUs), for the average au<strong>to</strong>mobile in <strong>California</strong>. Next, the energy<br />
use resulting from train miles <strong>to</strong> be operated by the three <strong>State</strong>-supported services<br />
in <strong>2005</strong> and 20<strong>16</strong> were converted <strong>to</strong> BTUs. The <strong>to</strong>tal amount of au<strong>to</strong>mobile<br />
energy use saved due <strong>to</strong> the new train services was then compared directly <strong>to</strong> the<br />
additional energy use generated by the increased train miles operated by the added<br />
train services.<br />
The vehicle miles saved for <strong>2005</strong> would have otherwise resulted in the<br />
consumption of 12.3 million gallons of gasoline. Concurrently, the train miles<br />
traveled in <strong>2005</strong> would result in the usage of diesel fuel equivalent <strong>to</strong><br />
6.8 million gallons of gasoline. The result is a net saving of 4.6 million gallons of<br />
gasoline in <strong>2005</strong>, or over 12,500 gallons of gasoline per day.<br />
The increase in annual vehicle miles saved in 20<strong>16</strong>, as compared <strong>to</strong> <strong>2005</strong>, would<br />
result in saving an additional 8.9 million gallons of gasoline in 20<strong>16</strong>. Further, the<br />
additional train miles traveled in 20<strong>16</strong>, compared <strong>to</strong> <strong>2005</strong>, would result in the<br />
usage of additional diesel fuel in 20<strong>16</strong> equivalent <strong>to</strong> 2.7 million gallons of<br />
gasoline. The result is a net saving of 6.2 million additional gallons of gasoline in<br />
20<strong>16</strong>, compared <strong>to</strong> <strong>2005</strong>, or a <strong>to</strong>tal of 10.8 million gallons of gasoline conserved<br />
annually by 20<strong>16</strong>.<br />
The Department’s energy efficiency goal is <strong>to</strong> save the <strong>State</strong> a net of almost<br />
11 million gallons of gasoline annually by 20<strong>16</strong> as a result of intercity rail<br />
travel.<br />
LAND USE<br />
The Department supports efforts by cities, counties, and private developers <strong>to</strong><br />
promote transit-oriented development projects near Amtrak stations that enhance<br />
community livability by providing housing options, jobs, retail, and services<br />
within easy walking distance of the station. The following are examples of<br />
Amtrak stations where transit-oriented development has recently occurred or is<br />
planned.<br />
Bakersfield – The new Bakersfield station opened <strong>to</strong> the public in July 2000.<br />
The station, about one mile east of the former Bakersfield Amtrak s<strong>to</strong>p, is much<br />
closer <strong>to</strong> down<strong>to</strong>wn in the heart of the civic center entertainment complex, which<br />
includes the Bakersfield Convention Center and Centennial Garden Arena.<br />
While down<strong>to</strong>wn is on the northwest side of the station, a new development plan<br />
calls for building an entertainment-retail complex called River Walk Plaza on<br />
20 <strong>to</strong> 25 acres <strong>to</strong> the south of the station. Included in the proposal are an ice rink,<br />
movie theater, other recreational facilities, retail, and office space. In addition,<br />
construction is underway on 180 units of senior housing across the street from the<br />
<strong>16</strong>6
Chapter XIII – Environment and Land Use<br />
proposed River Walk Plaza location. Two 80-unit complexes of multi-family<br />
affordable housing have also been proposed for construction in the same area in<br />
the next two <strong>to</strong> three years. Another development proposal calls for building<br />
12,000 square feet of office space adjacent <strong>to</strong> the Amtrak parking lot <strong>to</strong> house the<br />
Convention and Visi<strong>to</strong>rs Bureau, which would provide a convenient s<strong>to</strong>pping<br />
point for <strong>to</strong>urist information for San Joaquin passengers. Bakersfield is served by<br />
an extensive network of Amtrak thruway buses in addition <strong>to</strong> Golden Empire<br />
Transit and Kern Regional Transit bus service.<br />
Berkeley – Several mixed-use buildings featuring 150 residential units above<br />
ground floor retail are planned for the block adjacent <strong>to</strong> the rail s<strong>to</strong>p.<br />
A long-established restaurant plans <strong>to</strong> move one block in<strong>to</strong> the his<strong>to</strong>ric Southern<br />
Pacific <strong>Rail</strong>road train station. Around this development, there are also plans <strong>to</strong><br />
provide mostly privately developed new streets, sidewalks, landscaping, ADA<br />
accessibility, and bike signs <strong>to</strong> formalize the connection between the commercial<br />
area and the pedestrian/bike bridge over I-80 next <strong>to</strong> the Amtrak s<strong>to</strong>p. Across the<br />
tracks, just south of the new platform, a former live/work warehouse has been<br />
bought and will be renovated. Berkeley is served by local transit.<br />
Emeryville – In 1998, construction began on the first phase of a project for<br />
a three-building, 550,000 square foot mixed-use complex on the north, east and<br />
south sides of the Amtrak station. The first phase was a 240,000 square foot,<br />
five-s<strong>to</strong>ry office building with ground floor retail and two levels of parking below.<br />
The second phase that consists of 170,000 square feet of office space was<br />
completed in 2001. The project also includes 101 owner-occupied lofts and <strong>to</strong>wn<br />
homes, plus senior housing. The site was formerly industrial and had remained<br />
vacant for over 20 years before the City coordinated and facilitated <strong>to</strong>xic<br />
remediation and redevelopment of the site. The next phase will consist of<br />
100 units of rental apartments, with at least 20 percent set aside as affordable<br />
housing. The station is served by the Capi<strong>to</strong>l Corridor, San Joaquin,<br />
Coast Starlight and <strong>California</strong> Zephyr long-distance Amtrak trains, AC Transit<br />
buses, and the Emery Go-Round free shuttle bus that connects <strong>to</strong> the MacArthur<br />
BART station and various businesses, work sites, and retail and entertainment<br />
centers.<br />
Fresno – The his<strong>to</strong>ric Fresno Santa Fe Station has been renovated <strong>to</strong> include the<br />
Amtrak station on the first floor with offices and retail facilities on the second<br />
floor. It is scheduled <strong>to</strong> open in late <strong>2005</strong>. In the surrounding area a new Federal<br />
building is nearing completion. An additional multi-functional office building is<br />
also under construction. This building will house some of the Department’s<br />
District Office units, the Internal Revenue Service, Employment Development<br />
offices, law offices and a variety of retail services on the ground floor.<br />
Fresno City Hall and other governmental offices are already located within<br />
walking distance <strong>to</strong> the station. There are several existing restaurants, hotels and<br />
other attractions located near the site. The close proximity of the various business<br />
<strong>16</strong>7
<strong>2005</strong>-<strong>06</strong> – <strong>2015</strong>-<strong>16</strong> <strong>California</strong> <strong>State</strong> <strong>Rail</strong> <strong>Plan</strong><br />
and governmental agencies makes this station a hub for locals and visi<strong>to</strong>rs alike.<br />
The station is also served by Fresno Area Express transit buses.<br />
Fuller<strong>to</strong>n – Two major high-density transit-oriented development projects<br />
adjacent <strong>to</strong> the station were completed for occupancy in 2004. There are<br />
approximately 400 residential units in these two developments, and both include<br />
office and retail space at street level. Residents are eligible <strong>to</strong> receive free<br />
commuter passes through a Metrolink program. A conceptual master plan has<br />
been prepared for the UP Recreation Trail and Neighborhood Park, a one-acre<br />
park with a recreation trail from the station <strong>to</strong> Independence Park.<br />
Fuller<strong>to</strong>n station is served by the Pacific Surfliners, the Amtrak long distance<br />
Southwest Chief, and Metrolink commuter rail.<br />
Hanford – This Central Valley city is known for its his<strong>to</strong>ric down<strong>to</strong>wn that dates<br />
back <strong>to</strong> the 1890s and early 1900s. The main commercial street in the his<strong>to</strong>ric<br />
district is 7th Street, which provides a pedestrian-friendly connection between the<br />
district and the Hanford Amtrak station. This easy pedestrian access makes<br />
traveling on the San Joaquins a convenient way for <strong>to</strong>urists and school field trip<br />
groups <strong>to</strong> visit his<strong>to</strong>ric Hanford. The City is planning <strong>to</strong> extend the pedestrianoriented<br />
street network <strong>to</strong> encompass more of his<strong>to</strong>ric Hanford. <strong>Plan</strong>s call for<br />
widening sidewalks, planting trees, and installing period street lighting and street<br />
furniture further north along 7th Street <strong>to</strong> his<strong>to</strong>ric China Alley. The project will<br />
effectively expand the number of destinations and attractions accessible by foot <strong>to</strong><br />
visi<strong>to</strong>rs arriving by rail, thereby making the train an even more convenient option<br />
for visiting Hanford. The station is served by Amtrak thruway buses and Kings<br />
Area Rural Transit.<br />
Los Angeles Union Station – This landmark station counts the highest ridership<br />
in the entire <strong>State</strong>. Over the last decade, a vibrant transit hub has evolved where<br />
passengers can transfer between <strong>State</strong>-supported Amtrak trains and buses, longdistance<br />
Amtrak trains (Coast Starlight, Southwest Chief, and Sunset Limited),<br />
regional Metrolink commuter trains, Los Angeles Metro subway and light rail<br />
lines, local and regional transit routes, down<strong>to</strong>wn circula<strong>to</strong>r buses, employer and<br />
hotel shuttles, airport vans, and taxis. More recently, new businesses have opened<br />
<strong>to</strong> fulfill service needs brought about by significant growth in passenger activity at<br />
this station. For example, in addition <strong>to</strong> the traditional au<strong>to</strong> rental agencies that<br />
serve these travelers, “carsharing” vehicles are now available on-site by<br />
subscription on an hourly basis, thereby reducing demand for scarce parking<br />
spaces. In the early 1990s, the Los Angeles County Metropolitan Transportation<br />
Authority built its high-rise headquarters alongside a transit plaza adjacent <strong>to</strong> the<br />
eastern entrance, and the Southern <strong>California</strong> Metropolitan Water District <strong>to</strong>ok<br />
occupancy of another new skyscraper <strong>to</strong> the south of the station. A new office<br />
building located in what was the south end of the station’s front parking lot,<br />
between the Metropolitan Water District Building and Alameda Street, has been<br />
completed. Two new mid-rise buildings are under construction fronting<br />
<strong>16</strong>8
Chapter XIII – Environment and Land Use<br />
Cesar Chavez Street. They will feature primarily residential condominium-type<br />
units, plus ground floor office/retail space.<br />
Oakland (Jack London Square) – A large, high-density housing complex was<br />
constructed across the railroad <strong>to</strong> the west of the station. To the north of this<br />
project, the Jack London Square area has undergone a great deal of transformation<br />
in recent years changing from a predominantly industrial port area <strong>to</strong> a busy retail<br />
and entertainment district. Also, major new housing and business projects are<br />
being constructed near the station <strong>to</strong> the east of the railroad. In order <strong>to</strong><br />
accommodate increased ridership at the station, the Department and the<br />
CCJPA are planning <strong>to</strong> widen the platform at the station. The station is served by<br />
the San Joaquin, Capi<strong>to</strong>l Corridor, Coast Starlight trains, Amtrak thruway buses,<br />
and AC Transit. The station is within several blocks of the Oakland-Alameda<br />
Ferry Terminal and the Lake Merritt BART station.<br />
Oakland Coliseum – Service at this station began in June <strong>2005</strong>. This station<br />
provides a direct connection by way of a raised walkway between the<br />
Capi<strong>to</strong>l Corridor and the Coliseum BART station. It will also connect <strong>to</strong> the<br />
planned Oakland Airport Connec<strong>to</strong>r train. Currently, the City is participating in a<br />
collaborative effort <strong>to</strong> develop an Area <strong>Plan</strong> and Redevelopment Strategy for the<br />
Coliseum Redevelopment Area. Due <strong>to</strong> the expected importance of this station<br />
area as a transit hub, the Area <strong>Plan</strong> and Redevelopment Strategy will explore<br />
long-range opportunities <strong>to</strong> create a transit-oriented district.<br />
Richmond – A pedestrian-oriented transit village is under construction at this<br />
station, a transit node where passengers can transfer between BART trains and<br />
San Joaquins or the Capi<strong>to</strong>l Corridor. The station is also served by AC Transit<br />
and Golden Gate Transit. The residential portion of Phase I of the Richmond<br />
Transit Village is completed, comprising 132 <strong>to</strong>wnhouse units. The next phase<br />
includes an additional 99 <strong>to</strong>wnhouses, 27,000 square feet of retail, and<br />
a 30,000 square foot performing and cultural arts facility. In order <strong>to</strong><br />
accommodate increased ridership at the station, the Department and CCJPA<br />
constructed a new center boarding platform at the station with a passenger shelter,<br />
seating, and a new stairwell and eleva<strong>to</strong>r providing a direct connection <strong>to</strong> the<br />
BART station. Construction started on a new Amtrak station building and plaza in<br />
Oc<strong>to</strong>ber <strong>2005</strong> and will take about a year <strong>to</strong> complete. It will include restroom<br />
facilities, an Amtrak passenger waiting area, and an information and directional<br />
signage kiosk with an electronic display of real-time train information.<br />
<strong>16</strong>9
<strong>2005</strong>-<strong>06</strong> – <strong>2015</strong>-<strong>16</strong> <strong>California</strong> <strong>State</strong> <strong>Rail</strong> <strong>Plan</strong><br />
San Diego – A high-density condominium project adjacent <strong>to</strong> the station has<br />
recently been completed. The first <strong>to</strong>wer was completed in 2004 and the initial<br />
residential units have been occupied. A second residential <strong>to</strong>wer was completed in<br />
<strong>2005</strong>. Also, ground was broken in Oc<strong>to</strong>ber <strong>2005</strong> on an innovative project that will<br />
combine art museum facilities and rail maintenance and supply s<strong>to</strong>rage space.<br />
Construction has begun on a major high-rise residential development within the<br />
perimeter of the His<strong>to</strong>ric Electrical Building and across the street from the station.<br />
Several other developments with commercial and residential units are being<br />
constructed within walking distance of the rail depot. The station is served by the<br />
Pacific Surfliner and by Coaster commuter rail as well as the San Diego Trolley,<br />
San Diego Transit and Mexicoach buses.<br />
Simi Valley – The City of Simi Valley, in partnership with the County of Ventura,<br />
is considering a transit village plan using a transit-oriented development overlay<br />
zone. The zone would encourage the implementation of transit village design<br />
within a quarter mile radius of the City's multimodal transit station boundaries.<br />
Nearly 650 single-family and multi-family homes are currently under development<br />
or consideration in the proposed overlay area. The proposed transit overlay zone<br />
would include a seven-acre commercial center, a 45-acre park and community<br />
center, 40 acres of other commercial and industrial uses, 75 acres of residential<br />
property, and 20 acres of open space. The City's multimodal transit station is<br />
currently served by Metrolink commuter rail, the Pacific Surfliner, Amtrak’s long<br />
distance Coast Starlight, city buses, Los Angeles County buses, San Joaquin<br />
connecting buses, local taxis and the city's extensive pedestrian/bike trail system.<br />
PROGRESS IN MEETING ENVIRONMENTAL AND LAND<br />
USE GOALS<br />
Figure 13A assesses the Department’s progress in meeting its environmental and<br />
land use goals by comparing the estimated results for 2003-04 presented in the<br />
2003-04 <strong>California</strong> <strong>State</strong> <strong>Rail</strong> <strong>Plan</strong> with the estimated results for <strong>2005</strong>-<strong>06</strong> in the<br />
current <strong>California</strong> <strong>State</strong> <strong>Rail</strong> <strong>Plan</strong>. The figure also compares the future goals in the<br />
2003-04 <strong>Plan</strong> with the future goals in the current <strong>Plan</strong>.<br />
In general, the goals for <strong>2005</strong>-<strong>06</strong> and actual results were consistent. However,<br />
mode share in the southern (Pacific Surfliner) region increased slightly from<br />
3.9 <strong>to</strong> 5 percent, and mode share in the northern (joint San Joaquin and<br />
Capi<strong>to</strong>l Corridor) region decreased slightly from 3.5 <strong>to</strong> 3 percent. Also, gallons of<br />
gasoline saved was more then originally projected.<br />
Also, the goals for 2014 in the 2003-04 <strong>Plan</strong> compared <strong>to</strong> the goals for 20<strong>16</strong> in the<br />
<strong>2005</strong>-<strong>06</strong> <strong>Plan</strong> are close. Again, mode share for the southern corridor increased<br />
somewhat and mode share for the northern corridor decreased slightly. Gallons of<br />
gasoline saved increased by 29 percent and the reduction in vehicle miles traveled<br />
decreased slightly.<br />
170
Chapter XIII – Environment and Land Use<br />
Figure 13A<br />
GOAL<br />
Congestion<br />
Relief<br />
Alternative<br />
Mode of<br />
Transportation<br />
Air Quality<br />
Energy<br />
Efficiency<br />
Land Use<br />
Intercity <strong>Rail</strong> Environmental and Land Use Goals<br />
ESTIMATED<br />
RESULTS<br />
RAIL PLAN GOAL<br />
2003-04 <strong>2005</strong>-<strong>06</strong> 2014 20<strong>16</strong><br />
MEASURE (2003-04 (<strong>2005</strong>-<strong>06</strong> (2003-04 (<strong>2005</strong>-<strong>06</strong><br />
<strong>Rail</strong> <strong>Plan</strong>) <strong>Rail</strong> <strong>Plan</strong>) <strong>Rail</strong> <strong>Plan</strong>) <strong>Rail</strong> <strong>Plan</strong>)<br />
Reduction in<br />
Vehicle Miles<br />
Traveled<br />
Mode Share<br />
South<br />
Mode Share<br />
North<br />
Meet or exceed<br />
Federal diesel<br />
locomotive<br />
standards<br />
Gallons of<br />
Gasoline Saved<br />
Stations with<br />
<strong>Plan</strong>ned or<br />
Developed<br />
Transit Oriented<br />
Development<br />
265<br />
million<br />
270<br />
million<br />
443<br />
million<br />
433<br />
million<br />
3.9% 5% 9.8-11.7% 12.5-15%<br />
3.5% 3% 8.8-10.5% 7.5-9%<br />
Meet<br />
standards<br />
3.7<br />
million<br />
Meet<br />
standards<br />
4.6<br />
million<br />
11 12<br />
Meet<br />
standards<br />
8.4<br />
million<br />
Meet<br />
standards<br />
10.8<br />
million<br />
171
<strong>2005</strong>-<strong>06</strong> – <strong>2015</strong>-<strong>16</strong> <strong>California</strong> <strong>State</strong> <strong>Rail</strong> <strong>Plan</strong><br />
172
PART II<br />
FREIGHT RAIL ELEMENT<br />
173
<strong>2005</strong>-<strong>06</strong> – <strong>2015</strong>-<strong>16</strong> <strong>California</strong> <strong>State</strong> <strong>Rail</strong> <strong>Plan</strong><br />
174
Chapter XIV – Introduction<br />
CHAPTER XIV<br />
INTRODUCTION<br />
<strong>Rail</strong>roads have moved freight in the Golden <strong>State</strong> for almost 150 years. From the<br />
1850s <strong>to</strong> the present, they have served shippers of thousands of commodities in<br />
virtually all parts of the <strong>State</strong>, and have linked <strong>California</strong> with the rest of the nation.<br />
The purpose of this chapter is <strong>to</strong> provide a broad overview of freight rail operations<br />
and associated commerce, business, and institutional issues in <strong>California</strong>.<br />
There are 30 freight railroads in <strong>California</strong>, which own 5,701 miles of track.<br />
The Union Pacific <strong>Rail</strong>road (UP) owns the largest portion of the rail lines with<br />
2,789 miles of track or 49 percent of the <strong>to</strong>tal miles. The BNSF <strong>Rail</strong>way (BNSF)<br />
owns 1,215 miles of track or 21 percent. The remaining 30 percent are owned by<br />
regional and short line railroads. More than 64 million <strong>to</strong>ns of freight rail traffic<br />
originated in the <strong>State</strong> in 2003. Freight rail traffic that terminated in <strong>California</strong> was<br />
even higher, at over 98 million <strong>to</strong>ns. These figures point <strong>to</strong> the <strong>State</strong>’s role as a<br />
major user/producer of import and export rail-borne commodities that impact the<br />
rest of the United <strong>State</strong>s. The <strong>California</strong> <strong>State</strong> <strong>Rail</strong> <strong>Plan</strong> <strong>2005</strong>-<strong>06</strong> – <strong>2015</strong>-<strong>16</strong><br />
(<strong>State</strong> <strong>Rail</strong> <strong>Plan</strong>) points out the magnitude of <strong>California</strong>’s industrial and consumer<br />
market dependence on the freight railroads. The <strong>State</strong> <strong>Rail</strong> <strong>Plan</strong> presents the status<br />
and importance of freight railroads in <strong>California</strong> as well as a discussion of the<br />
major issues facing the railroads in the <strong>State</strong>.<br />
MAJOR FREIGHT RAILROADS<br />
The two Class I railroads in <strong>California</strong> 1 , UP and BNSF, move the majority of rail<br />
freight. These railroads have large networks that connect <strong>California</strong> with important<br />
rail hubs such as Chicago, Kansas City, and New Orleans, as well as routes running<br />
the length of <strong>California</strong>, linking the Pacific Northwest with the Los Angeles area.<br />
Many of the routes in <strong>California</strong> are the products of railroad combinations or<br />
mergers, involving some of the most his<strong>to</strong>ric names in <strong>California</strong> rail his<strong>to</strong>ry.<br />
Figure 14A is a map of the UP and BNSF rail systems in <strong>California</strong>.<br />
1 There are three classes of railroads in the United <strong>State</strong>s: Class I railroads having an annual operation revenue greater<br />
than $258.5 million, Class II or regional railroads having an annual operating revenue between $40 million and<br />
$258.5 million, and Class III or local railroads commonly known as “short lines” having annual operating revenues<br />
of less that $40 million.<br />
175
<strong>2005</strong>-<strong>06</strong> – <strong>2015</strong>-<strong>16</strong> <strong>California</strong> <strong>State</strong> <strong>Rail</strong> <strong>Plan</strong><br />
Figure 14A<br />
176
Chapter XIV – Introduction<br />
UNION PACIFIC RAILROAD<br />
The UP is the largest railroad in the <strong>State</strong>, operating on 3,024 miles of track<br />
including trackage rights. 2 In <strong>California</strong>, the UP system is made up primarily of<br />
three his<strong>to</strong>ric railroad properties:<br />
• The his<strong>to</strong>ric UP, with a main line running between Las Vegas, Nevada and<br />
Southern <strong>California</strong>.<br />
• The former Southern Pacific (SP), with main and branch lines that at one<br />
time reached virtually every corner of the <strong>State</strong>.<br />
• The former Western Pacific (WP), with a main line running between<br />
northern Nevada and the San Francisco Bay Area.<br />
Main line routes are part of the national rail systems. Comparatively high revenue<br />
<strong>to</strong>n-mile figures 3 are generated on these segments, manifesting their importance <strong>to</strong><br />
the UP system. Other UP lines include branch lines and secondary main lines,<br />
which feed traffic <strong>to</strong> the main lines and contribute relatively low revenue <strong>to</strong>n-miles.<br />
BNSF RAILWAY<br />
The BNSF, the second largest railroad in <strong>California</strong>, operates on 1,685 miles 4 of<br />
track (including trackage rights) in the <strong>State</strong>. The BNSF was created from the<br />
merger of the former Burling<strong>to</strong>n Northern <strong>Rail</strong>road (BN) and the former Atchison<br />
Topeka and Santa Fe (ATSF) in 1995. The ATSF originally had a line that ran<br />
from the San Francisco Bay Area through the San Joaquin Valley and in<strong>to</strong> Southern<br />
<strong>California</strong>. The BN had a line running in northeastern <strong>California</strong> from the Oregon<br />
border <strong>to</strong> a junction with the former WP in Bieber in Lassen County. As part of the<br />
1996 UP/SP merger, BNSF was allowed <strong>to</strong> purchase the former WP line from<br />
Bieber <strong>to</strong> Keddie in Plumas County and obtain trackage rights <strong>to</strong> S<strong>to</strong>ck<strong>to</strong>n, thereby<br />
giving <strong>California</strong> shippers a competing north/south rail option.<br />
The largest amount of freight handled in <strong>California</strong> is in the southern part of the<br />
<strong>State</strong>, moving between the Los Angeles region and the rest of the United <strong>State</strong>s.<br />
The least amount of freight handled is in the northeastern corner of the <strong>State</strong> and<br />
along the coast. Figure 14B shows <strong>to</strong>ns of freight handled by both UP and BNSF<br />
in 2004.<br />
2 <strong>California</strong> Region Timetable, Altamont Press <strong>2005</strong><br />
3 One <strong>to</strong>n moved in revenue service one mile is one revenue <strong>to</strong>n-mile.<br />
4 <strong>California</strong> Region Timetable, Altamont Press <strong>2005</strong><br />
177
<strong>2005</strong>-<strong>06</strong> – <strong>2015</strong>-<strong>16</strong> <strong>California</strong> <strong>State</strong> <strong>Rail</strong> <strong>Plan</strong><br />
Figure 14B<br />
178
Chapter XIV – Introduction<br />
REGIONAL RAILROADS<br />
<strong>California</strong> has one Class II regional railroad operating in the <strong>State</strong>. The Central<br />
Oregon and Pacific <strong>Rail</strong>road Company (CORP), with its headquarters in Roseburg,<br />
Oregon, operates a 449-mile railroad between Eugene, Oregon and Black Butte<br />
near Weed, <strong>California</strong>. The CORP, which handles mostly forest products from<br />
Southern Oregon, provides freight service in <strong>California</strong> on 59 miles of track<br />
between Hilt and Black Butte.<br />
SHORT LINE RAILROADS<br />
There are 27 Class III short line railroads operating on 1,638 miles or 27 percent of<br />
<strong>California</strong>’s rail mileage. During the 1980s and 1990s, many <strong>California</strong> short lines<br />
began operations as spin-offs of Class I branch and secondary main lines.<br />
Short line railroads in <strong>California</strong> provide switching services and/or interchange<br />
freight <strong>to</strong> the Class I carriers for transportation <strong>to</strong> other parts of the United <strong>State</strong>s as<br />
well as <strong>to</strong> international markets. They play an important role in <strong>California</strong>’s overall<br />
transportation system, especially for local communities not served by a Class I<br />
railroad.<br />
Short line railroads are classified as either local carriers serving multiple shippers<br />
in one or more communities, or switching and terminal carriers operating in one<br />
industrial area such as a port or industrial park. Some short line railroads are<br />
owned by the single shipper or corporation that they serve. For example, the only<br />
traffic carried by the Quincy <strong>Rail</strong>road in Plumas County is finished forest products<br />
for its owner, Sierra Pacific Industries. Other short lines include terminal railroads<br />
that perform switching for Class I railroads. Examples are the Pacific Harbor Line<br />
serving the Ports of Los Angeles and Long Beach, and the Oakland Terminal<br />
<strong>Rail</strong>way serving the Port of Oakland.<br />
In 2004, <strong>California</strong> short line railroads handled over 800,000 carloads of<br />
international freight. Many short lines serve industries along the I-5, I-10, I-40, and<br />
I-80 corridors. They provide switching services <strong>to</strong> the Ports of Los Angeles,<br />
Long Beach, Oakland, Hueneme, and S<strong>to</strong>ck<strong>to</strong>n. The majority of the analysis for<br />
short lines was provided by a survey of <strong>California</strong>’s short line railroads.<br />
The <strong>California</strong> short line railroads are listed in Figure 14C along with route miles<br />
and millions of gross <strong>to</strong>ns per mile (MGT/M). 5 These railroads are typically<br />
referred <strong>to</strong> as short, light density lines because most of them average less than<br />
1 MGT/M. Figure 14D is a map of these short line railroads.<br />
5 MGT/M is the standard railroad metric of traffic density.<br />
179
<strong>2005</strong>-<strong>06</strong> – <strong>2015</strong>-<strong>16</strong> <strong>California</strong> <strong>State</strong> <strong>Rail</strong> <strong>Plan</strong><br />
Figure 14C<br />
Regional <strong>Rail</strong>roads and Short Lines in <strong>California</strong><br />
<strong>Rail</strong>road<br />
<strong>Rail</strong>road<br />
Reporting<br />
Mark<br />
Miles of<br />
<strong>Rail</strong>road in<br />
<strong>California</strong><br />
Million Gross<br />
Ton-<br />
Miles/Mile 6<br />
Arizona & <strong>California</strong> <strong>Rail</strong>road Co. ARZC 134 1-4.99<br />
<strong>California</strong> Northern <strong>Rail</strong>road Co. Ltd. CFNR 217 0-0.99<br />
Carrizo George <strong>Rail</strong>way Inc CZRY 64 0-0.99<br />
Central Oregon & Pacific <strong>Rail</strong>road CORP 59 1-4.99<br />
Lake County <strong>Rail</strong>road LCR 41 0-0.99<br />
Modoc Northern <strong>Rail</strong>road MNRR 90 0-0.99<br />
Northwestern Pacific <strong>Rail</strong>way NWP 3<strong>16</strong> 0-0.99<br />
San Diego & Imperial Valley RR SDIV 35 0-0.99<br />
San Joaquin Valley <strong>Rail</strong>road Co. Inc. SJVR 310 0-0.99<br />
Santa Maria Valley <strong>Rail</strong>road Co. SMV 18 0-0.99<br />
Sierra Northern <strong>Rail</strong>road Co. SERA 103 0-0.99<br />
Trona <strong>Rail</strong>way Co. TRC 31 1-4.99<br />
Ventura County <strong>Rail</strong>road Co. VCRR 13 0-0.99<br />
Yreka Western <strong>Rail</strong>road Co. YW 9 0-0.99<br />
Switching and Terminal <strong>Rail</strong>roads<br />
Central <strong>California</strong> Traction CCT 42 0-0.99<br />
McCloud <strong>Rail</strong>way Company MCR 15 0-0.99<br />
Los Angeles Junction <strong>Rail</strong>way LAJ 65 1-4.99<br />
Modes<strong>to</strong> & Empire Traction MET 31 1-4.99<br />
Napa Valley <strong>Rail</strong>road NVRR 21 0-0.99<br />
Oakland Terminal <strong>Rail</strong>way OTR 12 0-0.99<br />
Pacific Harbor Line PHL 21 5-9.99<br />
Quincy <strong>Rail</strong>road Co. QRR 3 0-0.99<br />
Richmond Pacific <strong>Rail</strong>road Co. RPRC 5 0-0.99<br />
Sacramen<strong>to</strong> Southern SSR 4 0-0.99<br />
Santa Cruz, Big Trees & Pacific Ry. SCBG 10 0-0.99<br />
S<strong>to</strong>ck<strong>to</strong>n Terminal & Eastern <strong>Rail</strong>road STE 17 0-0.99<br />
Tulare Valley <strong>Rail</strong>way TVRR 6 0-0.99<br />
West Isle Line WFS 5 0-0.99<br />
TOTAL MILES 1,697<br />
6 Ton-mile figures from U.S. <strong>Rail</strong>road Traffic Atlas, by Harry Ladd, 1998.<br />
180
Chapter XIV – Introduction<br />
Figure 14D<br />
181
<strong>2005</strong>-<strong>06</strong> – <strong>2015</strong>-<strong>16</strong> <strong>California</strong> <strong>State</strong> <strong>Rail</strong> <strong>Plan</strong><br />
COMMODITIES SHIPPED<br />
The primary commodities handled by rail in <strong>California</strong> include bulk shipments of<br />
chemicals, petroleum, food products, farm products, primary metals, paper<br />
products, and lumber. These general carload commodities are less time sensitive<br />
than the high value cargo that tends <strong>to</strong> be shipped by truck and air. Overall, the<br />
general carload base business 7 for railroads has remained strong. This has<br />
prompted UP <strong>to</strong> make substantial investments in improving throughput at<br />
classification yards such as the $145 million upgrade of their Roseville Yard that<br />
opened in 1999. Increasingly, the railroads have been able <strong>to</strong> attract more time<br />
sensitive shipments using expedited rail intermodal service. This premium service<br />
allows trailers and containers the ability <strong>to</strong> move quickly on fast transcontinental<br />
routes with penalties assessed <strong>to</strong> the railroad if shipments are late. To capitalize on<br />
this growing demand, the Class I railroads have been building new intermodal<br />
yards. Among these are the UP’s facility in Lathrop and the BNSF’s Mariposa<br />
facility in S<strong>to</strong>ck<strong>to</strong>n.<br />
Figure 14E shows commodities originated and terminated in <strong>California</strong> for 2003.<br />
Mixed freight includes international containerized freight going through the Ports<br />
of Los Angeles, Long Beach, and Oakland, as well as domestic containers handled<br />
at both the UP and BNSF facilities statewide.<br />
Figure 14E<br />
Commodities Originated and Terminated in <strong>California</strong> for 2003<br />
Tons Originated<br />
Tons Terminated<br />
Commodity Tons % Commodity Tons %<br />
Mixed Freight 30,556,904 47% Mixed Freight 22,365,760 23%<br />
Food Products 6,281,600 10% Farm Products 10,770,955 11%<br />
Chemicals 3,983,724 6% Food Products 10,195,697 10%<br />
Primary Metal Products 3,868,301 6% Chemicals 9,754,223 10%<br />
Glass and S<strong>to</strong>ne 3,481,138 5% Primary Metal Products 7,022,910 7%<br />
All Other <strong>16</strong>,646,695 26% All Other 38,017,000 39%<br />
Total 64,818,362 98,126,545<br />
Source: <strong>Rail</strong>road Statistics by <strong>State</strong>, Association of American <strong>Rail</strong>roads, 2003<br />
7 General carloads include traffic in traditional railroad equipment such as gondolas, boxcars, hopper cars, tank cars,<br />
lumber cars, etc. By contrast, intermodal shipments, consisting of trailers and containers, travel on flat cars or<br />
“double stack” cars, where containers are placed one on <strong>to</strong>p of another. Intermodal service tends <strong>to</strong> operate on tight<br />
schedules and have faster transit times compared <strong>to</strong> general carload business.<br />
182
Chapter XV – Major Freight Issues<br />
CHAPTER XV<br />
MAJOR FREIGHT ISSUES<br />
GOCALIFORNIA<br />
Go<strong>California</strong>, is the Administration’s major effort <strong>to</strong> improve mobility and<br />
accessibility for people, goods, services, and information through a safe,<br />
integrated, multimodal, world-class transportation system that achieves the<br />
“3-Es” of a Prosperous Economy, Quality Environment, and Social Equity.<br />
A significant element of Go<strong>California</strong> is <strong>to</strong> invest in freight rail infrastructure in<br />
partnership with public and private sec<strong>to</strong>r interests <strong>to</strong> enhance the capacity of the<br />
freight rail system in the <strong>State</strong> <strong>to</strong> meet current and future demand for freight rail<br />
service. <strong>State</strong> participation in funding critical freight rail improvements that allow<br />
more goods <strong>to</strong> be shipped by rail will produce substantial public benefits from<br />
congestion relief on freeways, environmental benefits, and continued economic<br />
growth.<br />
Go<strong>California</strong> identifies the need <strong>to</strong> invest $50 - $53 billion in goods movement<br />
projects over the next 20 years, and includes the following examples of major<br />
freight rail projects <strong>to</strong> improve goods movement.<br />
• Upgrade Alameda Corridor East Through the Inland Empire.<br />
• Expand Port of Oakland Joint Intermodal Terminal.<br />
• Construct Additional Main Line <strong>Rail</strong> Track Through Cajon Pass.<br />
GOODS MOVEMENT ACTION PLAN<br />
The Goods Movement Action <strong>Plan</strong> (GMAP) is a key element of Go<strong>California</strong>. It<br />
is a two-phase process. The Phase I report is an attempt <strong>to</strong> characterize the “why”<br />
and the “what” of the <strong>State</strong>’s involvement in goods movement in the following<br />
four segments: (1) the goods movement industry and its growth potential, (2) the<br />
four “port-<strong>to</strong>-border” transportation corridors that constitute the <strong>State</strong>’s goods<br />
movement backbone and the associated inven<strong>to</strong>ry of infrastructure projects being<br />
planned or underway, (3) the extent of environmental and community impacts—as<br />
well as a description of mitigation approaches, and (4) public safety and homeland<br />
security issues.<br />
Substantial effort was focused on developing the inven<strong>to</strong>ry of existing and<br />
proposed goods movement projects. The listing includes previously identified<br />
projects in various Regional Transportation <strong>Plan</strong>s (RTP) and Regional<br />
Transportation Improvement Programs (RTIP). In addition, the listings include<br />
a wide range of projects underway or under consideration by the ports, railroads,<br />
and other third parties. Prior <strong>to</strong> this compilation, no comprehensive statewide<br />
inven<strong>to</strong>ry of goods movement projects was available.<br />
183
<strong>2005</strong>-<strong>06</strong> – <strong>2015</strong>-<strong>16</strong> <strong>California</strong> <strong>State</strong> <strong>Rail</strong> <strong>Plan</strong><br />
The Phase II GMAP <strong>to</strong> be completed by December <strong>2005</strong>, will develop a statewide<br />
implementation plan for goods movement capacity expansion, goods movementrelated<br />
environmental and community mitigation, and goods movement-related<br />
homeland security and public safety enhancement. It will define the “how,”<br />
“when,” and “who” required <strong>to</strong> synchronize and <strong>to</strong> integrate efforts <strong>to</strong> achieve<br />
relief and improvement as quickly as possible.<br />
The Phase II effort will be executed by work groups comprised of various<br />
stakeholders in conjunction with team leaders from the Business, Transportation,<br />
and Housing Agency and the <strong>California</strong> Environmental Protection Agency.<br />
Phase II will include business plans for each of <strong>California</strong>’s four goods movement<br />
corridors (Los Angeles-Long Beach, Bay Area, Central Valley, and San Diego).<br />
Over a four month period, each of the work groups will be tasked with developing<br />
business plans which will detail the timing, sequencing, and funding of corridor<br />
expansion projects.<br />
Each corridor working group will also review, evaluate, and recommend: corridorspecific<br />
operational improvements; environmental and community impact<br />
mitigation strategies; and homeland security and public safety enhancements.<br />
The working groups will be responsible for identifying how the costs of<br />
improvements and mitigation measures could be funded. Phase II also will<br />
include the Port and Intermodal Goods Movement Comprehensive Emission<br />
Reduction <strong>Plan</strong>, a plan that will be developed by the <strong>California</strong> Air Resources<br />
Board (ARB) in consultation with all stakeholders. Other work groups will prepare<br />
a homeland security and public safety plan and a workforce development plan.<br />
Freight rail system improvements with substantial public benefits will be<br />
identified in the Goods Movement Action <strong>Plan</strong> and incorporated in<strong>to</strong> future<br />
iterations of the <strong>California</strong> <strong>State</strong> <strong>Rail</strong> <strong>Plan</strong> with recommendations for methods of<br />
funding and financing the projects.<br />
GROWING BUSINESS AND CAPACITY CONCERNS<br />
Class I railroads are facing increasing traffic levels system-wide. For 2004,<br />
UP revenues were up 5 percent <strong>to</strong> $12.2 billion from 2003 8 . Similarly,<br />
BNSF revenues were up <strong>16</strong> percent <strong>to</strong> $10.9 billion in the same period.<br />
As business grows, maintaining sufficient capacity <strong>to</strong> ensure reliable operations<br />
has become the single largest concern of Class I opera<strong>to</strong>rs. This concern drives<br />
the freight railroads’ major investment strategies.<br />
8 2004 Financial statements from UP and BNSF inves<strong>to</strong>r reports<br />
184
Chapter XV – Major Freight Issues<br />
A Caltrans survey in <strong>2005</strong> of the UP and BNSF indicated their major choke points<br />
are areas where they both operate on the same facility. Capacity improvements<br />
are needed at:<br />
• Cajon Pass between San Bernardino and Cajon Summit.<br />
• Tehachapi Pass between Bakersfield and Tehachapi Summit.<br />
• Col<strong>to</strong>n Crossing in San Bernardino County.<br />
In addition, both railroads noted capacity improvements were needed between<br />
San Bernardino and Los Angeles along <strong>State</strong> Route 91, and the Interstate 5 and 10<br />
corridors <strong>to</strong> accommodate additional commuter rail service. The Alameda East<br />
Construction Authority, the San Bernardino Associated Governments, Riverside<br />
County Transportation Commission, Orange County Transportation Authority,<br />
and the On-Trac Project are working with the railroads <strong>to</strong> address the need for<br />
grade separations <strong>to</strong> reduce delays at grade crossings between these two cities.<br />
Capacity can be measured in terms of the level of investment across three<br />
elements: freight handling facilities or yards, main line track, and rolling s<strong>to</strong>ck.<br />
UP’s capital investments for 2004 exceeded $1.8 billion, which represents over<br />
<strong>16</strong> percent of revenues. In the same year, BNSF spent $1.5 billion for capital<br />
investments, over 14 percent of revenues. While expensive, these investments are<br />
needed <strong>to</strong> move the freight on ever more crowded main lines and through ever<br />
more congested intermodal and general classification yards.<br />
INTERMODAL SHIPMENTS<br />
Intermodal is defined as being or involving the transportation by more than one<br />
mode during a single journey. For the purpose of this plan, we are referring <strong>to</strong> the<br />
rail carriage of truck trailers and containers. The growing predominance of<br />
intermodal freight in <strong>California</strong>’s railroad operations is based on a large consumer<br />
demand as well as the fact that <strong>California</strong> is the primary gateway for containerized<br />
products coming in from the rapidly expanding Pacific Rim economies.<br />
As the growth leader, intermodal traffic is making heavy demands on existing<br />
railroad capacity. The BNSF’s international intermodal traffic passing through<br />
<strong>California</strong> grew an additional <strong>16</strong> percent in 2004, surpassing two million<br />
containers handled at their facilities. A map of <strong>California</strong> rail intermodal facilities<br />
is shown in Figure 15A.<br />
185
<strong>2005</strong>-<strong>06</strong> – <strong>2015</strong>-<strong>16</strong> <strong>California</strong> <strong>State</strong> <strong>Rail</strong> <strong>Plan</strong><br />
Figure 15A<br />
186
Chapter XV – Major Freight Issues<br />
International container shipments have been growing rapidly <strong>to</strong> and from West<br />
Coast ports over the last ten-year period, as illustrated by Figure 15B.<br />
Figure 15B<br />
Container 20 Foot Equivalent Units (TEUs)<br />
Major Ports of the Continental U.S. 9<br />
(In Millions)<br />
Port 1995 2004 Change<br />
Los Angeles 2.64 7.32 177%<br />
Long Beach 2.84 5.78 103%<br />
Oakland 1.56 2.04 65%<br />
Tacoma 1.09 1.80 32%<br />
Seattle 1.48 1.78 20%<br />
<strong>California</strong> ports handle the majority of the West Coast marine container traffic.<br />
Together, the Ports of Los Angeles and Long Beach make up the third largest<br />
container port facility in the world. Fifty percent of all the containers handled at<br />
the Ports of Los Angeles and Long Beach go <strong>to</strong> U.S. destinations by rail. The vast<br />
majority of these are bound for inland destination points such as Chicago and<br />
Kansas City, illustrating the importance of the rail/steamship interface.<br />
In order <strong>to</strong> facilitate further growth, the ports and railroads have been making<br />
substantial investments <strong>to</strong> improve rail/ship interface. Recent planned<br />
improvements include:<br />
• On-dock facilities 10 in both the ports of Los Angeles and Long Beach.<br />
• The Alameda Corridor East project between down<strong>to</strong>wn Los Angeles and<br />
San Bernardino and Riverside Counties.<br />
• The Joint Intermodal Terminal at the Port of Oakland.<br />
SHARED USE OF RIGHTS-OF-WAY<br />
In many areas of the <strong>State</strong>, passenger services share rail rights-of-way (ROW)<br />
with freight railroads. For both passenger and freight railroads sharing a ROW,<br />
a primary issue is the capacity of the route <strong>to</strong> accommodate all train movements.<br />
Before a freight railroad grants a passenger opera<strong>to</strong>r use of its facilities, the<br />
railroad will require various capacity improvements <strong>to</strong> ensure the reliability of<br />
9 American Association of Port Authorities, <strong>2005</strong><br />
10 An on-dock rail facility refers <strong>to</strong> track and loading equipment inside a marine terminal <strong>to</strong> enable the movements of<br />
containers between ships and trains without leaving the marine terminals.<br />
187
<strong>2005</strong>-<strong>06</strong> – <strong>2015</strong>-<strong>16</strong> <strong>California</strong> <strong>State</strong> <strong>Rail</strong> <strong>Plan</strong><br />
both freight and passenger services. The cost of these improvements may be<br />
borne by the passenger opera<strong>to</strong>r or can be shared.<br />
Freight railroads and various public agencies have entered in<strong>to</strong> negotiations for the<br />
use of freight rail lines for commuter and intercity passenger services. Some of<br />
the freight railroads sold their lines <strong>to</strong> the passenger opera<strong>to</strong>rs but retained the<br />
rights <strong>to</strong> provide freight services on them. In <strong>California</strong>, shared use of ROW<br />
includes:<br />
• <strong>State</strong>-sponsored Amtrak intercity services: Pacific Surfliner Route,<br />
San Joaquin Route, and Capi<strong>to</strong>l Corridor.<br />
• The Southern <strong>California</strong> Metrolink commuter rail system.<br />
• The San Diego County Coaster commuter rail system.<br />
• The Caltrain commuter rail system in the San Francisco Bay Area.<br />
• The Altamont Commuter Express (ACE) rail system.<br />
In recent years, ridership and train service has increased on all commuter and<br />
intercity rail lines in <strong>California</strong>. Passenger opera<strong>to</strong>rs have plans for adding more<br />
trains over the next several years. In some cases, capacity has proven insufficient<br />
<strong>to</strong> handle existing levels of both freight and passenger service, particularly in<br />
metropolitan areas with substantial freight and passenger traffic. For example, in<br />
2004, Metrolink trains operated on time 95 percent of the time on Metrolink<br />
controlled trackage. On the tracks owned by UP and BNSF, Metrolink trains<br />
operated on time 70 <strong>to</strong> 85 percent of the time.<br />
Freight interference causes major operating problems for Metrolink especially on<br />
UP's Los Angeles Subdivision between Riverside and Los Angeles. Heavy UP<br />
port rail traffic results in Metrolink trains operating late almost on a daily basis.<br />
Heavy BNSF port rail traffic on their San Bernardino Subdivision between<br />
Los Angeles and San Bernardino also causes delays for Metrolink trains.<br />
JOINT DISPATCHING OF FREIGHT OPERATIONS<br />
In <strong>California</strong>, five Class I rail segments have joint freight train operations.<br />
Three segments are owned and dispatched by the UP:<br />
• The UP Sacramen<strong>to</strong> and Canyon Subdivisions between S<strong>to</strong>ck<strong>to</strong>n and the<br />
Nevada <strong>State</strong> Line via Sacramen<strong>to</strong> and the Feather River Canyon.<br />
• The UP Martinez and Roseville Subdivisions between Oakland and the<br />
Nevada <strong>State</strong> Line via Donner Summit.<br />
• The UP Mojave Subdivision between Bakersfield and Mojave.<br />
188
Chapter XV – Major Freight Issues<br />
Two segments are owned and dispatched by the BNSF:<br />
• The Mojave Subdivision between Mojave and Bars<strong>to</strong>w.<br />
• The Cajon and Needles Subdivisions between San Bernardino and Daggett.<br />
In some cases, the railroads share each other’s facilities <strong>to</strong> take advantage of more<br />
direct routes. Such arrangements also allow track maintenance costs <strong>to</strong> be shared<br />
as they are based on the number of each railroad’s trains using the facility.<br />
However, the tenant railroad can be subject <strong>to</strong> delays caused by the railroad that<br />
owns the infrastructure because the owner's trains will typically be given priority.<br />
The problems of joint train operations are compounded when steep mountainous<br />
grades and curves force trains <strong>to</strong> operate at reduced speeds. For trains running<br />
over Tehachapi Pass, the operations are especially time consuming due <strong>to</strong> the fact<br />
that it is a single track railroad with many sharp curves and the steepest grade in<br />
the <strong>State</strong>.<br />
This grade requires trains <strong>to</strong> operate additional locomotive units on trains traveling<br />
over the pass. There are a number of passing sidings but a minimum of<br />
20 minutes delay <strong>to</strong> the train being passed is not uncommon. The 28 <strong>to</strong> 30 trains<br />
per day crossing over the Tehachapi Pass cause a major bottleneck in the rail<br />
connection <strong>to</strong> <strong>California</strong>’s Central Valley. To double-track the Tehachapi Pass<br />
route several new tunnels and bridges would have <strong>to</strong> be constructed at great cost.<br />
Both UP and BNSF have established a joint dispatching center in San Bernardino<br />
so that both railroads can be in direct contact with each other <strong>to</strong> help make these<br />
joint train operations work as smoothly as possible.<br />
FRESNO RAIL CONSOLIDATION<br />
Currently, both UP and BNSF operate freight service through the City of Fresno.<br />
There is considerable public support <strong>to</strong> consolidate both rail lines on<strong>to</strong> the UP rail<br />
corridor <strong>to</strong> the west of down<strong>to</strong>wn Fresno. Many important issues need <strong>to</strong> be<br />
resolved including how <strong>to</strong> service existing freight cus<strong>to</strong>mers, operational questions<br />
and optimal track structure required <strong>to</strong> accommodate the increased traffic on the<br />
UP. A study by the Fresno Council of Governments determined that consolidation<br />
of the two lines is technically and operationally feasible but at a very high cost.<br />
MAJOR ISSUES FOR CALIFORNIA RAIL SHIPPERS<br />
The Department participated in a study entitled the Western Transportation Trade<br />
Network (WTTN) which surveyed 53 shippers in 13 western states for their<br />
perspectives on Class I railroad performance. 11 Two issues of primary concern <strong>to</strong><br />
the shippers were (1) reliable transit times and (2) car availability and condition.<br />
11 Western Transportation Trade Network Study, Western Association of <strong>State</strong> Highway and Transportation<br />
Officials, August 1999.<br />
189
<strong>2005</strong>-<strong>06</strong> – <strong>2015</strong>-<strong>16</strong> <strong>California</strong> <strong>State</strong> <strong>Rail</strong> <strong>Plan</strong><br />
Interestingly, the cost of rail service and effective cus<strong>to</strong>mer service were of<br />
substantially less interest <strong>to</strong> shippers than those two issues.<br />
Given the importance of intermodal traffic <strong>to</strong> railroads in <strong>California</strong>, the focus of<br />
this effort was on intermodal shippers. One company studied was a <strong>California</strong><br />
intermodal marketing company (IMC) 12 , which leases trailers and containers from<br />
both railroads and “stack train opera<strong>to</strong>rs” and solicits loads for this equipment<br />
from shippers for transport in rail intermodal service <strong>to</strong> points throughout<br />
North America. The other was a container train opera<strong>to</strong>r who owns containers and<br />
pays the railroads <strong>to</strong> deliver their containers <strong>to</strong> points throughout North America.<br />
Of particular concern <strong>to</strong> both of these parties were the following issues:<br />
• Congested intermodal terminals that delay shipments.<br />
• Lack of containers and rolling s<strong>to</strong>ck <strong>to</strong> handle traffic in and out of Southern<br />
<strong>California</strong>.<br />
• Congestion on main lines and in terminals of eastern railroads that delays<br />
shipments <strong>to</strong> and from <strong>California</strong>.<br />
• Information technology problems causing lost rail cars.<br />
• Delays <strong>to</strong> rail shipments related <strong>to</strong> increasing shared use of main lines by<br />
commuter and intercity passenger operations.<br />
12 As noted above, an IMC leases containers and trailers from railroads like BNSF and UP, and in turn solicits loads<br />
for these containers from shippers. It then arranges for the pick-up of the trailers and containers from the shippers,<br />
their transport on the railroad, and their deliveries <strong>to</strong> receivers. For these logistical arrangements, the IMC charges<br />
its fees <strong>to</strong> shippers.<br />
190
Chapter XVI – Short Line Analysis<br />
CHAPTER XVI<br />
SHORT LINE ANALYSIS<br />
Short line railroads play an important role in moving goods <strong>to</strong> and from <strong>California</strong><br />
regions and local communities. The commodities moved tend <strong>to</strong> have a low<br />
transportation cost <strong>to</strong> weight/volume ratio, which contributes <strong>to</strong> their attraction <strong>to</strong><br />
short lines, instead of trucks.<br />
There are 28 short line and regional railroads in <strong>California</strong> <strong>to</strong>day. Most of them<br />
are privately owned and employ between ten and 50 employees, as shown by the<br />
summary from the American Association of <strong>Rail</strong>roads in Figure <strong>16</strong>A. Revenues<br />
for the majority of the short lines are less than $5 million annually.<br />
None of the short lines have revenues exceeding $40 million per year. Operating<br />
costs were not cited. However, in <strong>California</strong>, operating costs range from about<br />
75 percent <strong>to</strong> 110 percent of revenues. 13 The latter figure would suggest that short<br />
lines with operating costs higher than revenue have other income sources such as<br />
income from rental property.<br />
SHORT LINE RAILROAD ISSUES<br />
SECURING INFRASTRUCTURE FUNDING SOURCES<br />
Securing adequate funding for infrastructure upgrades and other capital<br />
investments is the most pressing issue for independently owned and operated short<br />
lines. Some short line railroads were spin-offs from the Class I railroads<br />
(Class Is), and were already suffering from years of deferred maintenance when<br />
created. Maintenance-of-way procedures on these railroads typically are highly<br />
labor intensive and expensive. Because short line railroads operate on low profit<br />
margins they are unable <strong>to</strong> take on major infrastructure improvement projects.<br />
TREND TOWARDS HEAVIER CARS<br />
A major trend in the railroad industry is the use of heavier rail cars as a means of<br />
maximizing load potential, thereby generating cost savings. The upper limit of<br />
these new car weights has been increased <strong>to</strong> 286,000 pounds. To handle these<br />
heavier cars, short lines must have track, roadbed, and bridges capable of handling<br />
the increased loads. This means a substantial investment that many short lines<br />
cannot afford given the limited revenues that they earn moving cars between<br />
shippers and the Class I railroads.<br />
Without the necessary infrastructure, many of the commodities moving by rail<br />
<strong>to</strong>day have <strong>to</strong> be hauled by trucks <strong>to</strong> and from transload facilities located at major<br />
13 Per conversation with Mr. Andrew Fox, CSLRRA president, August 2000.<br />
191
<strong>2005</strong>-<strong>06</strong> – <strong>2015</strong>-<strong>16</strong> <strong>California</strong> <strong>State</strong> <strong>Rail</strong> <strong>Plan</strong><br />
railroads. This shift from short line rail <strong>to</strong> trucks will further congest the <strong>State</strong>’s<br />
highway system, create more traffic delays, and increase air pollution and highway<br />
maintenance costs. The loss of revenue <strong>to</strong> short line railroads could force some <strong>to</strong><br />
go out of business leaving some <strong>California</strong> rail shippers without rail services.<br />
The additional truck transportation costs will have <strong>to</strong> be passed on <strong>to</strong> consumers,<br />
making goods more costly <strong>to</strong> purchase.<br />
SHORT LINE BILL OF RIGHTS<br />
The continuing consolidation of Class I railroads is a concern for short line<br />
railroad opera<strong>to</strong>rs. In 1975, there were 22 Class I railroads operating in the U.S.<br />
Presently, there are eight. Since 1995, the number of Class Is operating in<br />
<strong>California</strong> has decreased by half, from four <strong>to</strong> two.<br />
The American Short Line and Regional <strong>Rail</strong>road Association (ASLRRA) is a<br />
national non-profit trade association representing the interests of over 400 member<br />
short lines and regional railroads. In order <strong>to</strong> protect the viability of short lines,<br />
ASLRRA expressed <strong>to</strong> the Surface Transportation Board (STB) its opinion that a<br />
“Short Line Bill of Rights” should be made a condition for the approval of all<br />
future Class I railroad mergers 14 and consolidation transactions. The ASLRRA,<br />
has proposed four rights as follows:<br />
1. Small railroads have the right <strong>to</strong> compensation for Class I service failures.<br />
2. Short line and regional railroads have a right <strong>to</strong> interchange and routing<br />
freedom.<br />
3. Short line and regional railroads have the right <strong>to</strong> competitive and<br />
nondiscrimina<strong>to</strong>ry pricing.<br />
4. Short line and regional railroads have a right <strong>to</strong> fair and nondiscrimina<strong>to</strong>ry<br />
car supply.<br />
14 STB ExParte No. 582, Public Views on Major <strong>Rail</strong> Consolidations, <strong>State</strong>ment of Frank K. Turner, President,<br />
ASLRRA.<br />
192
Chapter XVI – Short Line Analysis<br />
Figure <strong>16</strong>A<br />
Regional and Short Line <strong>Rail</strong>road Ownership and Size<br />
<strong>Rail</strong>road RR Type Owner Employees<br />
Annual<br />
Revenues<br />
(millions)<br />
1 Arizona & <strong>California</strong> <strong>Rail</strong>road* Local Private 34 $10-$20<br />
2 <strong>California</strong> Northern <strong>Rail</strong>road Local Private 46 $10-$20<br />
3 Carrizo Gorge <strong>Rail</strong>way Local Public 6
<strong>2005</strong>-<strong>06</strong> – <strong>2015</strong>-<strong>16</strong> <strong>California</strong> <strong>State</strong> <strong>Rail</strong> <strong>Plan</strong><br />
SHORT LINE SURVEY<br />
In 2000, the Department surveyed 29 short line carriers and received a <strong>to</strong>tal of<br />
19 responses (66 percent of the 29 companies). The survey inquired about service<br />
and infrastructure characteristics, commodity movements, upgrade costs, and issue<br />
areas. The following summarizes responses received for the key issue areas:<br />
Track and Right-of-way<br />
• Track and ROW improvements are needed <strong>to</strong> accommodate 286,000-pound<br />
cars.<br />
• The increase in operating weight will place a further maintenance expense<br />
burden on the short lines.<br />
Safety<br />
• Improve at-grade crossing protection devices.<br />
• Additional funding for grade separations is needed.<br />
• Replace outdated signal systems.<br />
Intermodal Facilities<br />
• Seven of the respondents operate some type of intermodal facility.<br />
• Of these, four identified the need for upgrades and improvements <strong>to</strong>taling<br />
approximately $19 million.<br />
<strong>State</strong> Role<br />
• Because of thin short line operating margins (revenues less operating<br />
costs), the short lines request <strong>State</strong> assistance in capital funding.<br />
• Assume responsibility for flood protection due <strong>to</strong> <strong>State</strong> actions diverting or<br />
increasing flood flows.<br />
• Take an active role <strong>to</strong> preserve existing corridors for future passenger and<br />
freight services.<br />
Local Jurisdictions<br />
• Local government should consider the provision of rail access in approval<br />
of new commercial and industrial properties.<br />
SERVICE AND INFRASTRUCTURE<br />
The longest short line railroad is the San Joaquin Valley <strong>Rail</strong>road with 310 miles<br />
of track. The Quincy <strong>Rail</strong>road has the shortest line with just three track miles.<br />
The Sierra Northern <strong>Rail</strong>road has the highest number of bridges of any reporting<br />
short line in the <strong>State</strong>. In terms of service for 2004, the San Joaquin Valley<br />
<strong>Rail</strong>road transported the most freight with 36,226 cars, followed by<br />
194
Chapter XVI – Short Line Analysis<br />
Pacific Harbor Line with 36,005 cars, the <strong>California</strong> Northern <strong>Rail</strong>road with<br />
30,627 cars, and Modes<strong>to</strong> & Empire Traction with 28,608 cars. These four lines<br />
alone accounted for 80 percent of all reported short line movements.<br />
Seven short line railroads reported having intermodal facilities, defined as:<br />
Container on Flat Car (COFC), Trailer on Flat Car (TOFC), team tracks, or bulk<br />
transfer facilities. Of the 19 short lines in the survey sample, 12 reported not<br />
owning or operating any intermodal facilities.<br />
COMMODITY MOVEMENTS<br />
In 2003, the AAR 15 reported 6.1 million carloads of freight originating and<br />
terminating in <strong>California</strong>, accounting for the movement of over <strong>16</strong>2 million <strong>to</strong>ns of<br />
commerce.<br />
The reporting short lines handle over six percent of the number of annual cars and<br />
nearly <strong>16</strong> percent of the <strong>to</strong>tal <strong>to</strong>nnage. The majority of all movements were<br />
interstate in nature. Many of them were bridge movements originating and<br />
terminating in other Pacific Rim countries and moving through <strong>California</strong> <strong>to</strong> and<br />
from other U.S. inland or East/Gulf Coast points.<br />
The reported commodity shipments via the short lines can be aggregated in<strong>to</strong><br />
seven commodity categories:<br />
• Agricultural Products – grains, beets, pota<strong>to</strong>es, etc.<br />
• Au<strong>to</strong>mobiles.<br />
• Chemical – petroleum products, liquefied natural gas (LNG), fertilizer,<br />
hazardous materials, etc.<br />
• Food Products – processed foods, <strong>to</strong>ma<strong>to</strong> paste, frozen foods, etc.<br />
• Minerals – processed metals, minerals, cement, gypsum, aggregates, etc.<br />
• TOFC or COFC mixed freight shipments.<br />
• Wood Products – lumber, logs, paper, furniture, etc.<br />
The number of carloads by commodity was used <strong>to</strong> estimate the statewide<br />
short line commodity mix. The results are shown in the pie chart labeled<br />
Figure <strong>16</strong>B. Wood and food products each accounted for over 20 percent of the<br />
movements.<br />
15 American Association of <strong>Rail</strong>roads, 2001 Traffic Report for <strong>California</strong>.<br />
195
<strong>2005</strong>-<strong>06</strong> – <strong>2015</strong>-<strong>16</strong> <strong>California</strong> <strong>State</strong> <strong>Rail</strong> <strong>Plan</strong><br />
Figure <strong>16</strong>B<br />
<strong>California</strong> Short Line <strong>Rail</strong>road Commodity Distribution<br />
Agricultural Products<br />
(Grains, Beets, Pota<strong>to</strong>es,<br />
etc.)<br />
6.6%<br />
TOFC<br />
0.3%<br />
Au<strong>to</strong><br />
8.1%<br />
Food Products<br />
(Processed, Frozen, etc.)<br />
22.1%<br />
Minerals (Processed Metals,<br />
Minerals, Cement,<br />
Aggregates, etc.)<br />
11.6%<br />
Other<br />
11.0%<br />
Wood Products<br />
(Lumber, Furniture, Paper,<br />
etc.)<br />
24.2%<br />
Chemical<br />
(LNG, Petroleum, Fertilizer,<br />
HM, Plastics, etc.)<br />
<strong>16</strong>.1%<br />
UPGRADE COSTS<br />
Significant debate surrounds the magnitude of costs required <strong>to</strong> upgrade short line<br />
infrastructure <strong>to</strong> keep the railroads competitive and in business. Most lines<br />
identified the cost of upgrading the current infrastructure as a major impediment <strong>to</strong><br />
the success of future operations. A number of the lines submitted specific<br />
estimates for upgrading and improving track, ROW, and intermodal facilities.<br />
These reported costs amount <strong>to</strong> over $110 million for track and ROW and<br />
$19 million for intermodal facilities.<br />
The project team estimated upgrade costs for all <strong>California</strong> short lines using a<br />
methodology developed specifically <strong>to</strong> handle 286,000-pound cars <strong>16</strong> . This<br />
methodology provides unit costs for each track element based on national data.<br />
Since the upgrade cost is primarily mileage driven, the longest short lines, such as<br />
the San Joaquin Valley <strong>Rail</strong>road and the <strong>California</strong> Northern <strong>Rail</strong>road Company,<br />
exhibit the highest upgrade estimates ($31.7 million and $22.6 million,<br />
<strong>16</strong> An Estimation of the Investment in Track and Structures Needed <strong>to</strong> Handle 286,00 lb. <strong>Rail</strong> Cars, American Short<br />
Line and Regional Association, May 2000.<br />
196
Chapter XVI – Short Line Analysis<br />
respectively). The <strong>to</strong>tal statewide short line upgrade cost is on the order of<br />
$190 million.<br />
To arrive at a grand <strong>to</strong>tal improvement cost estimate, other infrastructure projects<br />
need <strong>to</strong> be added in, as well as intermodal facility projects. Doing so would bring<br />
the <strong>to</strong>tal estimated upgrade and improvement cost for short lines statewide <strong>to</strong><br />
allow handling of 286,000-pound cars well in excess of $200 million. With<br />
operating ratios (the percent of revenues consumed by operating costs) of<br />
75 percent or more, <strong>California</strong> short lines would seem hard pressed <strong>to</strong> cover<br />
capital costs for handling 286,000-pound cars, plus all other ongoing capital needs.<br />
IMPACT ON MAINTENANCE<br />
Any increase in traffic has an impact on highway maintenance costs.<br />
Traffic diverted from railroads <strong>to</strong> trucks increases highway volumes, reduces<br />
roadway life expectancy, and requires additional highway maintenance<br />
(e.g., resurfacing). Unscheduled costs may result in postponement of other<br />
projects or the need for additional funding.<br />
The Federal Highway Administration (FHWA) has determined that the marginal<br />
pavement cost of an 80,000-pound five-axle combination truck on a rural interstate<br />
highway is approximately 13 cents per mile as of 1997. 17 Fac<strong>to</strong>ring the FHWA<br />
rate and the <strong>to</strong>tal 1999 projected truckload equivalents for each short line's route 18 ,<br />
an annual <strong>California</strong> highway deterioration rate was determined.<br />
If the <strong>California</strong> short line railroads were <strong>to</strong> cease operations, the mode shift of<br />
railcars <strong>to</strong> truckloads would cost the <strong>State</strong> over $9 million in highway deterioration<br />
costs. Combined, the San Joaquin Valley <strong>Rail</strong>road and <strong>California</strong> Northern<br />
<strong>Rail</strong>road Company represent 83 percent of this <strong>to</strong>tal statewide figure.<br />
In addition <strong>to</strong> the highway deterioration costs from the increase in truck traffic<br />
throughout the <strong>State</strong>, other social costs could increase (e.g., safety, noise,<br />
air pollution).<br />
17 Highway Cost Allocation Study, FHWA 1997.<br />
18 The length of each short line was used as a proxy for competing highway length.<br />
197
<strong>2005</strong>-<strong>06</strong> – <strong>2015</strong>-<strong>16</strong> <strong>California</strong> <strong>State</strong> <strong>Rail</strong> <strong>Plan</strong><br />
198
Chapter XVII - Funding<br />
CHAPTER XVII<br />
FUNDING<br />
ECONOMIC ROLE OF SHORT LINE AND REGIONAL<br />
RAILROADS<br />
There are about 500 short lines and regional railroads in North America.<br />
Though their individual roles may vary, they typically feed traffic <strong>to</strong> the high<br />
volume, main-line rail routes owned by the Class Is.<br />
The <strong>to</strong>tal number of short lines and regional railroads has been growing. In 1980,<br />
there were about 220 companies. Driving this growth has been the rationalization<br />
efforts of Class I railroads, spinning off numerous light density branch lines 19 in<br />
an effort <strong>to</strong> control costs. The Class Is either sold many lines outright or leased<br />
components of their operations <strong>to</strong> private opera<strong>to</strong>rs. 20<br />
The short line railroads, with 1,697 miles (27 percent) of the <strong>State</strong>’s rail mileage,<br />
are facing significant problems. Many <strong>California</strong> short line railroads serve<br />
industries along the I-5, I-10, I-40 and I-80 corridors and near the Ports of<br />
Los Angeles, Long Beach, Oakland, Hueneme, S<strong>to</strong>ck<strong>to</strong>n, and Sacramen<strong>to</strong>.<br />
These railroads handle over 800,000 annual carloads of international freight.<br />
Their primary concern is their inability <strong>to</strong> handle the new industry standard<br />
286,000-pound rail cars on lightweight track and bridge infrastructure. Short line<br />
railroad infrastructure that provides congestion relief along the major global<br />
gateways needs <strong>to</strong> be upgraded <strong>to</strong> accommodate the 286,000-pound rail cars that<br />
carry international freight.<br />
SUSTAINABILITY OF SHORT LINES AND REGIONAL<br />
RAILROADS<br />
Like Class I railroads, each short line and regional railroad is paid for moving cars<br />
on their railroad. In cases where short lines interchange cars with Class I<br />
railroads, these carriers share their revenue with the short lines. For a sustainable<br />
operation, short line revenues must be sufficient <strong>to</strong> cover both operating costs and<br />
capital costs. Operating costs include labor and fuel, among other things.<br />
Capital costs include improvements <strong>to</strong> rolling s<strong>to</strong>ck (i.e., vehicles) and track and<br />
bridges, among other things. Often revenues have proven inadequate <strong>to</strong> cover<br />
both operating and capital costs of short lines, and public funding sources have<br />
been needed <strong>to</strong> sustain the lines.<br />
19 The term “light density lines” is applied generally <strong>to</strong> branch line that generates significantly less rail traffic<br />
compared <strong>to</strong> the main line or a heavily used branch line.<br />
20 Class I route miles declined from more than 200,000 in 1970 <strong>to</strong> less than 120,000 in 1995. Over the same period,<br />
route mileage of Class II and III railroads increased from less than 15,000 <strong>to</strong> over 45,000 in 1995.<br />
199
<strong>2005</strong>-<strong>06</strong> – <strong>2015</strong>-<strong>16</strong> <strong>California</strong> <strong>State</strong> <strong>Rail</strong> <strong>Plan</strong><br />
Exacerbating this issue is the “286 problem.” The term refers <strong>to</strong> the<br />
286,000-pound <strong>to</strong>tal weight of a loaded railcar. According <strong>to</strong> ASLRRA,<br />
286,000-pound equipment is rapidly becoming the norm for commodities that are<br />
the bread-and-butter for many small railroads – grain, lumber, and paper products.<br />
This heavier equipment puts significant strains on track infrastructure. Many short<br />
lines <strong>to</strong>day cannot handle 286,000-pound cars. To do so would require heavier<br />
weight rail, 21 and upgrading costs are significant, as described earlier. 22 For short<br />
lines with thin operating margins (where revenues barely cover operating costs),<br />
upgrades are cost prohibitive.<br />
According <strong>to</strong> the ASLRRA, these short lines must quickly find funds for massive<br />
capital spending <strong>to</strong> upgrade track and bridges <strong>to</strong> handle larger, heavier freight cars<br />
that shippers and larger railroads are bringing on line in record numbers.<br />
The American Association of <strong>State</strong> Highway and Transportation Officials<br />
(AASHTO) estimated that <strong>to</strong>tal ten-year infrastructure needs for American short<br />
lines and regional railroads <strong>to</strong>tal between $7.9 and $11.8 billion, of which only<br />
19 <strong>to</strong> 23 percent can be funded by the railroads themselves. 23 Beyond internal<br />
company sources and private sec<strong>to</strong>r financing, sources have included programs put<br />
in place by the Federal government and numerous state governments.<br />
The <strong>California</strong> Short Line <strong>Rail</strong>road Association (CSLRRA) asserts that<br />
government support of many short lines is a necessity if these lines are <strong>to</strong> fulfill<br />
their economic role. 24 This fact is recognized by the Federal government as well<br />
as by 30 other states, which have funding programs for short line railroads.<br />
FUNDING SOURCES FOR SHORT LINES<br />
FEDERAL RAIL PROGRAMS<br />
Local <strong>Rail</strong> Freight Assistance<br />
The Federal <strong>Rail</strong> Service Assistance Program was established by the Federal<br />
<strong>Rail</strong>road Revitalization and Regula<strong>to</strong>ry Reform Act of 1976 (4R Act), and was<br />
amended by the Local <strong>Rail</strong> Service Assistance (LRSA) Act of 1978, and the<br />
Omnibus Budget Reconciliation Act of 1981. The LRSA program provided<br />
21 Upgrades for 286-pound cars would call for rail in excess of 100 pounds; 112-pound rail would be typical of an<br />
upgrade.<br />
22 In its 1998 286,000# Upgrading Study Report, the Iowa Department of Transportation estimated the cost of<br />
upgrading a typical branch line <strong>to</strong> a level capable of handling 286,000-pound cars <strong>to</strong>taled $170,000 per mile. This<br />
figure did not include any costs for bridges.<br />
23 The Ten-Year Needs of Short Line and Regional <strong>Rail</strong>roads, AASHTO Standing Committee on <strong>Rail</strong><br />
Transportation, December 1999. This effort surveyed short line and regional railroads regarding their capital<br />
needs. The responses indicated that the railroads have needs <strong>to</strong>taling about $92,000 per mile for track, excluding<br />
signal and bridge improvements. This figure is significantly less than the $170,000 per mile estimated by the Iowa<br />
Department of Transportation as the cost of upgrading a branch line <strong>to</strong> handle 286,000 pound cars and the<br />
$137,000 per mile estimated by ASLRRA. At least in part, the difference appears <strong>to</strong> lie in the fact that not all<br />
railroads responding <strong>to</strong> the AASHTO survey reported a need <strong>to</strong> upgrade track for 286,000-pound cars. The<br />
AASHTO needs calculation also included $1.7 billion for equipment, including cars and locomotives.<br />
24 Per conversations with Mr. David Parkinson, former president, CSLRRA, April 4, 2000.<br />
200
Chapter XVII - Funding<br />
funding on a Federal/local matching share basis for four types of projects:<br />
rehabilitation, new construction, substitute service, and acquisition. The LRSA<br />
program permitted states <strong>to</strong> provide funds on a grant or loan basis.<br />
In 1990, the Local <strong>Rail</strong> Service Reauthorization Act was passed, and the name of<br />
the program was changed <strong>to</strong> Local <strong>Rail</strong> Freight Assistance (LRFA). The criteria<br />
for lines eligible <strong>to</strong> receive assistance also were revised. Funds for the program<br />
were dramatically reduced in the 1990s, and congressional appropriations ceased<br />
in 1995. Over $544 million in Federal funds were expended between 1976 and<br />
1985.<br />
TEA-21 <strong>Rail</strong> Funding<br />
In 1998, the Transportation Equity Act for the 21 st Century (TEA-21) reauthorized<br />
the 1991 Intermodal Surface Transportation Efficiency Act (ISTEA). TEA-21<br />
contained several provisions for rail assistance project funding. In <strong>2005</strong>, the<br />
Federal rail assistance programs were reauthorized, as discussed below.<br />
Tax Credits for Maintenance of <strong>Rail</strong>road Track<br />
Section 245 of the “American Jobs Creation Act of 2004” (Public Law 108-357)<br />
provides a tax credit for 50 percent of railroad track maintenance costs for Class II<br />
and III railroads.<br />
SAFETEA-LU <strong>Rail</strong> Funding<br />
In <strong>2005</strong>, Safe, Accountable, Flexible, Efficient Transportation Equity Act: a<br />
Legacy for Users (SAFETEA-LU) reauthorized the TEA-21. SAFETEA-LU<br />
contained several provisions for rail assistance project funding. Under Section<br />
9003, Rehabilitation and Improvement Financing, priority will be given <strong>to</strong> projects<br />
that enhance service and capacity for shippers in the national rail system.<br />
§1101: Congestion Management and Air Quality Improvement Program<br />
(CMAQ)<br />
This program, continued from TEA-21, provides $8.608 billion in funding for<br />
projects that improve air quality in non-attainment areas as long as measurable<br />
emission reductions can be shown. Freight intermodal facilities are eligible for<br />
funding.<br />
§13<strong>06</strong>: Freight Intermodal Distribution Pilot Grant Program<br />
This new program provides the Ports of Los Angeles and Long Beach $1 million<br />
per year for six years <strong>to</strong> provide capital funding <strong>to</strong> address infrastructure and<br />
freight distribution needs at in land ports and intermodal facilities. Projects are<br />
intended <strong>to</strong> reduce congestion in<strong>to</strong> and out of U.S. international ports, decrease the<br />
number of empty container moves, and encourage the development of inland<br />
intermodal freight terminals.<br />
201
<strong>2005</strong>-<strong>06</strong> – <strong>2015</strong>-<strong>16</strong> <strong>California</strong> <strong>State</strong> <strong>Rail</strong> <strong>Plan</strong><br />
§<strong>16</strong>01 Transportation Infrastructure Finance and Innovation Act (TIFIA)<br />
This program, also continued from TEA-21, provides three types of credit<br />
financing methods for nationally or regionally significant projects. The minimum<br />
threshold for projects is lowered <strong>to</strong> $50 million. Eligible projects include public<br />
freight rail facilities or private rail facilities that demonstrate public benefit.<br />
§9002: <strong>Rail</strong> Line Relocation Grants<br />
This new $1.4 billion rail program provides states with funding <strong>to</strong> mitigate the<br />
adverse effects of rail traffic on safety, mo<strong>to</strong>r vehicle traffic flow, community<br />
quality of life, or economic development by relocating railroad lines away from<br />
down<strong>to</strong>wn areas. Fifty percent of the funds are dedicated <strong>to</strong> projects of $20<br />
million or less; states or non-Federal entities must pay at least ten percent of<br />
project costs.<br />
§9003: Rehabilitation and Improvement Financing<br />
This program provides direct loans and loan guarantees <strong>to</strong> various public and<br />
private entities, including railroads, joint ventures that include at least one railroad,<br />
for projects that are solely for the purpose of constructing a rail connection<br />
between a plant or facility and a second rail carrier for plants served by no more<br />
than a single railroad.<br />
§9007: Study of <strong>Rail</strong> Rehabilitation and Regulation<br />
This is a new $1.8 million program <strong>to</strong> evaluate the status of the national rail<br />
system since the passage of the Staggers <strong>Rail</strong> Act of 1980. This study will be<br />
conducted by the Transportation Research Board of the National Academy of<br />
Sciences. The study will consider the performance of the nation’s railroads<br />
regarding service levels, service quality and rates; projected demand for rail<br />
service over the next 20 years and the constraints <strong>to</strong> meeting that demand;<br />
effectiveness of public policy in balancing the business needs of the railroads with<br />
those of shippers; future role of the STB in regulating railroad rates, service levels<br />
and the railroads’ common carrier obligations if/when railroads become “revenue<br />
adequate.”<br />
STATE PROGRAMS<br />
Most of the states participated in the Federal program in the 1970s and 1980s<br />
when it was well funded, although many states, mostly outside of the Northeast<br />
and Midwest, were slow <strong>to</strong> get involved. At that time, the Class Is owned most<br />
light density lines. The principal issue was branch line abandonment as the larger<br />
carriers sought <strong>to</strong> rationalize their systems in an attempt <strong>to</strong> address their financial<br />
problems. Abandonment cases were common and were fought on both the<br />
planning (with assistance funding) and regula<strong>to</strong>ry fronts.<br />
Today, the problem is assisting short line opera<strong>to</strong>rs. As a result of the spin-off<br />
process that was made possible by railroad deregulation, short line opera<strong>to</strong>rs have<br />
inherited the vast majority of the remaining Class I branch lines. Many short line<br />
202
Chapter XVII - Funding<br />
opera<strong>to</strong>rs manage <strong>to</strong> continue service in cases where the Class Is would have filed<br />
for abandonment. There are 31 states outside <strong>California</strong> that provide assistance<br />
for short line railroad infrastructure improvement projects (see Figure 17A).<br />
Figure 17A<br />
Assistance Programs for <strong>State</strong> Short Line <strong>Rail</strong>roads<br />
Funds<br />
Available<br />
<strong>State</strong><br />
Name of Program<br />
($ in millions) Grant or Loan<br />
Connecticut 70/30 Freight Program $0.5 Grant<br />
Florida Transportation Outreach Program $5.4 Grant<br />
Georgia <strong>State</strong> <strong>Rail</strong> Improvement Funds $0.8 Grant<br />
Idaho<br />
<strong>Rail</strong> Service Preservation<br />
Currently<br />
Unfunded<br />
Grant or Loan<br />
Illinois <strong>State</strong> Loan Fund $2.9 Loan<br />
Indiana Industrial <strong>Rail</strong> Service Fund $1.5 Loan<br />
Iowa <strong>Rail</strong> Assistance Program $1.9 Grant and Loan<br />
Kansas <strong>Rail</strong> Service Improvement Fund $0.2 Loan<br />
Maine Industrial <strong>Rail</strong> Access $2.6 Grant<br />
Maryland Transportation Trust Fund $1.6 Grant<br />
Massachusetts Industrial <strong>Rail</strong> Access<br />
Currently<br />
Unfunded<br />
Grant<br />
Michigan <strong>Rail</strong> Loan Assistance $1.8 Loan<br />
Minnesota <strong>Rail</strong> Service Improvement $8.0 Grant and Loan<br />
Mississippi <strong>Rail</strong>road Revitalization Fund $1.0 Grant<br />
Missouri <strong>Rail</strong> Preservation Fund $2.4 Grant and Loan<br />
Montana <strong>Rail</strong> Service Assistance $1.1 Loan<br />
Nebraska Revolving Loan Fund $1.9 Loan<br />
New Hampshire <strong>Rail</strong> Line Revolving Loan $4.0 Loan<br />
New Jersey <strong>State</strong> <strong>Rail</strong> Assistance $10.0 Grant<br />
New York Industrial <strong>Rail</strong> Access $1.0 Grant<br />
North Carolina <strong>Rail</strong> Industrial Access $2.5 Grant<br />
North Dakota Freight <strong>Rail</strong>road Improvement $6.0 Loan<br />
Ohio <strong>Rail</strong> Development Program $6.5 Grant and Loan<br />
Oklahoma <strong>Rail</strong>road Maintenance Fund $2.4 Grant<br />
Oregon Economic Development Fund $4.5 Grant<br />
Pennsylvania <strong>Rail</strong> Freight Assistance Program $1.8 Grant<br />
Tennessee Transportation Equity Fund $1.2 Grant<br />
Vermont <strong>Rail</strong> Economic Enhancement $0.6 Grant<br />
Virginia <strong>Rail</strong>road Preservation Fund<br />
<strong>Rail</strong> Industrial Act Fund<br />
$2.5<br />
$2.0<br />
Grant<br />
Grant<br />
Washing<strong>to</strong>n Essential <strong>Rail</strong> Assistance $1.0 Grant<br />
Wisconsin <strong>Rail</strong>road Service Assistance $11.1 Loan<br />
203
<strong>2005</strong>-<strong>06</strong> – <strong>2015</strong>-<strong>16</strong> <strong>California</strong> <strong>State</strong> <strong>Rail</strong> <strong>Plan</strong><br />
CALIFORNIA TRAFFIC CONGESTION RELIEF PROGRAM<br />
The Traffic Congestion Relief Program (TCRP) was enacted by the <strong>California</strong><br />
Legislature in June 2000. TCRP included $60 million for improvements <strong>to</strong> the<br />
Northwestern Pacific <strong>Rail</strong>road, as part of the effort <strong>to</strong> reduce truck congestion by<br />
allowing bulk shipments and lumber products <strong>to</strong> return <strong>to</strong> the rails. The TCRP<br />
provided $39.4 million for track upgrades and long-term stabilization projects,<br />
$4.1 million for environmental work, $15.5 million for debt repayment, and<br />
$1.0 million for administrative costs for the North Coast <strong>Rail</strong> Authority (NCRA).<br />
In addition, TCRP provided $150 million <strong>to</strong> the San Gabriel Valley Council of<br />
Governments <strong>to</strong> build grade separations along the Alameda Corridor East in<br />
Los Angeles County. The Cross Valley <strong>Rail</strong> Corridor Joint Powers Agency, made<br />
up of representatives of the cities of Huron, Lemoore, and Visalia received<br />
$4 million in TCRP funds <strong>to</strong> improve the rail infrastructure along the San Joaquin<br />
Valley <strong>Rail</strong>road Huron Line in Fresno, Kings, and Tulare Counties.<br />
The TCRP projects that received funding allocations are going forward including<br />
$19.2 million for NCRA, $61.5 for Alameda Corridor East, and $4 million for the<br />
San Joaquin Valley <strong>Rail</strong>road Huron Line.<br />
NORTHWESTERN PACIFIC RAILROAD<br />
The Northwestern Pacific <strong>Rail</strong>road (NWP) provides a link between the<br />
North Coast and the San Francisco Bay Area. Construction through the rugged<br />
Eel River Canyon was completed in 1914, thus allowing for the movement of<br />
people and goods between Eureka and Tiburon/Sausali<strong>to</strong> with ferry connections <strong>to</strong><br />
San Francisco. The NWP was originally jointly owned by ATSF and SP. In 1929,<br />
the ATSF sold their interest in the NWP <strong>to</strong> the SP.<br />
By 1980, SP had applied <strong>to</strong> the Interstate Commerce Commission (ICC) <strong>to</strong><br />
abandon the NWP between Willits and Eureka. During 1983 ICC public hearings,<br />
numerous parties were opposed <strong>to</strong> the abandonment and the ICC denied SP’s<br />
request. In 1984, SP sold the 172-mile section of the NWP from Willits <strong>to</strong> Eureka<br />
<strong>to</strong> a short line railroad opera<strong>to</strong>r who formed the Eureka Southern <strong>Rail</strong>road<br />
(EUKA). Undercapitalized and saddled with huge monthly loan payments, EUKA<br />
filed for bankruptcy in late 1986. A Federal Bankruptcy Court determined the loss<br />
of the line would have a crucial impact on the North Coast economy and ruled that<br />
a trustee should be appointed <strong>to</strong> continue operating the railroad.<br />
In 1989, the NCRA was created by the <strong>State</strong> Legislature <strong>to</strong> preserve and maintain<br />
a transportation corridor along the North Coast Region. The NCRA is a local<br />
agency made up of members from Humboldt, Mendocino, and Sonoma Counties.<br />
On April 1, 1992, the NCRA purchased the EUKA out of bankruptcy and renamed<br />
the Eureka <strong>to</strong> Willits line, the North Coast <strong>Rail</strong>road.<br />
204
Chapter XVII - Funding<br />
The Northwestern Pacific <strong>Rail</strong>road Authority (NWPRA) was a Joint Powers<br />
Agency composed of the Golden Gate Bridge Highway and Transportation<br />
District (GGBD), Marin County, and the NCRA. On April 30, 1996, the NWPRA<br />
acquired the line between Lombard in Napa County and Healdsburg in Sonoma<br />
County. At the same time, the NCRA also purchased the Healdsburg <strong>to</strong> Willits<br />
segment, and the entire rail line was again renamed the Northwestern Pacific<br />
<strong>Rail</strong>road. In 2004, the Sonoma Marin Area <strong>Rail</strong> Transit District (SMART)<br />
acquired the NWPRA interests and properties. Subsequently the NWPRA was<br />
dissolved and its responsibilities assumed by SMART.<br />
The NCRA and the SMART are both working <strong>to</strong> res<strong>to</strong>re rail services <strong>to</strong> the North<br />
Coast. The NCRA’s primary objective is <strong>to</strong> preserve freight and passenger rail<br />
service. It oversees the freight railroad operations of the 3<strong>06</strong> mile long NWP from<br />
Arcata in Humboldt County <strong>to</strong> Lombard in Napa County. The SMART is<br />
interested in operating commuter rail service from Larkspur <strong>to</strong> Cloverdale.<br />
This railroad has a his<strong>to</strong>ry of being plagued by high maintenance costs due <strong>to</strong><br />
frequent flooding along the Eel River. North of Willits, the railroad has been out<br />
of service since February 1998 due <strong>to</strong> rail damage from the El Niño s<strong>to</strong>rms.<br />
The southern end of operations has seen sporadic operations since being shut<br />
down by the Federal <strong>Rail</strong>road Administration (FRA) in November 1998 due <strong>to</strong><br />
unsafe track conditions. Several construction projects have been completed south<br />
of Willits since 1998. In 2001, a freight operation ran for several months.<br />
A capital needs assessment of the entire line was completed in August 2002.<br />
NCRA hired Willdan Associates and HNTB Companies <strong>to</strong> do the assessment.<br />
It estimated that it would take about $40 million during the initial five years <strong>to</strong><br />
improve and repair the entire railroad and $250 million over the next 20 years.<br />
For the five-year period, this includes $1.1 million for environmental mitigation,<br />
$13.8 million for professional and technical services, $6.3 million for Willits <strong>to</strong><br />
Schellville (south), $13.7 million for the Eel River Canyon and $4.9 million for<br />
the Eureka <strong>to</strong> South Fork (north).<br />
In addition, NCRA commissioned a Financial and Economic Feasibility study that<br />
was completed in January of 2003 by Parsons Brinckerhoff. The market analysis<br />
concluded that the freight market potential along the NWP corridor is relatively<br />
flat but there could be opportunities for growth in the solid waste, aggregate, and<br />
port-related marine industrial activities.<br />
The TCRP funding was delayed due <strong>to</strong> the <strong>State</strong>’s funding situation. Because of<br />
this, NCRA plans <strong>to</strong> use Federal Emergency Management Administration and<br />
matching Governor’s Office of Emergency Services Alternate project funds <strong>to</strong><br />
repair Haystack Landing and Blackpoint Bridges, purchase signals and box cars.<br />
NCRA hopes <strong>to</strong> use Federal demonstration funds (which requires a non-Federal<br />
match) <strong>to</strong> reopen the south-end.<br />
205
<strong>2005</strong>-<strong>06</strong> – <strong>2015</strong>-<strong>16</strong> <strong>California</strong> <strong>State</strong> <strong>Rail</strong> <strong>Plan</strong><br />
The NCRA is committed <strong>to</strong> reopening the entire line (Schellville <strong>to</strong> Eureka) <strong>to</strong> rail<br />
operations. The upgrade of the rail line would range from FRA Class 1 <strong>to</strong><br />
Class 3 standards where practical (based on cost, operational, maintenance, and<br />
environmental issues) and future long-term stabilization of the rail line through the<br />
canyon. The availability of funding is key <strong>to</strong> allowing this upgrading <strong>to</strong> go<br />
forward.<br />
2<strong>06</strong>
Chapter XVIII – Environmental Review<br />
CHAPTER XVIII<br />
ENVIRONMENTAL REVIEW<br />
INTRODUCTION<br />
<strong>California</strong> is aggressively working at improving the <strong>State</strong>’s environment.<br />
Careful stewardship is necessary <strong>to</strong> continue these advances in the natural and<br />
human environment while providing the infrastructure necessary for a vibrant<br />
economy. Freight rail is an integral <strong>to</strong>ol of commerce. The <strong>State</strong> <strong>Rail</strong> <strong>Plan</strong><br />
provides a decision platform <strong>to</strong> consider the current rail conditions, identify<br />
associated environmental issues, and develop candidate responses.<br />
Numerous elements contribute <strong>to</strong> the complex issue of providing a viable freight<br />
system and balancing environmental considerations. Some of these elements<br />
include the following facts:<br />
• Urban areas have serious air quality problems.<br />
• <strong>Rail</strong> corridors have been in place for well over a hundred years.<br />
• Land uses have evolved and grown around these routes.<br />
• Interstate commerce drives Class I railroad practices.<br />
• Private railroads provide a public conveyance.<br />
• <strong>Rail</strong>road ROW is generally privately held.<br />
• Federal positions and responsibilities may preempt state actions.<br />
For this overview, <strong>California</strong>’s Livable Communities objectives will be used for<br />
identifying issue areas for the <strong>State</strong> <strong>to</strong> consider and further analyze as the freight<br />
element of the <strong>State</strong> <strong>Rail</strong> <strong>Plan</strong> is implemented. This overview also provides a<br />
baseline understanding of the following environmental impacts of rail:<br />
• Noise<br />
• Vibration<br />
• Highway-<strong>Rail</strong> Crossings<br />
• Air Quality<br />
207
<strong>2005</strong>-<strong>06</strong> – <strong>2015</strong>-<strong>16</strong> <strong>California</strong> <strong>State</strong> <strong>Rail</strong> <strong>Plan</strong><br />
NOISE<br />
The impacts of noise vary as a function of urban or rural settings, ambient<br />
background levels, sensitivity of the recep<strong>to</strong>r, physical features of the surrounding<br />
landscape, noise sources, and the intensity and frequency of the noise event.<br />
There are three sources of noise from rail operations 25 :<br />
• Propulsion or machinery noise.<br />
• Mechanical noise resulting from wheel/rail interaction.<br />
• Aerodynamic noise resulting from airflow moving past the train.<br />
Propulsion and mechanical noise account for the major noise sources in the<br />
operation of freight rail trains. At slower speeds, propulsion (engine, fan and<br />
braking noise) is the primary source of noise. Diesel-electric engines generate<br />
electricity that drives electric traction mo<strong>to</strong>rs <strong>to</strong> power freight locomotives.<br />
There are large fans located near the <strong>to</strong>p of the power unit <strong>to</strong> cool the engines.<br />
As train speed increases, mechanical and structural sources become the<br />
predominant noise source. Mechanical noise sources include wheel/track<br />
interaction and structural vibrations.<br />
Figure 18A provides a general planning level understanding of the noise level<br />
generated by a mainline freight rail corridor typically carrying five <strong>to</strong> ten trains per<br />
day traveling between 30 and 40 mph. This is a weighted value between day and<br />
night values.<br />
Figure 18A<br />
Noise Exposure from Main Line <strong>Rail</strong>roads 26<br />
Distance from <strong>Rail</strong>road<br />
Lines<br />
(In Feet)<br />
Noise Exposure Estimate<br />
(dBA) Ldn<br />
10-29 75<br />
30-59 70<br />
60-119 65<br />
120-239 60<br />
240-499 55<br />
500-799 50<br />
800+ 45<br />
25 High-Speed Ground Transportation Noise and Vibration Impact Assessment, USDOT FRA, December 1998<br />
26 Ibid.<br />
208
Chapter XVIII – Environmental Review<br />
FEDERAL RULING ON SOUNDING LOCOMOTIVE HORNS<br />
The sounding of locomotive horns for advance warning at public highway-rail<br />
crossings has been a standard practice for over a hundred years. To abate the<br />
impact of noise from operations and locomotive horn use, local communities have<br />
adopted speed limits and prohibitions on horn use. Whistle bans are currently<br />
controlled by <strong>California</strong> Public Utility Commission (CPUC) rules under <strong>California</strong><br />
Law. Communities within three counties in <strong>California</strong> (Los Angeles, Orange, and<br />
Sacramen<strong>to</strong>) have passed such bans at 64 at-grade crossings.<br />
A 1995 FRA study “Nationwide Study of Train Whistle Bans” found an<br />
85 percent increase in the collision rate during ban hours. In 1994, Congress<br />
passed “The Swift <strong>Rail</strong> Development Act” requiring the sounding of horns upon<br />
approach of every public grade crossing. The Act and subsequent legislation<br />
allow exceptions. In response <strong>to</strong> legislation, FRA has issued a Final Rule on the<br />
Use of Locomotive Horns at Highway-<strong>Rail</strong> Grade Crossings. This final rule,<br />
which requires that locomotive horns be sounded as a warning <strong>to</strong> highway users at<br />
public highway-rail crossings, <strong>to</strong>ok effect June 24, <strong>2005</strong>.<br />
Specifics of the plan include:<br />
• Horn level set at either 104 dB or 111 dB.<br />
• Length of time a horn is sounded would be limited.<br />
• Localities or states would be allowed <strong>to</strong> establish approved “quiet zones”<br />
that allow trains <strong>to</strong> operate through such zones without sounding horns.<br />
The rules require FRA <strong>to</strong> approve each such quiet zone based on provision<br />
of appropriate safety measures.<br />
NOISE STANDARDS<br />
The US Environmental Protection Administration (EPA) 27 standards for noise<br />
emission of Interstate <strong>Rail</strong> Carriers are dependent on equipment and operational<br />
conditions. Generally, the EPA sets at a distance of 30 meters, or 100 feet,<br />
an 87 dBA standard at any throttle setting except at idle. The idle standard is<br />
70 dBA. Noise standards for rail cars moving at 45 miles per hour or less are set<br />
at 88 dBA and for movement over 45 mph are set at 93 dBA. The FRA is<br />
empowered <strong>to</strong> force a railroad <strong>to</strong> correct the noise defect or remove the equipment<br />
from service. 28<br />
MITIGATION OF NOISE IMPACTS<br />
Recep<strong>to</strong>rs can be shielded from the noise of a passing train by a number of <strong>to</strong>ols<br />
including noise barriers and sound attenua<strong>to</strong>rs. Noise barriers do not generally<br />
mitigate aerodynamic noise because of the height of the sources. Noise mitigation<br />
27 40 CFR 201 – Noise Emission Standards For Transportation Equipment; Interstate <strong>Rail</strong> Carrier<br />
28 49 CRF 210 – <strong>Rail</strong>road Noise Emission Compliance Regulations<br />
209
<strong>2005</strong>-<strong>06</strong> – <strong>2015</strong>-<strong>16</strong> <strong>California</strong> <strong>State</strong> <strong>Rail</strong> <strong>Plan</strong><br />
measures focus on addressing noise at the source or along the path <strong>to</strong> the recep<strong>to</strong>r.<br />
Source mitigation attempts <strong>to</strong> quiet vehicles, while path mitigation diverts or<br />
buffers the noise.<br />
VIBRATION<br />
In December 1998, in the High-Speed Ground Transportation Noise and Vibration<br />
Impact Assessment, the FRA concluded that, “Vibration can be perceptible and<br />
intrusive <strong>to</strong> building occupants and can cause secondary rattling of windows, items<br />
on shelves, and pictures hanging on walls. In addition, sound reradiated from<br />
vibrating room surfaces, referred <strong>to</strong> as ground-borne noise, often will be audible in<br />
the form of a low-frequency rumbling sound.”<br />
Vibration is very similar <strong>to</strong> noise, in that its intensity is a function of the wave<br />
energy passing through a medium, in this case the earth. A vibration experience<br />
will usually be a ten-second event. The intensity of vibration will vary with<br />
operations, geologic conditions, proximity, structural design, and configuration.<br />
Product designs that attempt <strong>to</strong> minimize vibrations include: resilient fasteners <strong>to</strong><br />
attach rails <strong>to</strong> concrete track slabs (generally not used by freight rail), ballast mats,<br />
resiliently supported ties and floating slabs. Other solutions include heavier rail,<br />
thicker ballast, heavier ties, or resilient elements beneath the tracks.<br />
Wood ties do not transmit motion as readily as concrete ties. However, none of<br />
these mitigation measures have shown great success. More costly but also more<br />
effective solutions include building modifications, trenches, buffer zones, and<br />
operational changes.<br />
RAIL - HIGHWAY GRADE CROSSINGS<br />
One of the most noticeable impacts of rail within a community is related <strong>to</strong><br />
rail-highway crossings. The impacts are manifest in delays <strong>to</strong> highways,<br />
roadways, and pedestrian users, and in increased risk exposure for accidents.<br />
In 2004, there were 34 deaths and 53 injuries resulting from <strong>California</strong> public railhighway<br />
crossing accidents. 29<br />
The CPUC has promulgated a series of General Orders establishing standards and<br />
regulations for rail-highway grade crossing operations, warning devices,<br />
geometrics, construction and maintenance, railroad crossing occupancy, etc.<br />
The CPUC works, in conjunction with the Department, <strong>to</strong> prioritize projects<br />
eligible for Federal Section 130 funding for local at-grade crossing safety<br />
programs.<br />
29 FRA Office of Safety Analysis Database, May, <strong>2005</strong><br />
210
Chapter XVIII – Environmental Review<br />
EXISTING CONDITIONS<br />
According <strong>to</strong> the FRA, <strong>California</strong> has over 10,300 rail crossings of which 3,800<br />
are private, 6,300 are public and 100 are pedestrian. The types of warning devices<br />
used at a particular crossing are a function of the amount of vehicular traffic<br />
coupled with the number of rail movements.<br />
Most rail lines have been in existence for a hundred or more years. In most<br />
communities, land uses have grown up <strong>to</strong> and around the rail alignments.<br />
At-grade crossings present a difficult safety problem for the traveler, railroad, and<br />
community. The ideal public policy would have all crossings separated or closed,<br />
eliminating any at-grade conflicts. Considering local access and mobility impacts<br />
and the significant monetary cost, this is an unreasonable general policy.<br />
<strong>California</strong> has approximately 5,000 at-grade crossings with cross-bucks, the most<br />
rudimentary warning protection. Current funding streams do not allow for an<br />
aggressive response <strong>to</strong> these safety and community impact issues.<br />
RAIL-HIGHWAY ACCIDENTS<br />
<strong>California</strong> had 154 mo<strong>to</strong>r vehicle/rail incidents in 2004. Thirty-one of these<br />
resulted in at least one fatality with an additional 53 injuries reported.<br />
The more severe casualties tended <strong>to</strong> occur on track with trains traveling at higher<br />
speeds. Twenty-seven of the crossing incidents happened in Los Angeles County.<br />
Following Los Angeles County was San Bernardino and Merced Counties with<br />
ten incidents, then Kern and Riverside Counties with nine each.<br />
At-grade highway-rail incidents are problematic in all areas of the <strong>State</strong>, in both<br />
urban and rural settings. Ideally, mitigation actions should be taken <strong>to</strong> improve<br />
crossing safety devices, and when practical, the crossing should be<br />
grade-separated or closed.<br />
The Alameda Corridor Project connects the two San Pedro Bay Ports with the UP<br />
and BNSF railheads close <strong>to</strong> down<strong>to</strong>wn Los Angeles through a 20-mile fully grade<br />
separated corridor. It eliminated 200 at-grade crossings. The corridor passes<br />
mostly through south-central Los Angeles via a depressed (below grade) ROW,<br />
returning <strong>to</strong> the surface at the southern end of the corridor. Street traffic crosses<br />
the trench on bridges. In addition <strong>to</strong> reducing rail freight transit time between<br />
ports and down<strong>to</strong>wn railhead, the Corridor eliminates grade crossings and their<br />
inherent dangers.<br />
The Southern <strong>California</strong> Regional <strong>Rail</strong> Authority (SCRRA)/Metrolink is<br />
introducing a “Sealed Corridor Study” <strong>to</strong> study improvements <strong>to</strong> limit access <strong>to</strong><br />
the rail ROW along the Antelope Valley and Ventura County lines. This is part of<br />
an effort <strong>to</strong> develop such an approach on all Metrolink rail lines.<br />
211
<strong>2005</strong>-<strong>06</strong> – <strong>2015</strong>-<strong>16</strong> <strong>California</strong> <strong>State</strong> <strong>Rail</strong> <strong>Plan</strong><br />
When the department develops intercity rail track and signal upgrade projects, it<br />
evaluates grade crossings within the project limits, and makes improvements <strong>to</strong> the<br />
crossing as part of the overall project.<br />
<strong>State</strong> and a number of communities have also taken steps <strong>to</strong> utilize new and<br />
emerging technology <strong>to</strong> improve crossing safety and reduce crossing impacts.<br />
In Southern <strong>California</strong>, Intelligent Transportation Systems (ITS) technologies such<br />
as advanced vehicle sensors, four-quadrant gates, variable message signs, and<br />
wayside warning horns are being tested.<br />
<strong>California</strong> Operation Lifesaver is a non-profit volunteer organization dedicated <strong>to</strong><br />
eliminating death and injuries resulting from grade crossing collisions and other<br />
pedestrian and vehicular trespassing on railroad property. Most railroads<br />
operating in <strong>California</strong> and many related industries are members. <strong>California</strong><br />
Operation Lifesaver is part of Operation Lifesaver, Incorporated, a national<br />
organization whose efforts focus on three main components: education <strong>to</strong> promote<br />
awareness of the hazards of crossing tracks, engineering for improved warning<br />
devices and signals, and enforcement of traffic regulations at grade crossings and<br />
along rail lines.<br />
AIR QUALITY<br />
The <strong>California</strong> ARB directs <strong>California</strong> air quality programs. Established in 1967,<br />
the ARB is charged <strong>to</strong> attain and maintain healthy air quality, conduct research,<br />
and systematically address major causes of air pollution in 15 air basins and<br />
58 counties. One of the means through which the ARB accomplishes this is<br />
through the moni<strong>to</strong>ring of emissions standards.<br />
There is a clear linkage between rail operations and air quality. As part of normal<br />
operations, trains produce pollutants, such as nitrogen oxides and carbon<br />
monoxide. In 2002, 4.9 percent of the <strong>to</strong>tal <strong>California</strong> statewide mobile emissions<br />
of nitrogen oxides (NOx) and 7.5 percent of sulfur oxides (SOx) were contributed<br />
by rail operations.<br />
Through various emission standards and programs, there has been a significant<br />
reduction in pollution over the years. However, continued growth, physical<br />
conditions, and public health considerations demand continued diligence.<br />
Total organic gases (TOG) include all hydrocarbons (HC). Reactive organic gases<br />
(ROG) include organic gases but exclude methane and a number of low molecular<br />
weight halogenated organics. CO is carbon monoxide. Particulate matter (PM)<br />
refers <strong>to</strong> small solid and liquid particles such as dust, sand, salt spray, and smoke.<br />
PM10 is a subset of PM with particle sizes of an aerodynamic diameter of ten<br />
micrometers or smaller. 30 In comparing locomotive <strong>to</strong>tal emissions <strong>to</strong> <strong>to</strong>tal truck<br />
emissions, truck contributions <strong>to</strong> statewide daily emissions are considerably<br />
212
Chapter XVIII – Environmental Review<br />
higher. Normalizing this data through <strong>to</strong>n-miles transported provides a<br />
comparable emission value per efficiency between modes. On a <strong>to</strong>n-mile basis,<br />
locomotives generate from one-third <strong>to</strong> one-twelfth the emissions of heavy diesel<br />
trucks.<br />
EMISSION STANDARDS FOR RAIL VEHICLES<br />
Smoke emissions from newly manufactured and remanufactured diesel-powered<br />
locomotives and locomotive engines, which had previously been unregulated have<br />
been made subject <strong>to</strong> Federal standards. 31<br />
The new standards result in nearly a two-thirds reduction in NOx emissions and<br />
nearly half the HC and PM emissions nationwide. This equates <strong>to</strong> a 304,000 <strong>to</strong>n<br />
NOx emission reduction in <strong>2005</strong>, equivalent <strong>to</strong> removing nearly 20 million cars<br />
from the road. Because NOx contributes <strong>to</strong> the reduction of secondary PM, the<br />
new standards result in a reduction of 12,000 <strong>to</strong>ns per year of PM. 32<br />
The EPA estimates that the lifetime cost per locomotive will be approximately<br />
$70,000 for the Tier 0 standards, $186,000 for the Tier 1 standards and $252,000<br />
for Tier 2 standards. Lifetime cost components consist of initial equipment costs;<br />
remanufacturing costs; fuel economy costs; and certification, production line and<br />
in-use testing costs. The average annual cost of this program is estimated <strong>to</strong> be<br />
$80 million. This would be about 0.2 percent of the <strong>to</strong>tal freight revenue for<br />
railroads in 1995. The average cost-effectiveness of the standards is expected <strong>to</strong><br />
be about $<strong>16</strong>3 per <strong>to</strong>n of NOx, PM and HC. 33<br />
Due <strong>to</strong> by the interstate nature of railroads, the EPA-adopted regulations preempt<br />
certain local and state requirements for controlling locomotive emissions.<br />
ENFORCEMENT<br />
The EPA rules established an enforcement regime including individual<br />
locomotive/engine certification, requirements for maintenance records for actions<br />
that might impact emission performance, and an annual fleet testing program <strong>to</strong><br />
moni<strong>to</strong>r the in-use emissions. Short line railroads are exempt from EPA<br />
locomotive standards by virtue of being small businesses with less than<br />
500 employees.<br />
The <strong>California</strong> ARB entered in<strong>to</strong> a memorandum of mutual understandings and<br />
agreements with BNSF and UP <strong>to</strong> establish the South Coast Locomotives<br />
Program. The agreement sets a series of fleet performance measures that will<br />
“result in 100 percent replacement with the lower-emitting locomotives over<br />
31 Technical Highlights, Emission Fac<strong>to</strong>rs for Locomotives, US EPA EPA420-F-97-051, December 1997<br />
32 ibid<br />
33 Regula<strong>to</strong>ry Announcement – Final Emissions Standards for Locomotives, US EPA EPA420-F-97-048, December<br />
1997<br />
213
<strong>2005</strong>-<strong>06</strong> – <strong>2015</strong>-<strong>16</strong> <strong>California</strong> <strong>State</strong> <strong>Rail</strong> <strong>Plan</strong><br />
five years from <strong>2005</strong>-2009.” 34 This program further establishes an annual report<br />
regime for the railroads. If established objectives are not met, liquidated damages<br />
apply.<br />
Additional statewide solutions/programs include alternative fuels, liquefied natural<br />
gas, electrification and conversion incentive programs.<br />
34 Memorandum of Mutual Understandings and Agreements, South Coast Locomotive Fleet Average Emission<br />
Program, July 2, 1998<br />
214
Chapter XIX – New Technology<br />
CHAPTER XIX<br />
NEW TECHNOLOGY<br />
GLOBAL POSITIONING SYSTEM APPLICATIONS<br />
Small, low-cost global positioning system (GPS) devices allow tracking of<br />
equipment and personnel with a great degree of precision. The GPS is being<br />
adapted <strong>to</strong> transit use and is an integral part of positive train control systems (PTC)<br />
now being tested (see PTC discussion below). The GPS technology can be used <strong>to</strong><br />
moni<strong>to</strong>r engines, work equipment, and service vehicles, and enable rapid dispatch<br />
of safety or maintenance vehicles <strong>to</strong> a specific location. For example, high-tech<br />
refrigerated boxcars equipped with GPS provide precise real-time location<br />
information. Along with a satellite communications system, these boxcars allow<br />
the railroad <strong>to</strong> remotely moni<strong>to</strong>r and control their on board refrigeration<br />
equipment.<br />
POSITIVE TRAIN CONTROL<br />
New technologies for tracking and controlling train movements are being tested by<br />
Class I carriers in association with the FRA, Association of American <strong>Rail</strong>roads<br />
(AAR), Amtrak, and state transportation agencies. Nomenclature includes<br />
communications-based train control (CBTC), communications-based train<br />
management (CBTM), positive train separation (PTS), and positive train control<br />
(PTC). The PTC seems <strong>to</strong> be a generic term most often employed <strong>to</strong> describe the<br />
developing technology.<br />
The PTC systems permit faster overall train operation with both closer headways<br />
and increased safety. The PTC improves on <strong>to</strong>day’s Centralized Traffic Control<br />
(CTC) systems 35 by utilizing GPS technology <strong>to</strong> locate trains with much greater<br />
levels of precision. It can be supplemented by computer-aided dispatching <strong>to</strong><br />
forecast optimal train movements.<br />
Typical features of the various systems under development include:<br />
• GPS tracking of train movements.<br />
• Wireless data transmission network.<br />
• On board computers <strong>to</strong> receive and process data.<br />
35 Centralized Traffic Control is a technology used on most main lines whereby track switches and signals are<br />
remotely controlled by dispatchers working in a centralized location. Train movements are governed by the<br />
signals, supplemented by radio instructions.<br />
215
<strong>2005</strong>-<strong>06</strong> – <strong>2015</strong>-<strong>16</strong> <strong>California</strong> <strong>State</strong> <strong>Rail</strong> <strong>Plan</strong><br />
• Wayside equipment with track database. 36<br />
• Dispatch center moni<strong>to</strong>ring and control equipment.<br />
• Links <strong>to</strong> grade crossing equipment.<br />
The PTC systems have been tested by UP and BNSF. Amtrak and FRA are testing<br />
PTC on part of the Chicago-Detroit corridor, and the AAR and Illinois Department<br />
of Transportation will fund an installation between Chicago and Springfield.<br />
Amtrak is also installing a variation of PTC in the Northeast Corridor. Contracts<br />
have been issued for testing on CSX Transportation (CSX) and Norfolk Southern<br />
(NS).<br />
Ultimately, FRA will need <strong>to</strong> develop updated rules that include these new train<br />
control systems. Testing of alternative systems will continue, but widespread<br />
application is not anticipated for several years. The promise of PTC as the “next<br />
generation” train control system is that it will enable increased capacity and speed<br />
over existing main traffic routes with high volumes, with a greater level of safety<br />
than provided by current systems. With on board equipment that displays<br />
instructions <strong>to</strong> the engineer, PTC can be employed on non-signaled trackage.<br />
In <strong>California</strong>, PTC would be particularly applicable <strong>to</strong> the <strong>State</strong>’s many routes<br />
used by both freight and passenger trains, as well as <strong>to</strong> freight-only routes with<br />
volumes sufficient <strong>to</strong> justify the installation costs.<br />
INFORMATION TECHNOLOGY APPLICATIONS<br />
Information technology (IT) applications are being adapted by railroads <strong>to</strong><br />
improve productivity of accounting and reporting functions and <strong>to</strong> provide better<br />
service <strong>to</strong> cus<strong>to</strong>mers. Many of these applications have been around since the early<br />
part of the computer age. The challenge facing railroads <strong>to</strong>day is <strong>to</strong> expand IT use<br />
<strong>to</strong> improve communication between carriers and modes and <strong>to</strong> enhance the ability<br />
of shippers <strong>to</strong> interact easily and rapidly via the internet.<br />
Operating practices that benefit from IT applications are train dispatching, crew<br />
assignments, operations moni<strong>to</strong>ring, equipment and facility maintenance records,<br />
and car tracking. Support functions include purchasing, personnel management<br />
and employment functions, invoicing and billing, and exchange of data between<br />
railroads that cooperate with interchange of equipment and run-through trains.<br />
Cus<strong>to</strong>mer services include equipment tracing, switching requests, car supply and<br />
delivery forecasts, and marketing and pricing inquiries. The value of electronic<br />
access will become evident with growing competition between carriers and<br />
between modes and with the increasing desire of shippers for real-time responses<br />
<strong>to</strong> inquiries and needs.<br />
36 The track database includes allowable speeds and other restrictions affecting train operations in the immediate<br />
area. It reduces the need for on board computers <strong>to</strong> maintain an extensive track database covering a much larger<br />
operating area.<br />
2<strong>16</strong>
Chapter XIX – New Technology<br />
One example of an IT application is the development of ways <strong>to</strong> expand<br />
congestion pricing or yield management <strong>to</strong> encourage use back-haul moves that<br />
would otherwise be empty. Previously, this kind of transportation marketing was<br />
often impractical before the widespread use of interrelated computer systems.<br />
All of these fac<strong>to</strong>rs, as discussed above, will further the development of IT<br />
applications and encourage their use on railroads.<br />
ELECTRONIC COMMERCE<br />
Class I carriers have begun <strong>to</strong> partner with outside or affiliated internet companies<br />
<strong>to</strong> integrate many of the functions described above. Services being developed by<br />
such companies promise a greater degree of integration of both internal railroad<br />
functions and cus<strong>to</strong>mer services, expanding the ease of use with a unified internet<br />
“face.” Integration of interline shipments is a goal, providing the cus<strong>to</strong>mer with a<br />
single interface for dealing with all aspects of moving a commodity or product<br />
from one location <strong>to</strong> another over two or more carriers or modes.<br />
The internet services have the ability <strong>to</strong> package the individual railroad computer<br />
and internet applications <strong>to</strong>gether with like services for other transportation<br />
modes. <strong>Rail</strong>road applications are likely <strong>to</strong> be implemented first, with later<br />
inclusion of other shipping modes. Ultimately, regional and short line carriers<br />
could become affiliated with one or more of these services in order <strong>to</strong> expand their<br />
own contact with their cus<strong>to</strong>mers.<br />
LOCOMOTIVE TECHNOLOGY<br />
Diesel-electric engines are now manufactured using alternating current (AC), as<br />
opposed <strong>to</strong> direct current (DC) <strong>to</strong> drive traction mo<strong>to</strong>rs. The AC mo<strong>to</strong>rs provide<br />
greater adhesion, and thus greater pulling power than comparable DC locomotives.<br />
About half of the new locomotives ordered in the past two years have newer AC<br />
technology. The AC share is expected <strong>to</strong> increase in the future, but a market for<br />
DC technology locomotives will remain, particularly for railroads that do not need<br />
the higher tractive capability that comes at a premium price. The AC traction will<br />
reduce the number of locomotives necessary <strong>to</strong> power a train, although at<br />
somewhat higher cost per unit. Three AC coupled locomotives have the tractive<br />
effort of four DC coupled locomotives. The AC locomotives are particularly<br />
suited <strong>to</strong> hauling heavy <strong>to</strong>nnage over grades at lower speeds. Test units appeared<br />
in the late 1980s, and full-scale production locomotives were available by 1993.<br />
The AC technology also has been adapted <strong>to</strong> produce high horsepower<br />
locomotives for higher speed trains, allowing railroads <strong>to</strong> replace two<br />
3,000 horsepower units with a single 6,000 horsepower AC unit.<br />
The AC traction mo<strong>to</strong>rs generally are more efficient and reliable than DC mo<strong>to</strong>rs<br />
primarily because of their greater adhesion. Adhesion is measured as the percent<br />
of a locomotive’s weight on the driving wheels that is converted in<strong>to</strong> tractive<br />
217
<strong>2005</strong>-<strong>06</strong> – <strong>2015</strong>-<strong>16</strong> <strong>California</strong> <strong>State</strong> <strong>Rail</strong> <strong>Plan</strong><br />
effort. The typical large DC locomotive attains about 30 percent adhesion on dry<br />
rails, while AC locomotives attain up <strong>to</strong> 38 percent adhesion in varied weather<br />
conditions. The upper limits of AC locomotive adhesion are still <strong>to</strong> be<br />
determined, but some engineers believe 50 percent is a practical number.<br />
The greater simplicity of AC traction mo<strong>to</strong>rs reduces the potential for down time.<br />
The AC traction mo<strong>to</strong>rs have the ability <strong>to</strong> withstand higher thermal loads, and<br />
thus can operate a greater length of time under a heavy load before overheating.<br />
ELECTRONIC BRAKING<br />
For over a century, US railroads have used the air brake technology developed in<br />
the late 1870s. The system employs air pressure changes controlled from the<br />
locomotive and extending through a continuous air line running the length of the<br />
train, <strong>to</strong> apply and release the brakes on the individual cars. With the advance of<br />
electronics, several versions of electro-pneumatic braking systems have been<br />
developed and are currently being tested. Electronic braking uses electronic<br />
signals <strong>to</strong> control and operate brake valves simultaneously, whereas the standard<br />
system has a lag time as the air pressure changes sequentially throughout the train.<br />
Use of the new technology has centered on unit trains, where all the cars have the<br />
new system. However, several systems under development can operate with<br />
electronically-equipped cars intermixed with cars having traditional air brakes,<br />
allowing for gradual replacement of braking systems on existing cars. Electronic<br />
braking has numerous advantages, including shorter s<strong>to</strong>pping distances, reduced<br />
wheel wear, and fewer mechanically related train delays. The electronic approach<br />
also allows systems <strong>to</strong> incorporate diagnostic sensing and other reporting of train<br />
operating information. With over a million freight cars in interchange service<br />
<strong>to</strong>day, it is estimated that it will take over ten years before the entire car fleet can<br />
be equipped with this technology.<br />
INCREASED CAR CAPACITY<br />
Larger freight cars capable of carrying heavier loads are a technological<br />
improvement with mixed blessings. Larger cars have potential for transportation<br />
savings, but they also require heavier, better-engineered and maintained track and<br />
structures (bridges, trestles, etc.) <strong>to</strong> withstand the greater forces applied <strong>to</strong> the<br />
track. This is a particular problem for many short lines that have infrastructure<br />
that is unable <strong>to</strong> accommodate the heavier cars, as described previously.<br />
Heavier-weight cars reduce car movements for the railroads that have the track<br />
structure able <strong>to</strong> handle them. There are indications that the industry is moving<br />
<strong>to</strong>ward even greater weights per carload with cars capable of up <strong>to</strong><br />
315,000 pounds.<br />
218
Chapter XIX – New Technology<br />
ROLLING STOCK IMPROVEMENTS<br />
Road<strong>Rail</strong>er is an intermodal technology that allows highway trailers 37 <strong>to</strong> be moved<br />
in trains by placing the forward and rearward portions of the trailer on<strong>to</strong> freight car<br />
wheel units. The trailers can be moved over the road with their highway wheels<br />
attached, and at a rail head require only the highway trac<strong>to</strong>r <strong>to</strong> position the trailer<br />
and engage or disengage the railroad wheel units. Road<strong>Rail</strong>er technology avoids<br />
the need for costly capital investments at intermodal facilities <strong>to</strong> lift and move<br />
containers between highway trailers and railroad flat cars. This is particularly<br />
advantageous for low volume operations or for starting up service at a yard whose<br />
location may later be changed (a fail-safe investment policy). Pioneered initially<br />
by NS with trains between the Midwest and the Southeast, this technology is now<br />
being used by many Class I railroads. Swift Transportation Company operates a<br />
Road<strong>Rail</strong>er train over BNSF’s I-5 corridor between Los Angeles and Seattle.<br />
SUMMARY<br />
Nearly all of the technologies described above have productivity implications for<br />
both Class Is and short lines, dealing with means <strong>to</strong> make more effective use of<br />
labor, <strong>to</strong> improve maintenance methods, or <strong>to</strong> operate trains more efficiently over<br />
a constrained rail network. Several technologies promise improved levels of<br />
cus<strong>to</strong>mer service or satisfaction, and a few will contribute <strong>to</strong> enhanced safety in<br />
railroad operations.<br />
37 The trailers, while sized for highway operation, are specially designed and built with sufficient longitudinal<br />
strength <strong>to</strong> pull the weight of 75 <strong>to</strong> 100 similar trailers when mounted on railroad wheel sets.<br />
219
<strong>2005</strong>-<strong>06</strong> – <strong>2015</strong>-<strong>16</strong> <strong>California</strong> <strong>State</strong> <strong>Rail</strong> <strong>Plan</strong><br />
220
Chapter XX – Future Needs<br />
CHAPTER XX<br />
FUTURE NEEDS<br />
In order <strong>to</strong> examine and address state policy as it relates <strong>to</strong> freight railroads, it is<br />
important <strong>to</strong> recognize the costs and revenues associated with providing freight<br />
rail service, including cus<strong>to</strong>mer service, safety, environmental, community and rail<br />
passenger service impact issues among others.<br />
The two large Class I railroads, UP and BNSF, will continue <strong>to</strong> dominate the<br />
Western United <strong>State</strong>s for the foreseeable future. The survival of the 27 short line<br />
railroads currently active in <strong>California</strong> is threatened by an aging infrastructure, and<br />
the inability <strong>to</strong> keep up with the increased weights now being handled by the Class<br />
I railroads.<br />
Freight rail operations are deeply intertwined with intercity and commuter rail<br />
operations. This complicates policy making significantly, since public benefits are<br />
clearly impacted by any decisions affecting the freight railroads.<br />
While Class I freight railroads receive benefits from infrastructure improvements<br />
designed <strong>to</strong> make passenger rail operations more efficient, short line railroads have<br />
no funding sources available <strong>to</strong> them <strong>to</strong> make the necessary infrastructure<br />
improvements <strong>to</strong> allow them <strong>to</strong> continue <strong>to</strong> serve rural communities.<br />
Class I railroads re-invest in track and rolling s<strong>to</strong>ck in ways that sustain and<br />
improve their bot<strong>to</strong>m line. The magnitude of their operations nationwide enables<br />
them <strong>to</strong> selectively invest on an as-needed basis. Continuous upgrades and<br />
improvements are a necessity if the rail freight system in <strong>California</strong> is <strong>to</strong> continue<br />
<strong>to</strong> run efficiently and safely.<br />
The short line railroads provide a wide range of public benefits including<br />
providing service <strong>to</strong> <strong>California</strong>’s agricultural and lumber industries in the more<br />
rural portions of the <strong>State</strong>. Other real or potential public benefits include<br />
improving highway corridor mobility, the environment and safety by provision of<br />
rail service as an option <strong>to</strong> trucking.<br />
To what extent are the short line railways providing an economic benefit <strong>to</strong><br />
regional and local economies? How can this benefit be measured? Short line<br />
railroads act as feeders <strong>to</strong> high volume main line rail routes owned by Class I<br />
railroads. In this instance, they are providing a direct benefit <strong>to</strong> the Class I<br />
railroads. They also provide a benefit <strong>to</strong> the shippers located along branch lines<br />
providing economical transportation and helping <strong>to</strong> retain businesses and jobs in<br />
<strong>California</strong>’s rural regions. In several instances short lines have taken over where<br />
the Class I railroads no longer operate. Class I railroads move high volumes of<br />
freight, eliminating the need for many truck trips.<br />
221
<strong>2005</strong>-<strong>06</strong> – <strong>2015</strong>-<strong>16</strong> <strong>California</strong> <strong>State</strong> <strong>Rail</strong> <strong>Plan</strong><br />
Another public benefit provided the freight railroads is increased modal choices.<br />
For example, if a short line railroad were <strong>to</strong> shut down its rail freight traffic would<br />
have <strong>to</strong> shift <strong>to</strong> trucks on roadways. Many adjacent local roads and highways are<br />
already congested. More trucks transporting goods means more highway<br />
congestion, highway deterioration, and more air pollution from increased diesel<br />
emissions. In addition, along with highway maintenance costs and increased air<br />
pollution, there are the social and economic costs of traffic accidents.<br />
A final question in relation <strong>to</strong> funding is, can investments be justified on the basis<br />
of safety? Since technology of railcars is heading <strong>to</strong>wards larger and heavier cars,<br />
there is a significant need <strong>to</strong> upgrade the infrastructure for the track, bridges and<br />
turnouts. Without adequate infrastructure, railroads would be subject <strong>to</strong> frequent<br />
derailments that would threaten their economic reliability.<br />
222
Appendix<br />
APPENDIX<br />
ACRONYMS<br />
4R Act Federal <strong>Rail</strong>road Revitalization and Regula<strong>to</strong>ry Reform Act of 1976<br />
AAR Association of American <strong>Rail</strong>roads<br />
AB Assembly Bill<br />
AC Alternating Current<br />
AC Transit Alameda-Contra Costa Transit District<br />
ACCMA Alameda County Congestion Management Agency<br />
ACE Altamont Commuter Express<br />
ACR Assembly Concurrent Resolution<br />
ADA Americans with Disabilities Act<br />
ARB <strong>California</strong> Air Resources Board<br />
ASLRRA American Short Line and Regional <strong>Rail</strong>road Association<br />
ASSHTO American Association of <strong>State</strong> Highway and Transportation Officials<br />
ATSF Atchison Topeka and Santa Fe <strong>Rail</strong>way Company<br />
BART Bay Area Rapid Transit District<br />
BN Burling<strong>to</strong>n Northern <strong>Rail</strong>road Company<br />
BNSF Burling<strong>to</strong>n Northern Santa Fe <strong>Rail</strong>way Company<br />
BTH Business, Transportation and Housing Agency<br />
CCJPA Capi<strong>to</strong>l Corridor Joint Powers Authority<br />
CEQA <strong>California</strong> Environmental Quality Act<br />
CHSRA <strong>California</strong> High Speed <strong>Rail</strong> Authority<br />
CMAQ Congestion Mitigation and Air Quality Improvement Program<br />
CNSSTC <strong>California</strong>-Nevada Super Speed Train Commission<br />
COFC Container on Flat Car<br />
CORP Central Oregon and Pacific <strong>Rail</strong>road Company<br />
CP Control Point<br />
CPUC <strong>California</strong> Public Utilities Commission<br />
CRCC Coast <strong>Rail</strong> Coordinating Council<br />
CSLRRA <strong>California</strong> Short Line <strong>Rail</strong>road Association<br />
CTC Centralized Traffic Control<br />
DC Direct Current<br />
DMU Diesel Multiple Unit <strong>Rail</strong>car<br />
EIR Environmental Impact Report<br />
EIS Environmental Impact <strong>State</strong>ment<br />
EUKA Eureka Southern <strong>Rail</strong>road Company<br />
FFY Federal Fiscal Year<br />
FHWA Federal Highway Administration<br />
FRA Federal <strong>Rail</strong>road Administration<br />
FTA Federal Transit Administration<br />
GF General Fund<br />
223
<strong>2005</strong>-<strong>06</strong> – <strong>2015</strong>-<strong>16</strong> <strong>California</strong> <strong>State</strong> <strong>Rail</strong> <strong>Plan</strong><br />
Acronyms<br />
Continued<br />
GGBD Golden Gate Bridge, Highway and Transportation District<br />
GMAP Goods Movement Action <strong>Plan</strong><br />
GPS Global Positioning System<br />
ICC Interstate Commerce Commission<br />
ICRP <strong>California</strong> Intercity <strong>Rail</strong> Capital Program<br />
IMC Intermodal Marketing Company<br />
IOS Initial Operating Segment<br />
ISTEA Intermodal Surface Transportation Efficiency Act<br />
IT Information Technology<br />
ITA Interagency Transfer Agreement<br />
ITIP Interregional Transportation Improvement Program<br />
ITSP Interregional Transportation Strategic <strong>Plan</strong><br />
JPA Joint Powers Authority<br />
JPB Peninsula Corridor Joint Powers Board<br />
LACMTA Los Angeles County Metropolitan Transportation Authority<br />
LAUS Los Angeles Union Station<br />
LAX Los Angeles International Airport<br />
LNG Liquefied Natural Gas<br />
LRFA Local <strong>Rail</strong> Freight Assistance<br />
LRSA Local <strong>Rail</strong> Service Assistance Act of 1978<br />
Maglev Magnetic Levitation<br />
MTC Metropolitan Transportation Commission<br />
MTDB Metropolitan Transit Development Board<br />
NCRA North Coast <strong>Rail</strong> Authority<br />
NCTD North County Transit District<br />
NEPA National Environmental Policy Act<br />
NWP Northwestern Pacific <strong>Rail</strong>road<br />
NWPRA Northwestern Pacific <strong>Rail</strong>road Authority<br />
OCTA Orange County Transportation Authority<br />
OTP On-Time Performance<br />
PA Public Address System<br />
PEIR Programmatic Environmental Impact Report<br />
PEIS Programmatic Environmental Impact <strong>State</strong>ment<br />
PTA Public Transportation Account<br />
PTC Positive Train Control System<br />
RCTC Riverside County Transportation Commission<br />
RFP Request for Proposal<br />
ROW Right-of-Way or Rights-of-Way<br />
RPSA Federal <strong>Rail</strong> Passenger Service Act<br />
RTIP Regional Transportation Improvement Program<br />
224
Appendix<br />
SAFETEA-LU<br />
SamTrans<br />
SANBAG<br />
SB<br />
SCAG<br />
SCRRA<br />
SDNR<br />
SHA<br />
SJRRC<br />
SLO Transit<br />
SMART<br />
SMCTA<br />
SP<br />
STA<br />
STB<br />
STIP<br />
TAMC<br />
TCI<br />
TCRF<br />
TCRP<br />
TDA<br />
TDIF<br />
TEA-21<br />
TIF<br />
TIFIA<br />
TIP<br />
TOFC<br />
UP<br />
USDOT<br />
VCTC<br />
VRU<br />
VTA<br />
WP<br />
WTTN<br />
Acronyms<br />
Continued<br />
Safe, Accountable, Flexible, Efficient Transportation Equity Act: a Legacy<br />
for Users<br />
San Mateo County Transit District<br />
San Bernardino Associated Governments<br />
Senate Bill<br />
Southern <strong>California</strong> Association of Governments<br />
Southern <strong>California</strong> Regional <strong>Rail</strong> Authority<br />
San Diego Northern <strong>Rail</strong>way<br />
<strong>State</strong> Highway Account<br />
San Joaquin Regional <strong>Rail</strong> Commission<br />
San Luis Obispo Regional Transit<br />
Sonoma Marin Area <strong>Rail</strong> Transit District<br />
San Mateo County Transportation Authority<br />
Southern Pacific Transportation Company<br />
<strong>State</strong> Transportation Assistance Program<br />
Surface Transportation Board<br />
<strong>State</strong> Transportation Improvement Program<br />
Transportation Agency for Monterey County<br />
Transit Capital Improvement Program<br />
Traffic Congestion Relief Fund<br />
Traffic Congestion Relief Program<br />
Transportation Development Act<br />
Transportation Deferred Investment Fund<br />
Transportation Equity Act for the 21 st Century<br />
Transportation Investment Fund<br />
Federal Transportation Infrastructure Finance and Innovation Act<br />
Transportation Improvement <strong>Plan</strong><br />
Trailer on Flat Car<br />
Union Pacific <strong>Rail</strong>road Company<br />
United <strong>State</strong>s Department of Transportation<br />
Ventura County Transportation Commission<br />
Voice Response Unit<br />
Valley Transit Agency<br />
Western Pacific <strong>Rail</strong>road Company<br />
Western Transportation Trade Network<br />
225