California State Rail Plan 2007-08 to 2017-18
California State Rail Plan 2007-08 to 2017-18
California State Rail Plan 2007-08 to 2017-18
- No tags were found...

Create successful ePaper yourself
Turn your PDF publications into a flip-book with our unique Google optimized e-Paper software.
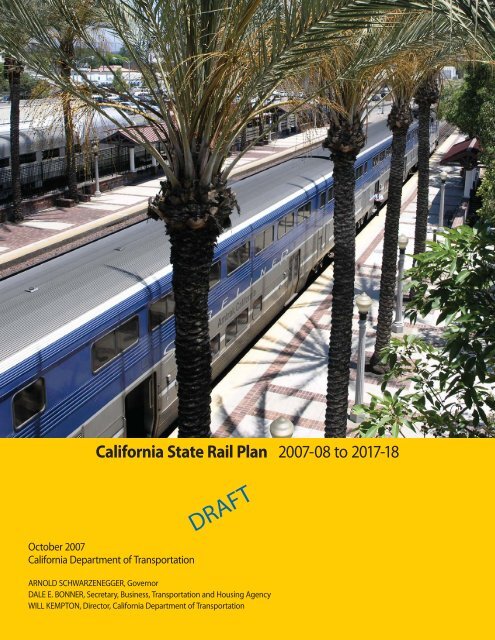
<strong>California</strong> <strong>State</strong> <strong>Rail</strong> <strong>Plan</strong> <strong>2007</strong>-<strong>08</strong> <strong>to</strong> <strong>2017</strong>-<strong>18</strong>Oc<strong>to</strong>ber <strong>2007</strong><strong>California</strong> Department of TransportationDRAFTARNOLD SCHWARZENEGGER, GovernorDALE E. BONNER, Secretary, Business, Transportation and Housing AgencyWILL KEMPTON, Direc<strong>to</strong>r, <strong>California</strong> Department of Transportation
CALIFORNIA STATE RAIL PLAN<strong>2007</strong>-<strong>08</strong> TO <strong>2017</strong>-<strong>18</strong>Oc<strong>to</strong>ber <strong>2007</strong><strong>California</strong> Department of Transportation
<strong>2007</strong>-<strong>08</strong> – <strong>2017</strong>-<strong>18</strong> <strong>California</strong> <strong>State</strong> <strong>Rail</strong> <strong>Plan</strong>
Table of ContentsTable of ContentsExecutive Summary ....................................................................................... 1Introduction................................................................................................... 1Part I - Passenger <strong>Rail</strong> Element .................................................................. 3Chapter I - <strong>California</strong>’s Vision for Intercity Passenger <strong>Rail</strong> ................... 5The Administration’s Strategic Growth <strong>Plan</strong> – A Framework for the Future ..... 6Air Quality Initiatives........................................................................................... 7<strong>California</strong> transportation <strong>Plan</strong> .............................................................................. 8The Department’s Mission & Vision and Strategic Goals................................... 8The Department’s Mission and Vision For Intercity Passenger <strong>Rail</strong>................... 9Intercity Passenger <strong>Rail</strong> Mission ..................................................................... 9Intercity Passenger <strong>Rail</strong> Vision ....................................................................... 9Intercity <strong>Rail</strong> is a Key Component of <strong>California</strong>’s Vision for Transportation .. 10<strong>Rail</strong> Furthers the Department’s Mission & Goals ......................................... 11Intercity <strong>Rail</strong> Supports the Administration’s Transportation,Environmental and Land Use Goals.......................................................... 13Chapter II - Capital Program.................................................................... 17Capital Program Goals ....................................................................................... 17Unconstrained Ten-Year Capital Program......................................................... 17Projected Capital Projects .................................................................................. 19Corridor Strategic <strong>Plan</strong>ning................................................................................ 24Pacific Surfliner Route .................................................................................. 24San Joaquin Route......................................................................................... 25Capi<strong>to</strong>l Corridor............................................................................................ 25Other Proposed Routes .................................................................................. 26Constrained Capital Program ............................................................................. 26Capital Program Funding ................................................................................... 27His<strong>to</strong>ry ........................................................................................................... 27Outlook .......................................................................................................... 29Rolling S<strong>to</strong>ck Program ....................................................................................... 30Rolling S<strong>to</strong>ck Fleet ........................................................................................ 30Rolling S<strong>to</strong>ck Maintenance and Overhaul Program...................................... 31<strong>Rail</strong>-Highway Grade Crossing Improvement and Separation Programs....... 33<strong>State</strong> Section 190 Grade Separation Program................................................ 34Proposition 1B Highway-<strong>Rail</strong>road Crossing Program .................................. 34Federal Section 130 Crossing Improvement Program................................... 35Federal Section 1010/1103(c) <strong>Rail</strong>way-Highway Crossing HazardElimination in High Speed <strong>Rail</strong> Corridors Program ................................. 36Station Programs ................................................................................................ 36Parking Facilities at Intercity <strong>Rail</strong> Stations ................................................... 36Decrepit Stations............................................................................................ 37i
Table of ContentsTable of Contents(continued)Chapter VI - Pacific Surfliner Route ........................................................ 91Ten-Year Operational and Service Improvement <strong>Plan</strong>s..................................... 92On-Time Performance and Reliability .......................................................... 92Streamlined Operations and Passenger Amenities ........................................ 93Multimodal Connectivity............................................................................... 94Travel Times.................................................................................................. 95Ridership, Revenue, and Farebox Ratio ........................................................ 96Ten-Year Train Service Expansion <strong>Plan</strong>s .......................................................... 96Increased Service Frequencies....................................................................... 96San Francisco <strong>to</strong> San Luis Obispo (and Los Angeles) Extension ................. 96Route Administration ......................................................................................... 97LOSSAN........................................................................................................ 97Route His<strong>to</strong>ry ..................................................................................................... 97Route Description............................................................................................... 99His<strong>to</strong>rical Performance..................................................................................... 100Chapter VII - San Joaquin Route............................................................ 105Ten-Year Operational and Service Improvement <strong>Plan</strong>s................................... 106On-Time Performance and Reliability ........................................................ 106Streamlined Operations and Passenger Amenities ...................................... 107Multimodal Connectivy............................................................................... 110Travel Times................................................................................................ 112Ridership, Revenue, and Farebox Ratio ...................................................... 112Ten-Year Train Service Expansion <strong>Plan</strong>s ........................................................ 112Increased Service Frequencies..................................................................... 112Oakland-S<strong>to</strong>ck<strong>to</strong>n ........................................................................................ 112Bakersfield <strong>to</strong> Los Angeles.......................................................................... 113Route Administration ....................................................................................... 114San Joaquin Valley <strong>Rail</strong> Committee............................................................ 114Route His<strong>to</strong>ry ................................................................................................... 114Route Description............................................................................................. 115His<strong>to</strong>rical Performance..................................................................................... 117Chapter VIII - The Capi<strong>to</strong>l Corridor ....................................................... 121Route Administration ....................................................................................... 122Ten-Year Operational and Service Improvement <strong>Plan</strong>s................................... 123On-Time Performance ................................................................................. 123Enhance Cus<strong>to</strong>mer Satisfaction ................................................................... 123Comprehensive Wireless Network .............................................................. 123Multimodal Connectivity............................................................................. 125Travel Times................................................................................................ 126Ridership, Revenue, and Farebox Ratio ...................................................... 127iii
<strong>2007</strong>-<strong>08</strong> – <strong>2017</strong>-<strong>18</strong> <strong>California</strong> <strong>State</strong> <strong>Rail</strong> <strong>Plan</strong>Table of Contents(continued)Ten-Year <strong>Plan</strong>ned Train Service Expansion <strong>Plan</strong>s .......................................... 127Increased Service Frequencies..................................................................... 127Sacramen<strong>to</strong>-Reno Extension........................................................................ 128Dumbar<strong>to</strong>n <strong>Rail</strong> Corridor............................................................................. 128Auburn-Oakland Regional <strong>Rail</strong> Service...................................................... 128Route His<strong>to</strong>ry ................................................................................................... 129Route Description............................................................................................. 130His<strong>to</strong>rical Performance..................................................................................... 131Chapter IX - Commuter <strong>Rail</strong> Services.................................................... 135Coaster Commuter <strong>Rail</strong> Service (San Diego-Oceanside) ............................... 135Background.................................................................................................. 136Organizational Structure.............................................................................. 138Route and Service Description .................................................................... 138Fare Structure............................................................................................... 138Connecting Services .................................................................................... 139Performance................................................................................................. 139Regional Service Initiatives......................................................................... 140Capital Improvement Program .................................................................... 140Metrolink Commuter <strong>Rail</strong> Service (Los Angeles, Orange, Riverside,San Bernardino, and Ventura Counties)...................................................... 142Background.................................................................................................. 143Organizational Structure.............................................................................. 143Route and Service Description .................................................................... 144Fare Structure............................................................................................... 145Connecting Services .................................................................................... 146Performance................................................................................................. 146Capital Improvement Program .................................................................... 146Proposed Service Enhancements ................................................................. 147Caltrain Commuter <strong>Rail</strong> Service (San Francisco-San Jose-Gilroy)................ 151Background.................................................................................................. 151Organizational Structure.............................................................................. 152Route and Service Description .................................................................... 152Fare Structure............................................................................................... 153Connecting Services .................................................................................... 153Performance................................................................................................. 154<strong>Plan</strong>ned Improvements ................................................................................ 155Capital Improvement Program .................................................................... 155Proposed Service Extensions....................................................................... 157iv
Table of ContentsTable of Contents(continued)ACE Commuter <strong>Rail</strong> Service (S<strong>to</strong>ck<strong>to</strong>n-San Jose)......................................... 158Background.................................................................................................. 158Organizational Structure.............................................................................. 159Route and Service Description .................................................................... 160Fare Structure............................................................................................... 160Connecting Services .................................................................................... 160Performance................................................................................................. 161<strong>Plan</strong>ned Improvements ................................................................................ 161Capital Improvement Program .................................................................... 161Proposed Service Extensions....................................................................... 162Proposed Commuter <strong>Rail</strong> Services................................................................... 162Ventura and Santa Barbara Commuter <strong>Rail</strong> Service ................................... 162Sonoma Marin-Area <strong>Rail</strong> Transit ................................................................ 162Auburn-Oakland Regional <strong>Rail</strong> Service...................................................... 163Chapter X - Potential New Services........................................................ 167Proposed Intercity <strong>Rail</strong> Routes......................................................................... 167San Francisco <strong>to</strong> San Luis Obispo (and Los Angeles)Via Coast Route (Coast Daylight)........................................................... 167Sacramen<strong>to</strong> <strong>to</strong> Reno..................................................................................... 169Sacramen<strong>to</strong> <strong>to</strong> Redding................................................................................ 170Potential Intercity <strong>Rail</strong> Routes ......................................................................... 171Los Angeles <strong>to</strong> Indio (Coachella Valley) .................................................... 171San Francisco <strong>to</strong> Monterey .......................................................................... 172Los Angeles <strong>to</strong> Las Vegas ........................................................................... 174High-Speed <strong>Rail</strong> ............................................................................................... 175Background.................................................................................................. 175<strong>California</strong> High-Speed <strong>Rail</strong> Authority......................................................... 175DesertXpress................................................................................................ 177Magnetic Levitation ......................................................................................... <strong>18</strong>0Southern <strong>California</strong> Maglev Project............................................................ <strong>18</strong>0Las Vegas-Anaheim Maglev Project........................................................... <strong>18</strong>2Chapter XI - Amtrak................................................................................ <strong>18</strong>5Amtrak’s Relationship with the Department and the Capi<strong>to</strong>l CorridorJoint Powers Authority ................................................................................ <strong>18</strong>5Amtrak <strong>Plan</strong>ning .............................................................................................. <strong>18</strong>6Amtrak Strategic Reform Initiative and FY 06 Grant Request ................... <strong>18</strong>6Amtrak’s 2004 Strategic Business <strong>Plan</strong>....................................................... <strong>18</strong>7v
<strong>2007</strong>-<strong>08</strong> – <strong>2017</strong>-<strong>18</strong> <strong>California</strong> <strong>State</strong> <strong>Rail</strong> <strong>Plan</strong>Table of Contents(continued)Amtrak Reform and Budget ............................................................................. 190FFY 2006 Budget and Legislative Reform Proposal .................................. 190FFY 2006 Budget and Legislative Reform Proposals................................. 191FFY <strong>2007</strong> Budget and Legislative Reform Proposals................................. 191FFY 20<strong>08</strong> Budget and Legislative Reform Proposals................................. 192Chapter XII - Intercity <strong>Rail</strong> Funding ..................................................... 193Public Transportation Account......................................................................... 193Public Transportation Account Funding Sources........................................ 193Repayment of the PTA ................................................................................ 194Use of PTA Funds ....................................................................................... 195<strong>State</strong> Highway Account.................................................................................... 195Traffic Congestion Relief Fund........................................................................ 196Proposition 1B – Highway Safety, Traffic Reduction, Air Quality andPort Security Bond Act of 2006 .................................................................. 196The Passenger <strong>Rail</strong> and Clean Air Bond Act of 1990 (Proposition 1<strong>08</strong>) ....... 197Clean Air and Transportation Improvement Act of 1990 (Proposition 116)... 197Tribal Compact Bonds ..................................................................................... 197General Fund .................................................................................................... 198Local Funds ...................................................................................................... 198Federal Funds ................................................................................................... 198Amtrak Funds................................................................................................... 199<strong>Rail</strong>road Funds ................................................................................................. 199Part II - Freight <strong>Rail</strong> Element ................................................................. 201Chapter XIII - Introduction .................................................................... 203Chapter XIV - Policy <strong>State</strong>ment/Recommendations............................. 205Policy <strong>State</strong>ment No. 1: <strong>California</strong> Strategic Interest ...................................... 205Importance of the Freight <strong>Rail</strong> System <strong>to</strong> <strong>California</strong> .................................. 205The Strategic Growth <strong>Plan</strong> .......................................................................... 206Policy <strong>State</strong>ment No. 2: System <strong>Plan</strong>ning........................................................ 2<strong>08</strong>Policy <strong>State</strong>ment No. 3: <strong>Rail</strong> Preservation....................................................... 209Policy <strong>State</strong>ment No. 4: Environment.............................................................. 210Policy <strong>State</strong>ment No. 5: Funding ..................................................................... 210Policy <strong>State</strong>ment No. 6: Partnerships............................................................... 211Chapter XV - System Overview .............................................................. 213Network Description ........................................................................................ 213Economic Significance <strong>to</strong> the <strong>State</strong>.................................................................. 213vi
Table of ContentsTable of Contents(continued)Chapter XVI - Major Freight Issues....................................................... 217Significant Trends ............................................................................................ 217International Trade Growth ......................................................................... 217The Changing Nature of <strong>Rail</strong> Freight Movements/ Commodities .............. 219Logistics Practices ....................................................................................... 224Operational Conflicts: Passenger/Freight; Freight/Freight ............................. 228Shared Use of Rights-of-Way...................................................................... 228Joint Dispatching of Freight Operations...................................................... 228Fresno <strong>Rail</strong> Consolidation ........................................................................... 229Major Issues for <strong>California</strong> <strong>Rail</strong> Shippers ................................................... 229Short Line <strong>Rail</strong>road Issues ............................................................................... 230Interface with Class I <strong>Rail</strong>roads................................................................... 230Track Infrastructure Capability ................................................................... 231Capital Availability...................................................................................... 231<strong>Rail</strong> System Preservation ................................................................................. 232Truck Diversion <strong>to</strong> <strong>Rail</strong>, Short-Haul <strong>Rail</strong> Shuttles .......................................... 233Elements Needed <strong>to</strong> Support Short Haul Intermodal <strong>Rail</strong> Service.............. 233Examples of Successful Short Haul Intermodal <strong>Rail</strong> Service ..................... 234Public/Private Sec<strong>to</strong>r Coordination.................................................................. 235Chapter XVII - Environmental Considerations .................................... 237Overview .......................................................................................................... 237Air Quality........................................................................................................ 238Emission Inven<strong>to</strong>ry/Characteristics.................................................................. 239Air Quality and Emission Regulation .............................................................. 240Emission Reduction Strategies......................................................................... 241Environmental Justice ...................................................................................... 242Highway-<strong>Rail</strong> Crossings .................................................................................. 243Chapter XVIII - Funding......................................................................... 245System Capital Needs....................................................................................... 245Public Investment in Private Infrastructure...................................................... 246<strong>Rail</strong> Investment Drivers............................................................................... 247Funding Alternatives ........................................................................................ 247<strong>State</strong> General Fund Programs ...................................................................... 248Bond Funding .............................................................................................. 249Federal Programs......................................................................................... 250Public/Private Partnership (P3) and Local Initiatives ................................. 253User Fees ..................................................................................................... 254vii
<strong>2007</strong>-<strong>08</strong> – <strong>2017</strong>-<strong>18</strong> <strong>California</strong> <strong>State</strong> <strong>Rail</strong> <strong>Plan</strong>Table of Contents(continued)Chapter XIX - Freight <strong>Rail</strong> Research and Studies................................ 255Investment Models ........................................................................................... 255Performance Outcomes, Criteria and Moni<strong>to</strong>ring............................................ 259Freight <strong>Rail</strong> Element - Acknowledgements............................................ 263Appendix - Acronyms............................................................................... 265viii
Table of FiguresTable of FiguresFigure 1A – Transportation Mobility Framework .................................................. 5Figure 1B – General Obligation bond (Proposition 1B)........................................ 7Figure 1C – Annual Ridership for Amtrak <strong>California</strong> Service ............................. 10Figure 1D – Relationship of Intercity Passenger <strong>Rail</strong> <strong>to</strong> the Deparment’sStrategic Goals ............................................................................................... 12Figure 1E – U. S. Passenger Travel and Energy Use........................................... 13Figure 2A – Unconstrained Ten-Year Intercity <strong>Rail</strong> Capital ProgramProject Costs................................................................................................... 19Figure 2B – Unconstrained Capital Program Projects........................................ 20Figure 2C – Constrained Ten-Year Intercity <strong>Rail</strong> Capital ProgramProject Costs................................................................................................... 27Figure 2D – Intercity <strong>Rail</strong> Capital Program Funding His<strong>to</strong>ry............................. 29Figure 2E – Intercity <strong>Rail</strong> Rolling S<strong>to</strong>ck Overhaul Program ............................... 33Figure 2F – Section 130 Federal Crossing Improvement ProgramFunding Status................................................................................................ 35Figure 3A – Intercity <strong>Rail</strong> Ridership and Service Levels...................................... 42Figure 3B – Intercity <strong>Rail</strong> Operations Financial <strong>Plan</strong> ......................................... 43Figure 3C – Performance by Route....................................................................... 44Figure 3D – <strong>State</strong> Costs by Route ......................................................................... 45Figure 3E – Route Objectives by Corridor ........................................................... 46Figure 3F – Intercity <strong>Rail</strong> Administration and Marketing Costs.......................... 47Figure 3G – Comprehensive Wireless Network Applications............................... 55Figure 3H – Amtrak Connecting Bus Performance.............................................. 59Figure 3I – <strong>Rail</strong> 2 <strong>Rail</strong> Service Map ..................................................................... 63Figure 3J – <strong>Rail</strong> Access <strong>to</strong> Major <strong>California</strong> Airports ......................................... 65Figure 5A – <strong>California</strong> Intercity and Commuter Passenger <strong>Rail</strong> Network Map.. 76Figure 5B – <strong>Rail</strong> Passenger Services in <strong>California</strong> .............................................. 78Figure 5C – Annual Intercity and Commuter <strong>Rail</strong> Ridership in <strong>California</strong> ......... 79Figure 5D – <strong>State</strong>-Supported Intercity <strong>Rail</strong> and Feeder Bus Routes Map............ 82Figure 5E – Amtrak Basic System Routes in <strong>California</strong> Map............................... 84Figure 5F – Amtrak Train and Bus Ridership by Station ..................................... 86Figure 6A – Pacific Surfliner Intercity <strong>Rail</strong> and Feeder Bus Routes Map ........... 90Figure 6B – Pacific Surfliner Route Ownership and Track Characteristics...... 100Figure 6C – Pacific Surfliner Route Annual Operating Performance................ 102Figure 7A – San Joaquin Intercity <strong>Rail</strong> and Feeder Bus Routes Map................ 104Figure 7B – San Joaquin Route Ownership and Track Characteristics............. 116Figure 7C – San Joaquin Route Annual Operating Performance ...................... 1<strong>18</strong>Figure 8A – Capi<strong>to</strong>l Corridor Intercity <strong>Rail</strong> and Feeder Bus Routes Map ........ 120Figure 8B – Capi<strong>to</strong>l Corridor Ownership and Track Characteristics ............... 130Figure 8C – Capi<strong>to</strong>l Corridor Annual Operating Performance ......................... 132ix
<strong>2007</strong>-<strong>08</strong> – <strong>2017</strong>-<strong>18</strong> <strong>California</strong> <strong>State</strong> <strong>Rail</strong> <strong>Plan</strong>Table of Figures(continued)Figure 9A – <strong>California</strong> Intercity and Commuter Passenger <strong>Rail</strong>Network Map ................................................................................................ 134Figure 9B – Southern <strong>California</strong> Commuter <strong>Rail</strong> Routes Map........................... 137Figure 9C – Coaster Annual Ridership and OTP ............................................... 139Figure 9D – Metrolink Annual Ridership ........................................................... 146Figure 9E – Metrolink Weekday Service Levels for the Strategic Assessment... 149Figure 9F – Northern <strong>California</strong> Commuter <strong>Rail</strong> Routes Map .......................... 150Figure 9G – Caltrain Annual Ridership.............................................................. 154Figure 9H – ACE Annual Ridership ................................................................... 161Figure 10A – Potential New Intercity <strong>Rail</strong> Routes in <strong>California</strong>........................ 166Figure 10B – High Speed <strong>Rail</strong> and Maglev Routes Under Studyin <strong>California</strong> ................................................................................................. 179Figure 11A – Amtrak Five-Year Strategic <strong>Plan</strong> – Capital Projects –FFY 2005-09................................................................................................. <strong>18</strong>9Figure 15A – <strong>Rail</strong>road Service in <strong>California</strong>...................................................... 214Figure 15B – Freight <strong>Rail</strong>roads Operating in <strong>California</strong> .................................. 215Figure 16A – Examples of Key Required Freight <strong>Rail</strong> Projects in <strong>California</strong>... 220Figure 19A – Framework for Evaluating Transportation Investments .............. 257Figure 19B – AAR Freight Car Type Mechanical Designations ........................ 260Figure 19C – Car Ownership Types ................................................................... 260x
<strong>California</strong> <strong>State</strong> <strong>Rail</strong> <strong>Plan</strong> <strong>2007</strong>-<strong>08</strong> <strong>to</strong> <strong>2017</strong>-<strong>18</strong>EXECUTIVE SUMMARYOc<strong>to</strong>ber <strong>2007</strong><strong>California</strong> Department of TransportationDRAFTARNOLD SCHWARZENEGGER, GovernorDALE E. BONNER, Secretary, Business, Transportation and Housing AgencyWILL KEMPTON, Direc<strong>to</strong>r, <strong>California</strong> Department of Transportation
Executive SummaryIntroductionGovernment Code Section 14036 requires the <strong>California</strong> Department ofTransportation (Department) <strong>to</strong> complete a ten-year rail plan with bothpassenger and freight rail elements, and that the <strong>Rail</strong> <strong>Plan</strong> be updated everytwo years. The passenger rail element been prepared by the Division of <strong>Rail</strong>and is covered in Part I (Chapters I through XII). The freight rail element hasbeen prepared by the Division of Transportation <strong>Plan</strong>ning, and is covered inPart II (Chapters XIII through XIX).PART IPassenger <strong>Rail</strong> ElementChapter I<strong>California</strong>’s Vision for Intercity Passenger <strong>Rail</strong>Transportation in <strong>California</strong> is guided by the Governor’s Strategic Growth <strong>Plan</strong>,the Global Warming Solutions Act (AB 32), the <strong>California</strong> Transportation <strong>Plan</strong>(2025), and the Department of Transportation’s Mission/Vision and StrategicGoals.ADMINISTRATION’S STRATEGIC GROWTH PLAN (SGP)<strong>California</strong>’s rapid population growth continues <strong>to</strong> put pressure on the<strong>State</strong>’s ageing infrastructure. To meet the challenges of this growth and itsramifications, the Administration has initiated the Strategic Growth <strong>Plan</strong> (SGP)that encompasses an infrastructure improvement program for the <strong>State</strong>’stransportation system, education, housing and waterways. A major sourceof funding in the SGP comes from the $19.9 billion of transportation projectscontained in the Highway Safety, Traffic Reduction, Air Quality and PortSecurity Bond Act (Proposition 1B) approved by the elec<strong>to</strong>rate in theNovember 2006 election. A $400 million segment of Proposition 1B isspecifically designated for intercity passenger rail.WARMING SOLUTIONS ACT (AB 32)The SGP is also closely aligned with the Administration’s “Global WarmingSolutions Act” (AB 32, Chapter 488, 2006). This landmark bill requires the <strong>State</strong>’sgreenhouse gas emissions <strong>to</strong> be reduced <strong>to</strong> 1990 levels by 2020.The Department’s strategy <strong>to</strong> reduce global warming emissions has twoelements. The first is <strong>to</strong> make transportation systems more efficient throughoperational improvements. The second focuses on the integration ofemission reduction measures in<strong>to</strong> the planning, development, operations andmaintenance of transportation elements.2 Executive Summary <strong>California</strong> <strong>State</strong> <strong>Rail</strong> <strong>Plan</strong> <strong>2007</strong>-<strong>08</strong> <strong>to</strong> <strong>2017</strong>-<strong>18</strong>
CALIFORNIA TRANSPORTATION PLAN 2025As a complement <strong>to</strong> the SGP, the Department produced the “<strong>California</strong>Transportation <strong>Plan</strong> 2025” (CTP) which offers a blueprint for meeting the<strong>State</strong>’s future mobility needs. The CTP includes goals <strong>to</strong> improve mobility andaccessibility, support the economy, enhance public safety and security, andimprove the environment.DEPARTMENT’S MISSION/VISION – STRATEGIC GOALSThe Department’s Mission/Vision “Caltrans improves mobility across <strong>California</strong>”and its five Strategic Goals: safety, mobility, delivery, stewardship, and servicesupport the SGP, AB 32, and the CTP.INTERCITY PASSENGER RAIL VISIONThe Department’s Intercity Passenger <strong>Rail</strong> Vision includes the followingelements:• Provide a rail transportation alternative <strong>to</strong> other travel modes• Provide relief <strong>to</strong> highway and air transportation congestion• Improve air quality, conserve fuel, and contribute <strong>to</strong> efficient andenvironmentally superior land useIntercity rail is an important component of the transportation system and itsexpansion furthers the Department's mission and goals, and supports theAdministration's transportation, environmental, and land use goals.Chapter II–Capital ProgramCAPITAL PROGRAM GOALS• Expand capacity on existing routes for increased frequencies, reliability, andon-time performance.• Reduce train running times.• Improve equipment, stations, facilities and multi-modal connectivity.• Increase farebox ratio <strong>to</strong> reach or exceed 50 percent.• Improve the safety of intercity rail service, including grade crossings.• Implement projects <strong>to</strong> allow new cost-effective routes.TEN-YEAR INTERCITY RAIL CAPITAL PROGRAMThe Department’s ten-year $4.03 billion capital program for the three existingstate-supported routes and for new routes represents an unconstrainedprogram based on project needs, and not funding expectations. Fullimplementation of this capital program would require major federal funding.All projects in the program, including costs, are listed in the chapter.The Department’s constrained $700 million ten-year capital programrepresents <strong>State</strong> funds reasonably expected <strong>to</strong> be available over the next tenyears. The program includes $25 million per year in STIP funds, $50 million inTransportation Congestion Relief Program (TCRP) funds and $400 million inProposition 1B funds.Executive Summary <strong>California</strong> <strong>State</strong> <strong>Rail</strong> <strong>Plan</strong> <strong>2007</strong>-<strong>08</strong> <strong>to</strong> <strong>2017</strong>-<strong>18</strong> 3
CAPITAL PROGRAM FUNDINGThrough 2005, over $2.8 billion has either been invested or reserved for capitalfunding for <strong>California</strong> intercity rail passenger service. The <strong>State</strong> has providedabout 62 percent of the <strong>to</strong>tal. Local entities, the Federal government, Amtrak,and the private railroads have also made major contributions.However, adequate <strong>State</strong> funding is not projected <strong>to</strong> be available <strong>to</strong> fund theunconstrained capital program. The only ongoing capital funding source is alimited portion of the STIP. This is a major concern and the Department willcontinue <strong>to</strong> explore mechanisms for stable funding. Article XIX of the <strong>State</strong>Constitution excludes rail equipment from <strong>State</strong> Highway Account (SHA)funding in the STIP.INTERCITY RAIL ROLLING STOCK PROGRAMThe <strong>State</strong> has an intercity rail rolling s<strong>to</strong>ck program unparalleled by any otherstate in the nation. The <strong>State</strong> owns its own fleet of 88 cars and 17 locomotivesand has spent over $300 million on equipment since the early 1990s withthe majority of funding from bonds. In addition <strong>to</strong> equipment procurement,the Equipment Program also includes warranty, rework, and modification ofprocured equipment; scheduled maintenance; heavy equipment overhaul;equipment modernization; inspection and safety moni<strong>to</strong>ring; and rehabilitationof damaged equipment. The <strong>2007</strong>-<strong>08</strong> Budget Act provides $250 million inProposition 1B funds for rail car acquisition.RAIL-HIGHWAY GRADE CROSSINGIMPROVEMENT AND SEPARATION PROGRAMSThe Department has a number of programs <strong>to</strong> improve safety at rail-highwaygrade crossings as well as improve rail and road operations. The newProposition 1B Highway-<strong>Rail</strong>road Crossing Program includes $250 million forimproving grade crossings and constructing grade separations. The <strong>2007</strong>-<strong>08</strong>Budget Act includes $122.5 million for this program. The Federal Section 130Program focuses on improving safety and operations at grade crossings.The <strong>State</strong> Section 190 Program focuses on constructing grade separations.These programs combined receive, in general, approximately $35 million a yearin funds.Chapter III–Operations ProgramOPERATIONS PROGRAM GOALS• Provide cost-effective, operationally efficient service that meets or exceedsthe Department’s 50 percent farebox ratio standard.• Improve service access and attractiveness by making the service morepassenger friendly with amenities such as on-line ticket reservations andpayment, improved real-time passenger information and notification, andon-board internet access.• Provide safe, reliable, and convenient intercity rail and connecting Amtrakbus service with frequent service during business hours, and travel options4 Executive Summary <strong>California</strong> <strong>State</strong> <strong>Rail</strong> <strong>Plan</strong> <strong>2007</strong>-<strong>08</strong> <strong>to</strong> <strong>2017</strong>-<strong>18</strong>
during evenings and weekends.• Create “seamless” multimodal connectivity between intercity rail servicesand local rail, transit, and airports, with convenient connections <strong>to</strong> all majorurban, and many <strong>to</strong>urist and rural destinations.TEN-YEAR INTERCITY RAIL SERVICE LEVELSAND FINANCIAL PLANThis chapter presents the Department’s 10-year proposed intercity passengerrail ridership and service levels; projected revenue, expense, and farebox ratiofor existing routes; and projected state costs for existing and new routes.The increased service levels, service extensions, and new services are consistentwith the operations goals.Also, the Department’s progress in meeting principal route objectives isassessed. Actual results and future objectives in the prior <strong>California</strong> <strong>State</strong> <strong>Rail</strong><strong>Plan</strong> are compared with those in the current <strong>State</strong> <strong>Rail</strong> <strong>Plan</strong>.OPERATIONS PROGRAMThe Department’s operations, marketing and capital programs are allinterrelated. The operations program focuses on: operational efficiency,passenger amenities, emerging technologies, connecting Amtrak busservices, and multimodal connectivity. Operational efficiency which is heavilydependant on implementation of capital improvements includes the goal of90 percent on-time performance on all three routes. Emerging technologiesis a new program focus and includes implementation of on-board wirelessinternet service, au<strong>to</strong>mated ticket validation and on-line ticketing, and acomprehensive wireless network with many operational applications.All three routes have connecting Amtrak buses service, with the San Joaquins’extensive bus network being integral <strong>to</strong> the Route. Multimodal connectivity <strong>to</strong>each route is continually being refined, including ticket transfer programs andschedule and station s<strong>to</strong>p coordination.Chapter IV – Marketing ProgramMARKETING PROGRAM GOALS• Increase ridership by promoting new and expanded train and feeder busservices.• Develop strategic partnerships with entities such as Air Quality Districts,transit agencies, and the private sec<strong>to</strong>r <strong>to</strong> leverage scarce media funds.• Develop new ways <strong>to</strong> reach our target audience more cost effectively withan emphasis on the emerging online technology.• Develop ridership in primary target markets including the Hispanic,the “mature” (travelers over 50 years old), and family markets. Secondarymarkets include business travelers, solo travelers, and college students.• Promote recent improvements <strong>to</strong> the rail corridors including the opening ofnew and renovated stations and other capital programs.Executive Summary <strong>California</strong> <strong>State</strong> <strong>Rail</strong> <strong>Plan</strong> <strong>2007</strong>-<strong>08</strong> <strong>to</strong> <strong>2017</strong>-<strong>18</strong> 5
SurfSan FranciscoSanta CruzPaso RoblesGrover BeachGuadalupeSalinasAtascaderoCal PolySan Luis ObispoLompocSanta MariaBuell<strong>to</strong>nSolvangKing CityOaklandSan JosePacificSurflinerCorridorGoletaSanta BarbaraCarpinteriaVenturaOxnardCamarilloMoorparkSimi Valley NewhallChatsworthVan Nuys BurbankAirportGlendaleLos AngelesSan PedroLong BeachAnaheimIrvineSan Juan CapistranoOceansideSolana BeachBakersfieldFuller<strong>to</strong>nSanta AnaSan ClemenMARKETING PROGRAMThe purpose of the marketing program is <strong>to</strong> create awareness of Amtrak<strong>California</strong> train travel as an option in consumer’s minds. Market research showsthat most <strong>California</strong> travelers do not consider taking the train when makingtravel decisions. Creating this awareness is essential for increasing demand andthus, ridership and revenue.The Marketing Program has a number of components. Advertising is a jointprogram with Amtrak and focuses on the “Travel Made Simple” concept.Public Relations/Outreach includes special promotions, media relations, printedmaterials, and special events. Group Travel includes programs for children,seniors, and college students. The Department coordinates its <strong>Rail</strong> Safetyactivities with <strong>California</strong> Operation Lifesaver, and contracts for market research.The Capi<strong>to</strong>l Corridor Joint Powers Authority (CCJPA) has its own marketingprogram, which includes a combination of local marketing efforts and broadbasedmedia campaigns. The CCJPA coordinates its marketing efforts with the<strong>State</strong>, Amtrak, and CCJPA member agencies.Chapter V–The <strong>California</strong> Passenger <strong>Rail</strong> NetworkTHE STATE’S ROLE IN RAIL PASSENGER SERVICEThe <strong>State</strong> rail system combines intercity, commuter, and freight rail. Intercityrail includes <strong>State</strong>-supported corridor routes and Amtrak long-distance routes.All three systems share the same infrastructure that is generally owned byprivate railroads, and in some cases, public entities. The <strong>State</strong> <strong>Rail</strong> <strong>Plan</strong> focuseson these rail systems because they share the same infrastructure. The <strong>State</strong>supports: the Pacific Surfliners between San Diego and San Luis Obispo,the San Joaquins between Bay Area/Sacramen<strong>to</strong> and Bakersfield, andthe Capi<strong>to</strong>l Corridor between San Jose and Auburn. Services intended <strong>to</strong> meetprimarily local needs are developed as commuter and urban rail services ratherthan intercity. In <strong>California</strong>, Amtrak currently operates all state-supportedintercity rail services under provisions of the Federal <strong>Rail</strong> Passenger Service Act(49 U.S.C. 24101).Chapter VI–Pacific Surfliner RouteSAN LUIS OBISPO-SANTA BARBARA-LOS ANGELES-SAN DIEGOPRINCIPAL <strong>2007</strong>-<strong>08</strong> TO <strong>2017</strong>-<strong>18</strong> ROUTE OBJECTIVESImprove On-Time Performance (OTP) <strong>to</strong> 90 percent by <strong>2017</strong>-<strong>18</strong>.Streamline operations and improve passenger amenities:• Study Premium Class Service.• Implement passenger on-board wireless internet service.• Implement au<strong>to</strong>mated ticket validation and internet ticket purchase.• In the long-term implement comprehensive wireless network for improvedon-board and equipment operations, safety and equipment repair.Improve multimodal connectivity:• Cross-ticketing and coordinated schedules with Metrolink and Coaster.• Improved coordination with urban transit.San Diego6 Executive Summary <strong>California</strong> <strong>State</strong> <strong>Rail</strong> <strong>Plan</strong> <strong>2007</strong>-<strong>08</strong> <strong>to</strong> <strong>2017</strong>-<strong>18</strong>
ArcataFortunaScotia• Improved Amtrak Thruway service.Reduce Travel Times:• San Diego <strong>to</strong> Los Angeles in under 2 hours-30 minutes.• Los Angeles <strong>to</strong> San Luis Obispo in under 5 hours.• Implement express service between Los Angeles and San Diego.Increase annual ridership 50 percent from 2,707,000 <strong>to</strong> 4,061,000.Increase annual revenues 94 percent from $34.5 million <strong>to</strong> $67.0 million forthe state-supported portion of the Route.Increase revenue/cost (farebox) ratio from 67.1 percent <strong>to</strong> 68.2 percent.Increase Service Frequency:• From 11 <strong>to</strong> 13 daily round-trips between San Diego – Los Angeles.• From 5 <strong>to</strong> 6 daily round-trips between Los Angeles – Santa Barbara.• From 2 <strong>to</strong> 3 daily round-trips between Santa Barbara – San Luis Obispo.Expand Service:• San Francisco – San Luis Obispo – first daily round-trip in 2010-11, seconddaily round-trip in 2013-14.Chapter VII–San Joaquin RouteBAY AREA/SACRAMENTO-FRESNO-BAKERSFIELD-(L.A.)PRINCIPAL <strong>2007</strong>-<strong>08</strong> TO <strong>2017</strong>-<strong>18</strong> ROUTE OBJECTIVESImprove On-Time Performance <strong>to</strong> 90 % by <strong>2017</strong>-<strong>18</strong>.Streamline operations and improve passenger amenities:• Study Premium Class Service.• Implement passenger on-board wireless internet service.• Implement au<strong>to</strong>mated ticket validation and internet ticket purchase.• Implement Electronic Train Management System.• In the long-term implement comprehensive wireless network for improvedon-board and equipment operations, safety and equipment repair.Improve multimodal connectivity:• Improved coordination with Altamont Commuter Express (ACE),Capi<strong>to</strong>l Corridor, and local transit systems.• Improved Amtrak Thruway bus service.Reduce Travel Times:• Oakland <strong>to</strong> Bakersfield in under six hours.• Sacramen<strong>to</strong> <strong>to</strong> Bakersfield in under five hours.Increase annual ridership 78 percent from 805,000 <strong>to</strong> 1,432,000.Increase annual revenues 124 percent from $ 26.5 million <strong>to</strong> $ 59.4 million.Increase revenue/cost (farebox) ratio from 46.3 percent <strong>to</strong> 52.3 percent.Increase Service Frequency:• Two new roundtrips from S<strong>to</strong>ck<strong>to</strong>n <strong>to</strong> Oakland.• Seventh Bakersfield – S<strong>to</strong>ck<strong>to</strong>n round trip, with a third daily round-trip fromS<strong>to</strong>ck<strong>to</strong>n <strong>to</strong> Sacramen<strong>to</strong>.• Eighth Bakersfield – S<strong>to</strong>ck<strong>to</strong>n round trip, with a fifth daily round-trip fromS<strong>to</strong>ck<strong>to</strong>n <strong>to</strong> Oakland.Other Service Expansions:• Pursue options <strong>to</strong> originate some trains in Fresno.• Study options <strong>to</strong> extend rail service from Bakersfield <strong>to</strong> Los Angeles.PetalumaMarysvilleNapaFair-Field VacavilleDavisVallejoRichmond-BARTSuisunRoseville AuburnSan FranciscoSacramen<strong>to</strong>MartinezRocklinOakland EmeryvilleSan Luis ObispoGrover BeachPaso RoblesSanta BarbaraVenturaOxnardSanta PaulaFillmoreSimi ValleyChatsworthVan NuysBurbankMercedHanfordCorcoranWascoS<strong>to</strong>ck<strong>to</strong>n-ACES<strong>to</strong>ck<strong>to</strong>nModes<strong>to</strong>Turlock-DenairMaderaLancasterPalmdaleLaCrescentaSan Juan CapistranoSan ClementeOceansideOntarioSanBernardinoSolana BeachExecutive Summary <strong>California</strong> <strong>State</strong> <strong>Rail</strong> <strong>Plan</strong> <strong>2007</strong>-<strong>08</strong> <strong>to</strong> <strong>2017</strong>-<strong>18</strong> San Diego 7MontereyCloverdaleHealdsburgSanta RosaRohnert ParkAntiochDublin-BARTMission S.J.Livermore-ACEGreat America TracySan JoseSanta CruzAtascaderoSanta MariaWatsonvilleSalinasLegettKettlemanCityGarbervilleLay<strong>to</strong>nvilleWillitsUkiahHollisterSan JuanBautistaSanJoaquinCorridorCarpinteriaGlendaleLos AngelesSan PedroLong BeachLosBanosLemooreNewhallPasadenaLodiFuller<strong>to</strong>nAnaheimSanta AnaIrvineFresnoCorningBakersfieldClaremontSun CityRed BluffChicoOrovilleMariposaTehachapiLittlerockReddingGoshen Jct.VisaliaMojaveRosamondRiversidePerrisAdelan<strong>to</strong> Jct.Moreno ValleyHemetGrass VColfaxMDunPlacervillMidpinesElBeaumontBorVic<strong>to</strong>rvillePal1 P
HealdsburgSanta RosaRohnert ParkPetalumaNapaOrovilleMarysvilleDavisVallejo SuisunRichmond-BARTBerkeleySacramen<strong>to</strong>San FranciscoMartinezEmeryvilleOaklandSanta CruzHaywardFremontGreat AmericaSan JoseRosevilleAuburnRocklinCapi<strong>to</strong>lCorridorGrass ValleyColfaxPlacervilleSoda SpringsTruckeeTahoeWye<strong>State</strong>line, NVRenoSpGilroySalinasKing CityPaso RoblesCalPolySan Luis ObispoGrover BeachSanta MariaSolvangSanta BarbaraChapter VIII–Capi<strong>to</strong>l CorridorAUBURN-SACRAMENTO-OAKLAND-SAN JOSEPRINCIPAL <strong>2007</strong>-<strong>08</strong> TO <strong>2017</strong>-<strong>18</strong> ROUTE OBJECTIVESMaintain on-time performance at 90% throughout the ten-year period.Enhance cus<strong>to</strong>mer satisfaction:• Release RFP in 20<strong>08</strong> <strong>to</strong> implement comprehensive wireless network forcus<strong>to</strong>mer internet access and operating applications. Implement system asfeasible.• Implement Au<strong>to</strong>matic Ticket Validation System.• Implement on-board safety and security cameras.• Implement Cus<strong>to</strong>mer Relationship Management ticketing database system,as feasible.Improve multimodal connectivity; establish transfer agreements andcoordinated schedules with all local transit systems.Reduce Travel Times by up <strong>to</strong> 12 percent.Increase annual ridership 90 percent from 1,450,000 <strong>to</strong> 2,759,000.Increase annual revenues 154 percent from $<strong>18</strong>.1 million <strong>to</strong> $46.0 million.Increase revenue/cost (farebox) ratio from 40.0 percent <strong>to</strong> 46.1 percent.Increase Service Frequency:• From 16 <strong>to</strong> <strong>18</strong> daily round-trips between Oakland and Sacramen<strong>to</strong>.• From 7 <strong>to</strong> 16 daily round-trips between San Jose and Oakland.• From 1 <strong>to</strong> 10 daily round-trips between Sacramen<strong>to</strong> and Roseville.• From 1 <strong>to</strong> 4 daily round-trips between Roseville and Auburn.Expand Service:• Sacramen<strong>to</strong>-Reno – first daily round-trip in 2014-15, second daily round-tripin 2016-17.• Support Auburn-Oakland Regional <strong>Rail</strong> Service commuter system planning.• Coordinate with Caltrain on the Dumbar<strong>to</strong>n <strong>Rail</strong> Corridor commuter railexpansion.8 Executive Summary <strong>California</strong> <strong>State</strong> <strong>Rail</strong> <strong>Plan</strong> <strong>2007</strong>-<strong>08</strong> <strong>to</strong> <strong>2017</strong>-<strong>18</strong>
Southern<strong>California</strong>Commuter<strong>Rail</strong>Chapter IX–Commuter <strong>Rail</strong> ServicesCOASTER COMMUTER RAIL (SAN DIEGO–OCEANSIDE)PRINCIPAL <strong>2007</strong>-<strong>08</strong> TO <strong>2017</strong>-<strong>18</strong> ROUTE OBJECTIVES:• Increase ridership and improve mobility in the region.• Implement and improve timed transfers at various stations and transitcenters.• Initiate and continue implementation of the Cus<strong>to</strong>mer Amenities Program.• Implement incremental service increases, if feasible, including:supplementary mid-day service, reverse peak service, evening service,special events service and weekend service.Executive Summary <strong>California</strong> <strong>State</strong> <strong>Rail</strong> <strong>Plan</strong> <strong>2007</strong>-<strong>08</strong> <strong>to</strong> <strong>2017</strong>-<strong>18</strong> 9
CAPITAL IMPROVEMENT OBJECTIVES – FUNDED:• Construct Oceanside passing track.• Replace single-track Santa Margarita River bridge with new two-trackconcrete bridge and connect with double track siding.• Extend platform at Sorren<strong>to</strong> Valley Station.• Build 500-space parking structure at Solana Beach Station for mixed-usedevelopment.UNFUNDED OR UNDERFUNDED:• Replace single-track San Diegui<strong>to</strong> River bridge with new two-track concretebridge.• Replace single-track San Luis Rey River bridge with new two-track concretebridge and connect <strong>to</strong> with double track siding.• Replace single-track San Mateo Creek bridge’s north approach with newconcrete bridge approach.• Replace other single-track timber bridges with new double-track concretebridges, including seven bridges in Sorren<strong>to</strong> Valley and one bridge inCardiff.• Sorren<strong>to</strong> <strong>to</strong> Miramar second track and curve straightening.• Continue stabilization of Del Mar Bluffs.• Extend platforms at Poinsettia Station.METROLINK COMMUTER RAIL (LOS ANGELES,ORANGE, RIVERSIDE, SAN BERNARDINO, ANDVENTURA COUNTIES)PRINCIPAL <strong>2007</strong>-<strong>08</strong> <strong>to</strong> <strong>2017</strong>-<strong>18</strong> ROUTE OBJECTIVES• Improve cus<strong>to</strong>mer service and accessibility.• Improve integration with other transit services.• Purchase 107 new rail cars.• Design and construct Sealed Corridor safety improvements on SCRRAownedlines.• Complete system-wide rail line rehabilitation/renovation projects.• Construct Eastern Area maintenance facility.• Perform various projects <strong>to</strong> improve system performance.• Purchase and rebuild 15 used locomotives.• Complete Lincoln Avenue double-track.• Construct additional platform and track at LAUS (mail dock).10 Executive Summary <strong>California</strong> <strong>State</strong> <strong>Rail</strong> <strong>Plan</strong> <strong>2007</strong>-<strong>08</strong> <strong>to</strong> <strong>2017</strong>-<strong>18</strong>
Northern<strong>California</strong>Commuter<strong>Rail</strong>• Construct new rolling s<strong>to</strong>ck s<strong>to</strong>rage facility at Keller Street in Los Angeles.• Implement Perris Valley extension, Redlands extension, Santa Paula BranchLine, and Fuller<strong>to</strong>n-Laguna Niguel/Mission Viejo service enhancements.CALTRAIN COMMUTER RAIL (SAN FRANCISCO–GILROY)PRINCIPAL <strong>2007</strong>-<strong>08</strong> <strong>to</strong> <strong>2017</strong>-<strong>18</strong> OBJECTIVES• Evaluate the service <strong>to</strong> meet growing demand.• Evaluate an increase in parking at stations impacted by initiation ofBaby Bullet service.• Increase employer bus shuttles as demand grows.• Implement Translink regional ticketing system.• Participate in planning efforts for extensions <strong>to</strong> down<strong>to</strong>wn San Francisco,across the Dumbar<strong>to</strong>n Bridge, and <strong>to</strong> Salinas.• Complete and commission Centralized Equipment Maintenance andOperations Facility.• Improve operational capacity at targeted stations and other route locations,including outside boarding platforms and additional crossovers.• Complete cus<strong>to</strong>mer service improvements, including improved stationaccess and amenities at selected stations.Executive Summary <strong>California</strong> <strong>State</strong> <strong>Rail</strong> <strong>Plan</strong> <strong>2007</strong>-<strong>08</strong> <strong>to</strong> <strong>2017</strong>-<strong>18</strong> 11
• Improve ROW by designing grade separations in San Mateo County, andrehabilitate bridges, culverts, tracks, and tunnels.• Prepare design plans, specifications, and estimates <strong>to</strong> electrify the routebetween San Francisco and Gilroy.• Implement Dumbar<strong>to</strong>n rail service extension.• Procure eight bi-level passenger cars.• Define long-term planning and capital improvement efforts related <strong>to</strong>Caltrain 2025.ALTAMONT COMMUTER EXPRESS(STOCKTON–SAN JOSE)PRINCIPAL <strong>2007</strong>-<strong>08</strong> <strong>to</strong> <strong>2017</strong>-<strong>18</strong> ROUTE OBJECTIVES• Continue service improvements.• Improve on-time performance.• Increase ridership on existing routes.• Pursue the Purchase of an Agency owned rail corridor for the ACE Service.• Improve service coordination with other service providers such as BART,Caltrain, Capital Corridor, and shuttle service providers.• Acquire ROW, perform engineering work, and begin construction of railmaintenance and layover facility in San Joaquin County.• Purchase passenger rail cars and locomotive for fifth and sixth trains.• Upgrade signal system between S<strong>to</strong>ck<strong>to</strong>n and Fremont.• Upgrade passenger cars and locomotives.• Evaluate potential extensions and new services in the Central Valley.PROPOSED COMMUTER RAIL SERVICESVENTURA AND SANTA BARBARA COMMUTER RAIL SERVICEThere is interest in expanding commuter rail service in Ventura andSanta Barbara Counties. Southern <strong>California</strong> Association of Governments hasinitiated an alternatives study.SONOMA MARIN-AREA RAIL TRANSIT (SMART)Current implementation plans include service start up in 2009-10 along a70-mile corridor with service from Cloverdale <strong>to</strong> the existing Larkspur ferryterminal.12 Executive Summary <strong>California</strong> <strong>State</strong> <strong>Rail</strong> <strong>Plan</strong> <strong>2007</strong>-<strong>08</strong> <strong>to</strong> <strong>2017</strong>-<strong>18</strong>
AUBURN-OAKLAND REGIONAL RAIL SERVICESix agencies have partnered <strong>to</strong> develop a service concept plan for a newregional commuter rail service in the urban corridor extending from Auburn <strong>to</strong>Oakland that would be integrated with the Capi<strong>to</strong>l Corridor.Chapter X–Potential New ServicesPROPOSED INTERCITY RAIL ROUTESThe Department proposes three routes for service in this ten-year plan.• San Francisco <strong>to</strong> San Luis Obispo (and Los Angeles) via Coast Route.One round-trip train between San Francisco and San Luis Obispo, starting in2010-11, with a second train in 2013-14.• Sacramen<strong>to</strong> <strong>to</strong> Reno. One Capi<strong>to</strong>l Corridor round-trip from Sacramen<strong>to</strong> <strong>to</strong>Reno/Sparks in 2014-15, and a second round-trip in 2016-17.• Sacramen<strong>to</strong> <strong>to</strong> Redding. One round-trip between Sacramen<strong>to</strong> andRedding in 2015-16.This section also discusses potential intercity rail service from Los Angeles <strong>to</strong>Indio (Coachella Valley), San Francisco <strong>to</strong> Monterey, and Los Angeles <strong>to</strong>Las Vegas.HIGH-SPEED RAIL<strong>California</strong> High-Speed <strong>Rail</strong> AuthorityIn 1996, the <strong>California</strong> High-Speed <strong>Rail</strong> Act established the <strong>California</strong> High-Speed <strong>Rail</strong> Authority (CHSRA) <strong>to</strong> direct the development and implementationof intercity high-speed rail service. In 2000, the CHSRA completed its Business<strong>Plan</strong>, “Building a High-Speed Train System for <strong>California</strong>”. The CHSRA certifiedthe Final Environmental Impact Report/Environmental Impact Study (FEIR/EIS)on November 2, 2005. The FEIR/EIS identifies a high-speed train system as thepreferred system alternative <strong>to</strong> meet <strong>California</strong>’s future intercity travel demand.Service <strong>to</strong> urban centers would be on shared tracks with other passenger railservices at moderate speeds. Stations would be in close proximity <strong>to</strong> mostmajor airports, and there would be station connections with major transit hubsin metropolitan areas. The FEIR/EIS identifies preferred alignments.The 2006-07 enacted <strong>State</strong> budget provided $14.3 million "<strong>to</strong> begin projectimplementation". The funding supported the preparation of a projectfinancial plan, project management activities, identification of critical rightsof-wayacquisitions and the initiation of detailed project design and relatedenvironmental studies. However, bond funding for the project must still beauthorized by voters.DesertXpressDesertXpress is a proposed completely new high-speed, steel wheel onrail double track interstate passenger rail line running 190 miles betweenVic<strong>to</strong>rville, <strong>California</strong> and Las Vegas, Nevada. It would run primarily at-grade;but be completely grade separated from all streets and highways, and wouldlargely follow the I-15 freeway alignment. The estimated capital cost isExecutive Summary <strong>California</strong> <strong>State</strong> <strong>Rail</strong> <strong>Plan</strong> <strong>2007</strong>-<strong>08</strong> <strong>to</strong> <strong>2017</strong>-<strong>18</strong> 13
$3.5 billion in private funding for design, construction, rolling s<strong>to</strong>ck, systems,testing and commissioning, with construction taking up <strong>to</strong> four years followingcompletion of the environmental review process. Revenues from fares andadvertising are expected <strong>to</strong> cover the on-going operating costs, includingmaintenance.The proposed service will make the trip nons<strong>to</strong>p at speeds of up <strong>to</strong> 125 milesper hour, for a one hour and 40 minute trip between Vic<strong>to</strong>rville and Las Vegas.Equipment would be proven European design steel wheel on rail trains, witheach car self-propelled <strong>to</strong> provide the high power-<strong>to</strong>-weight ratio needed <strong>to</strong>follow the I-15 alignment and climb its relatively steep grades through twodesert mountain passes. Trains would operate as frequently as 20 <strong>to</strong> 30 minutesduring peak periods, and one <strong>to</strong> two hour intervals at other times. Ridershipis projected at 5.1 million passenger round-trips in the first year, based on anaverage $50 one-way fare. This ridership level represents 28 percent of theprojected <strong>18</strong>.2 million trips between Southern <strong>California</strong> and Las Vegas. Muchof the route would use property along the I-15 alignment that is owned by thefederal Government and administered by the Bureau of Land Management(BLM). Between Vic<strong>to</strong>rville and Bars<strong>to</strong>w, a passenger-exclusive alignment withinexisting railroad rights of way is also being evaluated.MAGNETIC LEVITATIONSouthern <strong>California</strong> Maglev ProjectThe Southern <strong>California</strong> Maglev Project’s initial operating segment that is underdevelopment extends 54 miles from West Los Angeles <strong>to</strong> the Ontario Airport.The Southern <strong>California</strong> Association of Governments (SCAG) is the projectsponsor. Additional feasibility studies are focusing on other heavily congestedcorridors in the SCAG region.Los Vegas – Anaheim Maglev ProjectThe <strong>California</strong> – Nevada Super Speed Train Commission was formed in 1988 <strong>to</strong>promote the development of a 269-mile maglev system connecting Las Vegaswith Anaheim, and has completed several feasibility studies on this project.With Federal funding, Nevada is undertaking environmental studies of thisproposed maglev route.Chapter XI–AmtrakAMTRAK STATE–SUPPORTED SERVICEThe Federal <strong>Rail</strong> Passenger Service Act authorizes Amtrak <strong>to</strong> operate intercityrail passenger service beyond its long-distance system services when requested<strong>to</strong> do so by a state, group of states, or a regional or local agency. In <strong>California</strong>,Amtrak operates the Pacific Surfliners, San Joaquins, and the Capi<strong>to</strong>l Corridorand the Department provides operating funding. The Department directlyadministers the Pacific Surfliners and San Joaquins. Since July 1998, the CCJPAhas administered the Capi<strong>to</strong>l Corridor service under an interagency transferagreement with the <strong>State</strong>.14Executive Summary <strong>California</strong> <strong>State</strong> <strong>Rail</strong> <strong>Plan</strong> <strong>2007</strong>-<strong>08</strong> <strong>to</strong> <strong>2017</strong>-<strong>18</strong>
AMTRAK PLANNINGIn April 2005, Amtrak released its Amtrak Strategic Reform Initiatives and FY 06Grant Request. This document included comprehensive reform initiatives therailroad is undertaking as corporate actions and others it intends <strong>to</strong> pursue inlegislative actions <strong>to</strong> “revitalize U.S. Passenger rail service.” Legislative initiativesincluded an 80 percent Federal/20 percent state capital grant program andcompetition among opera<strong>to</strong>rs, including Amtrak, for route operation.Amtrak’s 2004 Strategic Business <strong>Plan</strong> released in June 2004 includes$90.1 million for projects which impact <strong>California</strong>. Of these funds, $41.5 millionis for projects wholly in <strong>California</strong> and $48.6 million is for multi-state projectsthat partially impact <strong>California</strong>.AMTRAK FFYS <strong>2007</strong> AND 20<strong>08</strong> FUNDINGAmtrak’s final FFY 07 appropriation was $1.294 billion with no appropriation forStrategic Investment Options. In early <strong>2007</strong> the Passenger <strong>Rail</strong> Investment andImprovement Act of <strong>2007</strong> was introduced in<strong>to</strong> the Senate. It provides a six-yearfunding framework for Amtrak’s operating and capital needs but at this pointno companion legislation has been introduced in the House nor any fundingmechanism identified for the proposed capital grant program. To date, aFFY <strong>08</strong> Amtrak funding level has not been approved.Chapter XII–Intercity <strong>Rail</strong> FundingFUNDING SOURCESPublic Transportation Account (PTA). The PTA is the exclusive source ofintercity rail operating funds and a potential source of intercity rail capital funds.The TCRP, enacted in 2000, and Proposition 42, passed in 2002, added additionalfunds <strong>to</strong> the PTA. In 2005-06 <strong>to</strong>tal PTA revenue from all sources was $571 million.<strong>State</strong> Highway Account (SHA). The bulk of the SHA supports the <strong>State</strong>’shighway system, but a portion of the account also supports rail projects in theSTIP. In the 1996 STIP through the 2006 STIP biennial cycles, $567 million wasprogrammed for intercity rail projects and $402 million has been allocated.Traffic Congestion Relief Fund (TCRF). The program established in 2000included $206.5 million for specific intercity rail capital projects, of which$150 million has been allocated.<strong>State</strong> Bond Funds. Proposition 1B, the Highway Safety, Traffic Reduction,Air Quality and Port Security Bond Act was approved in 2006 and authorizes theissuance of $19.9 billion for specific transportation purposes. It makes$400 million available specifically for intercity rail improvements, of which$125 million is reserved for intercity rail equipment. The Act also includes$250 million for high priority grade separation and railroad crossing safetyimprovements. The <strong>2007</strong>-<strong>08</strong> Budget Act appropriates <strong>to</strong> the Department$<strong>18</strong>7 million for intercity rail improvements and $122.5 million for gradeseparation and crossing projects.In 1990 voters approved two bond measures that provided funds for railprojects. The Passenger <strong>Rail</strong> and Clean Air Bond Act (Proposition 1<strong>08</strong>) providedExecutive Summary <strong>California</strong> <strong>State</strong> <strong>Rail</strong> <strong>Plan</strong> <strong>2007</strong>-<strong>08</strong> <strong>to</strong> <strong>2017</strong>-<strong>18</strong>15
$1 billion in rail bonds, including $225 million for intercity rail capital projects.The Clean Air and Transportation Improvement Act of 1990 (Proposition 116)provided $1.99 billion for rail and transit projects, including about $382 millionfor intercity rail capital projects. Most of the bond funds from both Propositions1<strong>08</strong> and 116 have been expended.Tribal Compact Bonds. In 2004, the issuance of bonds secured by Indiangaming revenue was authorized. Although the revenue is uncertain, the PTAcould receive additional funding.<strong>State</strong> General Funds. The 1999-00 and 2000-01 <strong>State</strong> Budgets providedGeneral Fund money for intercity rail capital projects. These Budgets included$17.5 and $30 million respectively for new intercity rail rolling s<strong>to</strong>ck.Local Funds. Although intercity rail passenger services are funded primarily bythe <strong>State</strong>, a substantial amount of local funds have also been invested, mainlyon the Pacific Surfliner Route, <strong>to</strong> fund commuter rail development. Further,intercity rail stations are often owned by cities and funded with local funds inaddition <strong>to</strong> STIP funding.Federal Funds. Federal transportation funds from various programs benefitintercity rail service, particularly through station projects. However, Federalflexible transportation funds, like those provided through the SurfaceTransportation Program, are generally not available for intercity rail projects.Amtrak Funds. Amtrak develops and funds certain <strong>California</strong> intercity railcapital projects. The largest investment has been for maintenance facilities androlling s<strong>to</strong>ck, including the purchase of 40 new passenger cars and14 locomotives for the Pacific Surfliner Route at a cost of about $135 million.<strong>Rail</strong>road Funds. The <strong>State</strong> and the railroads owning the right-of-way ofintercity rail passenger routes sometimes share in the cost of track and signalimprovement projects.PART IIFreight <strong>Rail</strong> ElementChapter XIII–IntroductionThe freight rail element discusses policy statements/recommendations,illustrates the key features of the freight rail system, and issues facingthis system. It also focuses on potential methods for the maintenance,preservation, and enhancement of the freight rail system in <strong>California</strong>.CHAPTER XIV–Policy <strong>State</strong>ment/RecommendationsThis chapter provides an overview of the importance of the freight railsystem <strong>to</strong> <strong>California</strong>, and Administration initiatives for state infrastructureimprovement. In addition, a number of policy statements/recommendationsare discussed. They are:• <strong>California</strong> Strategic Interest: In order <strong>to</strong> maintain the position andcontributions the freight rail system makes <strong>to</strong> <strong>California</strong> and the nation,16Executive Summary <strong>California</strong> <strong>State</strong> <strong>Rail</strong> <strong>Plan</strong> <strong>2007</strong>-<strong>08</strong> <strong>to</strong> <strong>2017</strong>-<strong>18</strong>
it is in the strategic interest of the <strong>State</strong> <strong>to</strong> maintain, preserve and improve<strong>California</strong>’s freight rail system.• System <strong>Plan</strong>ning: A long range, sustainable, system planning program <strong>to</strong>identify freight rail system needs and projects which increase mobility andenhance the environment should be undertaken.• <strong>Rail</strong> Preservation: To maintain the <strong>State</strong>’s economic health, at a minimumthe <strong>State</strong>’s rail network, and the system’s freight market share, must bepreserved <strong>to</strong> the maximum extent feasible.• Environment: <strong>California</strong> must expand and improve its freight rail systemand operations and simultaneously work <strong>to</strong> reduce associated health risksand community impacts. Local, state, and federal agencies must work<strong>to</strong>gether as partners with private citizens and business concerns <strong>to</strong> providea clean environment and a healthy business climate. These goals arefundamental <strong>to</strong> Governor Schwarzenegger’s Strategic Growth <strong>Plan</strong>.• Funding: In order <strong>to</strong> maintain and strengthen the position andcontributions the freight rail system makes <strong>to</strong> <strong>California</strong>, the regions and thenation, the <strong>State</strong> must be an active partner with the private sec<strong>to</strong>r and othergovernment entities in the funding of major freight rail improvements.• Partnerships: To foster the maintenance, preservation, and improvemen<strong>to</strong>f the <strong>State</strong> freight rail system, its planning and development must beundertaken as an ongoing partnership between the <strong>State</strong> and other levelsof government, and the freight railroads and private sec<strong>to</strong>r interests. Thispartnership should seek <strong>to</strong> maximize mutual benefit, including publicmobility, safety, and environmental objectives, and private sec<strong>to</strong>r businessopportunities and return on investment.Importance of the Freight <strong>Rail</strong> System <strong>to</strong> <strong>California</strong><strong>California</strong> has a rapidly growing population and an expanding economy.In addition it serves as the entryway for goods from Pacific Rim countries.In order <strong>to</strong> provide mobility for its citizens and efficient movement of goodsinvestments in the ageing infrastructure are extremely important. Particularlyimportant are the four major goods movement corridors: Los Angeles-LongBeach/Inland Empire; San Diego/Border; Bay Area; and Central Valley.The Strategic Growth <strong>Plan</strong>To address funding needs for an improved infrastructure the Governor’sStrategic Growth <strong>Plan</strong> (SGP) has been initiated. The SGP includes policies andactions which directly impact freight rail in the <strong>State</strong>. An important element ofthe SGP is the Goods Movement Action <strong>Plan</strong>, which is an initiative for economicgrowth, enhanced security and improved quality of life.CHAPTER XV–System OverviewThis chapter provides a short written description of the rail network in the stateand the economic significance of <strong>California</strong> ports in the Pacific Rim economies.It also illustrates, by map and tables, freight rail traffic and other economic data.Executive Summary <strong>California</strong> <strong>State</strong> <strong>Rail</strong> <strong>Plan</strong> <strong>2007</strong>-<strong>08</strong> <strong>to</strong> <strong>2017</strong>-<strong>18</strong> 17
CHAPTER XVI–Major Freight <strong>Rail</strong> IssuesThis chapter focuses on a variety of issues facing the freight rail industry <strong>to</strong>day.They include international trade growth and its impact on <strong>California</strong>, thechanging nature of commodity movements and a brief description of logisticspractices. Also discussed are freight rail-passenger rail issues and shareduse of right-of-way between railroads. Attention is also paid <strong>to</strong> short line railissues and problems they face in infrastructure and capital needs. The chapterincludes a discussion of short haul intermodal potential and the need forpublic/private sec<strong>to</strong>r coordination.CHAPTER XVII–Environmental ConsiderationsThe Governor’s SGP highlights environmental quality as an important elementin the state’s overall quality of life. This chapter discusses air quality particularlyas it relates <strong>to</strong> freight rail and goods movement. It provides an overview ofstate mandates for emission reduction, air quality, and emission characteristics.It also portrays air quality and emission regulation, emission reductionstrategies and environmental justice aspects of air quality. A second section ofthe chapter notes highway-grade crossing considerations.CHAPTER XVIII–FundingThis chapter contains a discussion of funding issues confronting the freightrail industry <strong>to</strong>day, and possible remedies <strong>to</strong> close the gap between needsand dollars. The issue of public investment in private infrastructure, alternativefunding schemes at the state and federal levels, and public/private partnershipsand local initiatives are also discussed. It offers a number of examples that havebeen used for partnerships and stresses that these examples could providesubstance for funding strategies in <strong>California</strong>.CHAPTER XIX–Freight <strong>Rail</strong> Research And StudiesThis chapter discusses investment models and illustrates investment modelsthat have been used in other states, particularly Washing<strong>to</strong>n and Florida. Thesemodels cover a number of economic impacts. The chapter also discussesthe U.S. Department of Transportation’s Guide <strong>to</strong> Quantifying the EconomicImpacts of Investments in Large-Scale Freight Transportation Projects.<strong>18</strong>Executive Summary <strong>California</strong> <strong>State</strong> <strong>Rail</strong> <strong>Plan</strong> <strong>2007</strong>-<strong>08</strong> <strong>to</strong> <strong>2017</strong>-<strong>18</strong>
INTRODUCTIONGovernment Code Section 14036 requires the <strong>California</strong> Department ofTransportation (the Department) <strong>to</strong> complete a ten-year <strong>State</strong> <strong>Rail</strong> <strong>Plan</strong> with bothpassenger rail and freight rail elements. The law also provides that the <strong>State</strong> <strong>Rail</strong><strong>Plan</strong> be submitted <strong>to</strong> the <strong>California</strong> Transportation Commission by Oc<strong>to</strong>ber ofodd-numbered years for its advice and consent, and <strong>to</strong> the Legislature, Governor,and the Public Utilities Commission by March 1, of the following year.Part I of the <strong>California</strong> <strong>State</strong> <strong>Rail</strong> <strong>Plan</strong> <strong>2007</strong>-<strong>08</strong> <strong>to</strong> <strong>2017</strong>-<strong>18</strong> (<strong>State</strong> <strong>Rail</strong> <strong>Plan</strong>),prepared by the Division of <strong>Rail</strong>, is the Passenger <strong>Rail</strong> Element and examinesintercity and commuter passenger rail services in <strong>California</strong> and reviews theircurrent operations. It also outlines ten-year plans for capital improvements andservice expansions. The Passenger <strong>Rail</strong> Element is covered in Part I, Chapters Ithrough XII.Part II of the <strong>State</strong> <strong>Rail</strong> <strong>Plan</strong>, prepared by the Division of Transportation <strong>Plan</strong>ning,is the Freight <strong>Rail</strong> Element. It provides a description of the freight rail network,issues concerning the freight rail industry, and policy recommendations and goalsfor the maintenance, preservation, improvement, and funding of the system. TheFreight <strong>Rail</strong> element is covered in Part II, Chapters XIII through XIX.1
<strong>2007</strong>-<strong>08</strong> – <strong>2017</strong>-<strong>18</strong> <strong>California</strong> <strong>State</strong> <strong>Rail</strong> <strong>Plan</strong>2
PART IPASSENGER RAIL ELEMENT3
<strong>2007</strong>-<strong>08</strong> – <strong>2017</strong>-<strong>18</strong> <strong>California</strong> <strong>State</strong> <strong>Rail</strong> <strong>Plan</strong>4
Chapter I - <strong>California</strong>’s Vision for Intercity Passenger <strong>Rail</strong>CHAPTER ICALIFORNIA’S VISION FOR INTERCITYPASSENGER RAILThis chapter provides an overview of the Administration’s and Department’s keypolicy documents on transportation mobility and its connection <strong>to</strong> environmentaland land use goals. The chapter then provides an explanation of how intercitypassenger rail furthers the Administration’s and Department’s mobility,environmental and land use goals. Figure 1A illustrates the Administration’s andDepartment’s key policy documents related <strong>to</strong> transportation mobility.Figure 1AGovernor’sStrategicGrowth <strong>Plan</strong>Global WarmingSolutions Act(AB 32)Departmen<strong>to</strong>fTransportationMission/VisionStrategic GoalsAnd Objectives<strong>California</strong>Transportation<strong>Plan</strong> (2025)<strong>California</strong><strong>State</strong><strong>Rail</strong> <strong>Plan</strong><strong>2007</strong>-<strong>08</strong><strong>to</strong><strong>2017</strong>-<strong>18</strong>5
<strong>2007</strong>-<strong>08</strong> – <strong>2017</strong>-<strong>18</strong> <strong>California</strong> <strong>State</strong> <strong>Rail</strong> <strong>Plan</strong>THE ADMINISTRATION’S STRATEGIC GROWTH PLAN – AFRAMEWORK FOR THE FUTUREAs <strong>California</strong> progresses in<strong>to</strong> the second decade of the 21st Century, it facesdifficult challenges. In 1955, the <strong>State</strong>’s population was about 13 million.Currently it is about 37 million, and by 2025 it is anticipated there will be apopulation of 46 million, bringing even more pressure on the ageing infrastructureof the <strong>State</strong>. One very important component of this infrastructure is thetransportation system, which provides a foundation for the movement of peopleand goods.The Administration has initiated plans for meeting the challenges of mobilitybrought about by this growth. A framework for meeting these challenges isincorporated in<strong>to</strong> the Administration’s Strategic Growth <strong>Plan</strong> (SGP).It encompasses an infrastructure improvement program for the <strong>State</strong>’stransportation system, education, housing and waterways. The SGP will be thefirst installment of a 20-year investment on a future that will ensure <strong>California</strong>’squality of life and foster continued economic growth. It balances the necessity ofmeeting infrastructure needs with prudent and fair approaches <strong>to</strong> funding thoseneeds.A major source of funding infrastructure investments is general obligation bonds.For transportation projects $19.9 billion is <strong>to</strong> come from the Highway Safety,Traffic Reduction, Air Quality and Port Security Bond Act (Proposition 1B)approved by the elec<strong>to</strong>rate in the November, 2006 election (Figure 1B).A $400 million segment of Proposition 1B is specifically earmarked for intercitypassenger rail. Other segments of the Bond, such as funding for rail-highwaygrade crossing improvements and public transportation modernization will alsobenefit the intercity passenger rail system. Additional information on Proposition1B and its impact on funding for intercity rail is available in Chapter 12 of thisreport.The SGP is also closely aligned with the Administration’s “Global WarmingSolutions Act” (AB 32, Chapter 488, 2006). This landmark bill requires the<strong>State</strong>’s global warming emissions <strong>to</strong> be reduced <strong>to</strong> 1990 levels by 2020.6
Chapter I - <strong>California</strong>’s Vision for Intercity Passenger <strong>Rail</strong>Figure 1BGeneral Obligation Bond (Prop. 1 B)$19.9 Billion$0.125 BillionLocal Bridge SeismicRetrofit$0.25 BillionHighway-<strong>Rail</strong>roadCrossing Safety Account$0.75 Billion<strong>State</strong> Highway Operationand Protection Program(SHOPP)$2.0 BillionLocal Street and Roads,Congestion Relief, andTraffic safety Account of2006$1.0 Billion<strong>State</strong>-Local PartnershipProgram Account$4.5 BillionCorridor MobilityImprovement Account$1.0 BillionTransit System Safety,Security, and DisasterReponse Account$1 Billion<strong>State</strong> Route 99Corridor$4.0 BillionPublic TransportationModernization,Improvement, and ServiceEnhancement (includes$400 million for intercityrail projects)$ 2.0 Billion<strong>State</strong> TransportationImprovement Program(StIP) Augmentation$0.2 BillionSchool Bus Retrofit for AirQuality$3.1 BillionPorts Infrastructure,Security and Air QualityAIR QUALITY INITIATIVESOn July 1, 2005, the Governor signed Executive Order S-3-05 which establishedclimate change reduction targets for the <strong>State</strong>. The Climate Action Team (CAT),consisting of representatives from various <strong>State</strong> agencies, was created <strong>to</strong>coordinate the statewide effort. Subsequently, AB 32 gave new weight <strong>to</strong> the<strong>State</strong>’s renewable energy goals by requiring the reduction of greenhouse gasemissions (GHG) <strong>to</strong> 1990 levels by 2020. Executive Order S-20-06 further directsstate agencies <strong>to</strong> begin implementing AB 32 and recommendations made by theCAT. The Department is a member of the CAT and is committed <strong>to</strong> implementingtransportation strategies that will help reduce fossil fueled energy and GHGemissions.The Department’s Climate Action Program promotes clean and energy efficienttransportation. The framework is provided by the Direc<strong>to</strong>r’s Policy 23 – EnergyEfficiency and Conservation, and is intended <strong>to</strong> implement a comprehensive,long-term departmental energy policy, interagency collaboration, and acoordinated effort in energy and climate policy, planning and implementation.Department strategy <strong>to</strong> reduce GHG emissions has two elements. The first is <strong>to</strong>make transportation systems more efficient through operational improvements,smart land use, reducing congestion and lowering the rate of growth in fuelconsumption and emissions from mo<strong>to</strong>r vehicles. The second focuses on the7
<strong>2007</strong>-<strong>08</strong> – <strong>2017</strong>-<strong>18</strong> <strong>California</strong> <strong>State</strong> <strong>Rail</strong> <strong>Plan</strong>integration of energy and GHG emission reduction measures in<strong>to</strong> planning, projectdevelopment, operations, and maintenance of transportation facilities, fleets,buildings and equipment.Activities which most strongly pertain <strong>to</strong> the Department strategy are includedthroughout this document. Two recent examples of these activities are theimprovement in equipment efficiency of state owned rail equipment and land useapplications at or near rail stations, both of which are subsequently described inmore detail in this chapter.CALIFORNIA TRANSPORTATION PLANAs a complement <strong>to</strong> the SGP, the Department produced the “<strong>California</strong>Transportation <strong>Plan</strong> 2025” (CTP) which offers a blueprint for meeting the <strong>State</strong>’sfuture mobility needs. It envisions a balanced transportation system that promotessustainability, illustrates the overall vision of the SGP, and incorporates the“Three E’s” of Quality of Life. These include; Prosperous Economy, QualityEnvironment, and Social Equity. To realize the vision a number of goals arepromulgated. Among them are goals <strong>to</strong> improve mobility and accessibility,support the economy, enhance public safety and security, and improve theenvironment. The attainment of these goals will have a salutary effect on thestate’s transportation system and the realization of the 3E vision.THE DEPARTMENT’S MISSION & VISION AND STRATEGICGOALSThe Department’s Mission & Vision is: Caltrans improves mobility across<strong>California</strong>.To realize this Mission & Vision the Department has five Strategic Goals:• Safety – Provide the safest transportation system in the nation for users andworkers• Mobility – Maximize transportation system performance and accessibility• Delivery – Efficiently deliver quality transportation projects and service• Stewardship – Preserve and enhance <strong>California</strong>’s resources and assets• Service – Promote quality service through an excellent workforce8
Chapter I - <strong>California</strong>’s Vision for Intercity Passenger <strong>Rail</strong>THE DEPARTMENT’S MISSION AND VISION FORINTERCITY PASSENGER RAILThe Department’s Intercity Passenger <strong>Rail</strong> Mission and Vision as shown in this<strong>California</strong> <strong>State</strong> <strong>Rail</strong> <strong>Plan</strong> <strong>2007</strong>-<strong>08</strong> <strong>to</strong> <strong>2017</strong>-<strong>18</strong> (<strong>Plan</strong>) supports the SGP, AB 32, theCTP, and the Department’s Mission and Goals, and summarizes and guides theDepartment’s efforts in relation <strong>to</strong> intercity rail.INTERCITY PASSENGER RAIL MISSIONThe Intercity Passenger <strong>Rail</strong> Mission for <strong>California</strong> is <strong>to</strong>:Provide and promote Intercity Passenger <strong>Rail</strong> services while improving,expanding, and integrating all rail service in<strong>to</strong> <strong>California</strong>’s transportation system.INTERCITY PASSENGER RAIL VISIONThe vision for intercity passenger rail has three key goals. They are:Provide a <strong>Rail</strong> Transportation Alternative <strong>to</strong> Other Travel Modes –<strong>Rail</strong> service provides a safe, efficient and cost-effective alternative <strong>to</strong> au<strong>to</strong> and airtravel. There has never been a passenger fatality on <strong>State</strong>-supported Amtrakservice in <strong>California</strong>. For trips between certain cities, rail provides the onlyalternative travel mode <strong>to</strong> the au<strong>to</strong>. <strong>Rail</strong> travel often provides the only viablemode of travel for disabled, senior and low-income travelers. Business and leisuretravelers may choose rail for cost efficiency, and ease of travel. <strong>Rail</strong> can provide acost-effective alternative <strong>to</strong> all travelers in some short haul air marketscharacterized by high fares, such as for air travel within the San Joaquin Valley.Provide Relief <strong>to</strong> Highway and Air Transportation Congestion – In manyintercity corridors highway demand is near or has already exceeded capacity, andin many instances, it is not financially or environmentally feasible <strong>to</strong> add capacity.Intercity rail currently provides congestion relief in corridors where capacity hasalready been exceeded, and rail service can be expanded <strong>to</strong> provide additionalcongestion relief. Intercity rail thus provides an alternative <strong>to</strong> building newhighway capacity. Current investment in rail facilities and infrastructure willprotect rail capacity so it is available in the future <strong>to</strong> provide critical relief <strong>to</strong>highway and airway systems.Concerning the air transportation network, it is also environmentally andfinancially difficult <strong>to</strong> build additional airport capacity. Intercity rail provides aneffective alternative <strong>to</strong> short haul air travel, such as from the Central Valley <strong>to</strong> theBay Area or Southern <strong>California</strong>. It reduces air pollution and helps relievecongestion at airports by eliminating the need for some short distance flights.9
<strong>2007</strong>-<strong>08</strong> – <strong>2017</strong>-<strong>18</strong> <strong>California</strong> <strong>State</strong> <strong>Rail</strong> <strong>Plan</strong>Improve Air Quality, Conserve Fuel, and Contribute <strong>to</strong> Efficient andEnvironmentally Superior Land Use – <strong>Rail</strong> service contributes <strong>to</strong> improved airquality by reducing vehicle miles traveled and vehicle emissions. It reduces fuelconsumption, thereby helping <strong>to</strong> limit dependence on scarce petroleum resources.It also helps <strong>to</strong> reduce the need for highway construction which can contribute <strong>to</strong>inefficient land use patterns which often causes the loss of economically,environmentally, and his<strong>to</strong>rically valuable land.Figure 1C5,000,000Annual Ridership for Amtrak <strong>California</strong> ServiceAnnual Ridership4,500,0004,000,0003,500,0003,000,0002,500,0002,000,0001,500,0001,000,000500,000Capi<strong>to</strong>l CorridorSan JoaquinsPacific Surfliners01996-97 1997-98 1998-99 1999-00 2000-01 2001-02 2002-03 2003-04 2004-05 2005-06<strong>State</strong> Fiscal YearINTERCITY RAIL IS A KEY COMPONENT OFCALIFORNIA’S VISION FOR TRANSPORTATIONIntercity rail is an important component of the transportation system and itsexpansion enhances transportation mobility. Ridership on the state-supportedintercity rail system continues <strong>to</strong> expand. In the five year period from 1996 <strong>to</strong>2001 ridership on the three state supported systems rose 32.5 percent while<strong>California</strong>’s population increased by 8.8 percent. From 2001 <strong>to</strong> 2006 ridershipincreased 35 percent while the <strong>State</strong>’s population rose by 7.1 percent. Servicelevels also increased during this period (Figure 1C). With additional service,which will be substantially funded by Proposition 1B, even more opportunitieswill arise <strong>to</strong> expand ridership.10
Chapter I - <strong>California</strong>’s Vision for Intercity Passenger <strong>Rail</strong>The maintenance and expansion of the intercity rail system will have a positiveimpact on the future mobility and environmental enhancement of the state.Greater utilization of the intercity rail system will take vehicles off the road thatwould otherwise be additional contribu<strong>to</strong>rs <strong>to</strong> air pollution. As well, less fuel willbe consumed, and congestion reduced.For the most recent data available, consistent gains in ridership, revenues andfarebox ratios are shown for all three state-supported corridors. On-timeperformances have shown declines on all corridors, but an expanded capital plan,supported by funds from Proposition 1B should be instrumental in improving ontimeperformance and providing more frequencies which will attract more riders.See Chapter III, Figure 3E, for a graphic assessment of the various intercitypassenger rail routes objectives.RAIL FURTHERS THE DEPARTMENT’S MISSION & GOALSFigure 1D summarizes how the Intercity Passenger <strong>Rail</strong> Program furthers theDepartment’s Strategic Goals. It also provides references <strong>to</strong> where actions <strong>to</strong>further each goal are discussed in more detail in the <strong>Plan</strong>.11
<strong>2007</strong>-<strong>08</strong> – <strong>2017</strong>-<strong>18</strong> <strong>California</strong> <strong>State</strong> <strong>Rail</strong> <strong>Plan</strong>Figure 1DRelationship of Intercity Passenger <strong>Rail</strong> <strong>to</strong> the Department’s Strategic GoalsIntercity <strong>Rail</strong> Program ActionsDepartmentStrategic GoalsSAFETYProvide the safesttransportation systemin the nation forusers and workersMOBILITYMaximizetransportationsystem performanceand accessibilityDELIVERYEfficiently deliverqualitytransportationprojects and servicesSTEWARDSHIPPreserve andenhance <strong>California</strong>’sresources & assetsSERVICEPromote qualityservice and anexcellent workforceAll Capital Projects have a goal of improved safety.The Division inspects rail equipment, facilities, and personnel <strong>to</strong>evaluate compliance with safety standards.The Division supports Operation Lifesaver, a rail safety campaign,with the goal of improved safety at rail crossings.The Division administers the Federal Section 130 CrossingImprovement Program and the Section 190 <strong>State</strong> Grade SeparationProgram <strong>to</strong> improve and construct rail/vehicle crossings forincreased safety.Increase Intercity <strong>Rail</strong> Ridership through operational andmarketing initiatives.Expand the Intercity <strong>Rail</strong> System through added train frequencieson existing routes, route expansions, and new routes.Improve Intercity <strong>Rail</strong> multimodal connectivity with othertransportation modes.All existing train stations and rail cars are “Americans WithDisabilities Act” (ADA) accessible, and capital projects continue<strong>to</strong> improve accessibility.<strong>Rail</strong> service, particularly at peak travel periods, reduces the needfor costly and oftentimes environmentally infeasible highwayexpansion projects.The goal of the intercity rail capital program is <strong>to</strong> deliver$4 billion in projects: $2.3 billion on the Pacific Surfliner Route;$592 million on the San Joaquin Route; $550 million on theCapi<strong>to</strong>l Corridor; and $590 million on the Coast Route.Capital projects are delivered efficiently.The Division preserves <strong>California</strong>’s investment in <strong>State</strong>-ownedrail cars and locomotives through frequent inspections andmaintenance cycles. Rebuilt locomotives now meet EPA clean airstandards. <strong>California</strong> has the largest fleet of <strong>State</strong>-owned railequipment in the country.The Division provides passenger service through the railmarketing program.The Division moni<strong>to</strong>rs Amtrak employees’ performance on-boardtrains.<strong>State</strong> <strong>Rail</strong> <strong>Plan</strong>ReferenceCh. 2; Ch. 3;Ch. 4Ch. 2; Ch. 3;Ch. 4; Ch. 6;Ch. 7; Ch. 8;Ch. 9; Ch. 10;Ch. 11Ch. 2; Ch. 6;Ch. 7; Ch. 8;Ch. 10; Ch. 11;Ch. 12Ch. 1; Ch. 2;Ch. 3Ch. 4; Ch. 6;Ch. 7; Ch. 812
Chapter I - <strong>California</strong>’s Vision for Intercity Passenger <strong>Rail</strong>INTERCITY RAIL SUPPORTS THE ADMINISTRATION’STRANSPORTATION, ENVIRONMENTAL AND LAND USE GOALSThe common theme in all of the Administration and Department transportationdocuments discussed above (SGP, AB 32, CTP and the Department’s Mission &Goals) is that the improvement of the state’s transportation infrastructure willimprove mobility, which will in turn improve the economy, the environment, andsupport social equity.Intercity Passenger <strong>Rail</strong> supports the Administration’s “Global Warming SolutionsAct” (AB 32, 2006). This landmark bill requires the <strong>State</strong>’s global warmingemissions <strong>to</strong> be reduced <strong>to</strong> 1990 levels by 2020. Intercity rail becomesincreasingly more efficient as the number of passengers increase per train.Data confirms that intercity passenger rail is more fuel-efficient than cars andairlines, thus it conserves fuel and improves air quality. (Figure 1E)Figure 1EU.S. Passenger Travel and Energy Use4,0003,5003,0002,5002,0001,5001,000500-2,9353,549 3,587Intercity <strong>Rail</strong> Cars/Trucks AirlinesBTUs Per Passenger MileSource: U.S. Department of Energy, Transportation Energy Data Book: Edition 25 -2006, Table 2.10. BTu(s) is used <strong>to</strong> describe the heat value (energy content) of fuels.Intercity <strong>Rail</strong> Supports the EnvironmentThe Department is also improving the fuel efficiency and emission reduction of its<strong>State</strong>-owned locomotives. During the past decade the Environmental ProtectionAgency has instituted new emission requirements for diesel locomotives. Tier 0standards were instituted in 2001, and required that all locomotives purchasedafter January 1, 2001 meet certain emission standards. The F59 locomotives, thetype that is predominantly used in the <strong>State</strong>-supported rail system, meet the Tier 0requirements, which went in<strong>to</strong> effect in 2001. The next set of standards, calledTier 1, <strong>to</strong>ok effect on January 1, 2004 and requires that passenger locomotivespurchased after that date emit 25 percent less nitrogen oxides (NOx) and13
<strong>2007</strong>-<strong>08</strong> – <strong>2017</strong>-<strong>18</strong> <strong>California</strong> <strong>State</strong> <strong>Rail</strong> <strong>Plan</strong>33 percent less particulates than previously allowed. Tier 2 standards, which <strong>to</strong>okeffect January 1, 2005, required that passenger locomotives purchased after thatdate emit 35 percent less NOx and less than half the particulates than previouslyallowed.The <strong>State</strong> owns 17 locomotives (15 EMD F59 and two General Electric [GE]units) all of which were purchased before 2001. Although purchased before 2001the F59 locomotives were upgraded <strong>to</strong> Tier 0 before being required <strong>to</strong> do so.The two GE locomotives will be overhauled in early 20<strong>08</strong> at which time they willbe brought up <strong>to</strong> Tier 0 standards. The F59 locomotives will receive Tier 2 enginekits for the main engines at their next overhaul. Overhauls are scheduled <strong>to</strong> beginduring the summer of 20<strong>08</strong>.Additionally, the Head End Power (HEP) units on the locomotives, whichgenerate electricity <strong>to</strong> supply power for lighting and utilities within the passengercars, are being updated. All F59 locomotives are scheduled <strong>to</strong> be equipped withAu<strong>to</strong>matic Start S<strong>to</strong>p (AESS) systems within the next two years. This systemreduces excessive engine idling resulting in reduced exhaust emissions and fuelsavings. To date five systems have been installed and preliminary analysis show amarked reduction in emissions and increased fuel savings.Intercity <strong>Rail</strong> Supports Smart Land UseThe Department continues <strong>to</strong> promote integrated land use and transportationwherever possible. The CTP makes note of the impacts of community planning ontravel behavior. In particular, in the past several decades fac<strong>to</strong>rs such as lack ofcoordinated decision making between various community and governmentalbodies, zoning ordinances that tend <strong>to</strong> isolate employment and service activities,and urban sprawl have all negatively affected the economy, social equity andcommunity patterns. With continued increases in population and congestion,a viable transportation system tied <strong>to</strong> appropriate land use is of great benefit <strong>to</strong> the<strong>State</strong>.The Department supports efforts by cities, counties and the private sec<strong>to</strong>r <strong>to</strong>develop and maintain transit-oriented development projects near Amtrak stationsthat enhance community livability by providing housing options, jobs, retail, andservices within easy walking distance of the station. The Department hasdeveloped and built a number of intercity station projects with integrated land useand transit linkages playing a prominent role. As well, substantial improvementsin parking have been made at intercity rail stations, often in partnership with localagencies.The following are examples of Amtrak stations where transit-orienteddevelopment has recently occurred or is planned: The Appendix provides acomplete list of Amtrak stations on the intercity passenger rail routes, anddescribes transit connections and mixed-use developments at the stations.14
Chapter I - <strong>California</strong>’s Vision for Intercity Passenger <strong>Rail</strong>Bakersfield – The Bakersfield station opened in July 2000. The station is locatedin the heart of the civic center entertainment complex, which includes theBakersfield Convention Center and Centennial Garden Arena. New developmentsnear the station include additional entertainment and recreation facilities, retail andoffice space, and multi-family housing. Bakersfield is served by an extensivenetwork of Amtrak thruway buses in addition <strong>to</strong> Golden Empire Transit and KernRegional Transit bus service.Emeryville – A large, three building 550,000 square foot mixed use project isbeing developed near the Emeryville station. The project contains office andcommercial space as well as owner occupied lofts and <strong>to</strong>wn houses and seniorhousing. The station is served by the Capi<strong>to</strong>l Corridor, San Joaquins,Coast Starlight and <strong>California</strong> Zephyr long-distance Amtrak trains, AC Transitbuses, and a free shuttle bus that connects <strong>to</strong> the MacArthur BART station andvarious businesses, work sites, and retail and entertainment centers.Fuller<strong>to</strong>n – Two major high-density transit-oriented development projectsadjacent <strong>to</strong> the station were completed in 2004. There are approximately400 residential units in these two developments, and both include office and retailspace at street level. Residents are eligible <strong>to</strong> receive free commuter passesthrough a Metrolink program. A conceptual master plan has been prepared for theUP Recreation Trail and Neighborhood Park, a one-acre park with a recreationtrail from the station <strong>to</strong> Independence Park. Fuller<strong>to</strong>n station is served by thePacific Surfliners, the Amtrak long distance Southwest Chief, and Metrolinkcommuter rail.Oakland (Jack London Square) – A large, high-density housing complex wasconstructed across the railroad <strong>to</strong> the west of the station. To the north of thisproject, the Jack London Square area has undergone a great deal of transformationin recent years changing from a predominantly industrial port area <strong>to</strong> a busy retailand entertainment district. Also, major new housing and business projects arebeing constructed near the station <strong>to</strong> the east of the railroad. In order <strong>to</strong>accommodate increased ridership at the station, the Department and theCCJPA are planning <strong>to</strong> widen the platform at the station. The station is served bythe San Joaquin, Capi<strong>to</strong>l Corridor, Coast Starlight trains, Amtrak thruway buses,and AC Transit. The station is within several blocks of the Oakland-AlamedaFerry Terminal and the Lake Merritt BART station.15
<strong>2007</strong>-<strong>08</strong> – <strong>2017</strong>-<strong>18</strong> <strong>California</strong> <strong>State</strong> <strong>Rail</strong> <strong>Plan</strong>Richmond – This station is a transit node where passengers can transfer betweenBART trains and San Joaquins or the Capi<strong>to</strong>l Corridor. The station is also servedby AC Transit and Golden Gate Transit. A pedestrian-oriented transit village hasbeen built at this station. The completed project comprises 231 <strong>to</strong>wnhouses,27,000 square feet of retail space and a 30,000 square foot performing and culturalarts facility. In order <strong>to</strong> accommodate increased ridership at the station, theDepartment and CCJPA constructed a new center boarding platform at the stationwith a passenger shelter, seating, and a new stairwell and eleva<strong>to</strong>r providing adirect connection <strong>to</strong> the BART station. A new Amtrak station building and plazahas also been constructed.San Diego – A high-density condominium project adjacent <strong>to</strong> the station has beencompleted and a second large scale innovative project is underway. It combinesart museum facilities and rail maintenance and supply s<strong>to</strong>rage space. In addition amajor high-rise residential development within the perimeter of the His<strong>to</strong>ricElectrical Building and across the street from the station has been built. Severalother developments with commercial and residential units are being constructedwithin walking distance of the rail depot. The station is served by thePacific Surfliners and by Coaster commuter rail as well as the San Diego Trolley,San Diego Transit and Mexicoach buses.Simi Valley – The City of Simi Valley, in partnership with the County of Ventura,is developing a transit village plan near the Simi Valley station. Nearly 650single-family and multi-family homes are currently under development orconsideration in the proposed area. The plan would include a seven-acrecommercial center, a 45-acre park and community center, 40 acres of othercommercial and industrial uses, 75 acres of residential property, and 20 acres ofopen space. The City's multimodal transit station is currently served by Metrolinkcommuter rail, the Pacific Surfliners, Amtrak’s long distance Coast Starlight, citybuses, Los Angeles County buses, San Joaquin Route connecting buses, local taxisand the city's extensive pedestrian/bike trail system.16
Chapter II – Capital ProgramCHAPTER IICAPITAL PROGRAMThis chapter describes the intercity rail capital program. It includes theunconstrained and constrained ten-year capital program funding levels and projectlist, a discussion of his<strong>to</strong>rical funding for the capital program, and the equipment,grade-crossing, and station programs.CAPITAL PROGRAM GOALSThe Department’s goals for its Capital Program are as follows:• Increase capacity on existing routes <strong>to</strong> allow increased frequencies,improved reliability, and better on-time performance.• Reduce train-running times <strong>to</strong> provide travel times directly competitivewith the au<strong>to</strong>mobile.• Improve operational functioning and attractiveness of equipment, stationsand facilities, including improved multimodal connectivity.• Increase farebox ratio <strong>to</strong> reach or exceed the Department’s 50 percentstandard. (Furtherance of the three above goals will result in improvedcost-effectiveness and increased farebox ratio.)• Improve safety of <strong>State</strong>-supported intercity rail service, including gradecrossings.• Implement projects <strong>to</strong> allow new cost-effective routes.These goals are used <strong>to</strong> guide the development of the ten-year capital programdescribed below. Every capital project furthers one or more of these goals.UNCONSTRAINED TEN-YEAR CAPITAL PROGRAMFigure 2A presents the Department’s ten-year unconstrained capital program forthe three existing <strong>State</strong>-supported routes and the Coast Route. This $4.03 billioncapital program is based on project needs, and not funding expectations. It onlyincludes projects where the state or other public entity is anticipated <strong>to</strong> bea funding partner, and does not include projects that will be fully funded bya railroad. Full project costs are included. Figure 2B is a list of projects includedin the unconstrained program. (See Figure 2C below for a constrained capitalprogram consistent with expected future <strong>State</strong> funding levels.)The unconstrained Ten-Year Intercity <strong>Rail</strong> Capital Program was developed froma number of sources. First, the near-term projects include all projects currently17
<strong>2007</strong>-<strong>08</strong> – <strong>2017</strong>-<strong>18</strong> <strong>California</strong> <strong>State</strong> <strong>Rail</strong> <strong>Plan</strong>underway, and programmed in the STIP, TCRP Program, and anticipated <strong>to</strong> befunded in the Proposition 1B Bond Program.For the Pacific Surfliner Route, longer range projects are based on projects in theLOSSAN Corridor Strategic <strong>Plan</strong> (Los Angeles <strong>to</strong> San Diego), and the LOSSANNorth Corridor Strategic <strong>Plan</strong> (Los Angeles <strong>to</strong> San Luis Obispo).The unconstrained program contains all immediate and near term projects in theLOSSAN <strong>Plan</strong>s, and a few long-term projects.The San Joaquin Route longer-term projects are based on preliminary results ofthe route’s Strategic Business <strong>Plan</strong> which is currently underway, and it isanticipated <strong>to</strong> be completed in early 20<strong>08</strong>. Some preliminary project costs havebeen developed; however it is anticipated that with the submission of the final<strong>Plan</strong> cost figures for proposed projects will be further refined.The Capi<strong>to</strong>l Corridor longer-term project list was developed in conjunction withCCJPA staff. It is based on the CCJPA Vision <strong>Plan</strong> of 2005 which is updatedperiodically. The Coast Route projects are based on Amtrak’s <strong>California</strong>Passenger <strong>Rail</strong> System 20-Year Improvement <strong>Plan</strong>. See “Corridor Strategic<strong>Plan</strong>ning” in this chapter for a more detailed description of the Strategic <strong>Plan</strong>s.Timely implementation of this capital program is dependent on receipt of a largeportion of the Federal funding and/or receipt of funds from tax credit bonds.If such Federal funding is unavailable, implementation of this capital program willhave <strong>to</strong> be delayed <strong>to</strong> reflect the level of <strong>State</strong> funding made available from futureSTIP programming cycles, as supplemented by any other available fundingsources. It is certain that <strong>State</strong> funding alone would not be adequate <strong>to</strong> fund thisprogram.<strong>18</strong>
Chapter II – Capital ProgramFigure 2ARouteUnconstrained Ten-Year Intercity <strong>Rail</strong> Capital Program Project CostsFY <strong>2007</strong>-<strong>08</strong> through FY <strong>2017</strong>-<strong>18</strong>($ in millions)Track andSignalStationsGradeCrossingsRolling S<strong>to</strong>ckandMaintenanceFacilitiesTotal CostEXISTING ROUTESPacific Surfliner - North $ 599.0 $ 57.3 $ - 1 $ 656.3Pacific Surfliner - South $ 1,000.2 $ 151.5 $ 365.0 $ 125.0 $ 1,641.7San Joaquin $ 472.9 $ 36.3 $ - $ 83.0 $ 592.2Capi<strong>to</strong>l Corridor $ 286.6 $ 114.7 $ 67.0 $ 82.0 $ 550.3Sub<strong>to</strong>tal $ 2,358.7 $ 359.8 $ 432.0 $ 290.0 $ 3,440.5PROPOSED ROUTES 2Coast $ 495.9 $ 10.3 $ 14.0 $ 70.0 $ 590.2TOTAL $ 2,854.6 $ 370.1 $ 446.0 $ 360.0 $ 4,030.71 Included in Pacific Surfliner - South.2 Based on Amtrak's <strong>California</strong> Passenger <strong>Rail</strong> 20-Year Improvement <strong>Plan</strong>.Capital Costs for other proposed routes (Reno and Redding) were not studied in the Amtrak <strong>Plan</strong>,and current comparable cost estimates are not available.PROJECTED CAPITAL PROJECTSFigure 2B is the proposed list of projects that comprise the unconstrained capitalprogram for the Pacific Surfliners, San Joaquins, Capi<strong>to</strong>l Corridor andCoast Route. The projects are not listed in priority order.19
<strong>2007</strong>-<strong>08</strong> – <strong>2017</strong>-<strong>18</strong> <strong>California</strong> <strong>State</strong> <strong>Rail</strong> <strong>Plan</strong>Figure 2BUnconstrained Capital Program ProjectsPacific Surfliner RouteCapital Projects <strong>2007</strong>-<strong>08</strong> through <strong>2017</strong>-<strong>18</strong>Project Description Cost ($000)Pacific Surfliner Route - NorthSTATION PROJECTSStation Improvements* Multiple Stations $ 11,725Oxnard Station Parking $ 1,100Camarillo Station Pedestrian Crossing $ 1,000Van Nuys 2nd platform and track work $ 25,600Goleta Station Improvements $ 700Camarillo Station Improvements $ 10,200Simi Valley Station Improvements $ 6,000Moorpark Station Imps $ 1,000Sub<strong>to</strong>tal of Station Projects $ 57,325TRACK AND SIGNAL PROJECTSWaldorf Siding Extension Santa Barbara County $ 15,000Tangair Siding Extension Santa Barbara County $ 22,000Ortega Siding $ 30,000Seacliff Siding Realignment $ 35,000Moorpark <strong>to</strong> Simi Valley <strong>Rail</strong> Replacement $ 24,000Simi Valley <strong>to</strong> CP Strathern Second Main Track $ 37,000Burbank Jct. Track Realignment $ 8,500CP Raymer <strong>to</strong> CP DeSo<strong>to</strong> Second Main Track Los Angeles County $ 50,000Burbank Siding Extension $ 8,500San Luis Obispo-Santa Barbara Signal Upgrades $ 250,000Moorpark-Burbank Track & Signal Imps $ 1,500Leesdale Siding Extension $ 15,000Narlon, Honda, Concepcion Island CTC $ 30,000Capi<strong>to</strong>n Siding and CTC $ 10,000Goleta Service Track Extension $ 10,000Sandyland Siding $ 15,000Santa Clara River Curve Alignment $ 6,000Montalvo Curve Alignment $ 2,000CP West Camrillo Curve Realignments $ 5,000Strathearn Siding Curve Realignment $ 1,000Selected Corridor Improvements* Security and Communications upgrades $ 20,100Capitalized Maintenance* $ 3,350Sub<strong>to</strong>tal Track and Signal Projects $ 598,950Sub<strong>to</strong>tal Pacific Surfliner Route - North $ 656,275* - Pacific Surfliner Route project split: North 33.5%-South 66.5%, includes North portion of these projects.20
Chapter II – Capital ProgramFigure 2B (continued)Unconstrained Capital Program ProjectsPacific Surfliner RouteCapital Projects <strong>2007</strong>-<strong>08</strong> through <strong>2017</strong>-<strong>18</strong>Project Description Cost ($000)Pacific Surfliner Route - SouthSTATION PROJECTSStation Improvements* Multiple Stations $ 23,275Solana Beach Station Parking Structure $ <strong>18</strong>,000LA S<strong>to</strong>rage Track $ 38,100Fuller<strong>to</strong>n Station Parking Structure $ 25,200Multiple Stations Ticket Vending Machinges $ 10,400Multiple Stations Electronic Passenger InformationSystems$ 1,500LA Union Station Station Tracks and Platforms $ 35,000Sub<strong>to</strong>tal Station Projects $ 151,475TRACK AND SIGNAL PROJECTSOceanside Double Track 1.2 miles of double track $ 13,603Del Mar Bluff Stabilizations Stabilze Bluff Area $ 12,735San Diegui<strong>to</strong> River Bridge Construct double track concrete bridge $ 34,428Sorren<strong>to</strong>-Miramar Double Track Construct second main track $ 27,600Carlsbad Double Track Project $ 17,700Double Track - San Diego County Various Locations $ 80,000Replace wooden trestle and bridges and ConstructSecond SpansVarious Locations $ 100,000LA Union Station Run Through Tracks $ 500,000LA-Fuller<strong>to</strong>n Triple Tracks $ 100,000Santa Margarita Bridge Replace bridge-construct double track $ 39,200CP Pulgas <strong>to</strong> MP 423 Second Main Track San Diego County $ 28,400Selected Corridor Improvements* Security and Communications upgrades $ 39,900Capitalized Maintenance* $ 6,650Sub<strong>to</strong>tal Track and Signal Projects $ 1,000,216GRADE SEPARATION PROJECTSCity of Encinitas Grade Separation 3 Pedestrian Grade Separations $ 15,000Leucadia Grade Separation Grade Separation San Diego County $ 50,000LA-Fuller<strong>to</strong>n Grade Separations 6 Grade Separations $ 300,000Sub<strong>to</strong>tal Grade Separation Projects $ 365,000MAINTENANCE FACILITIES AND EQUIPMENT PROJECTSSan Diego Layover Facility $ 50,000Equipment 3 Train Sets $ 75,000Sub<strong>to</strong>tal Maintenance Facilities and Equipment Projects $ 125,000Sub<strong>to</strong>tal Pacific Surfliner Route - South $ 1,641,691GRAND TOTAL - PACIFIC SURFLINER ROUTE $ 2,297,966* - Pacific Surfliner Route project split: North 33.5%-South 66.5%, includes South portion of these projects.21
<strong>2007</strong>-<strong>08</strong> – <strong>2017</strong>-<strong>18</strong> <strong>California</strong> <strong>State</strong> <strong>Rail</strong> <strong>Plan</strong>Figure 2B (continued)STATION PROJECTSElk Grove StationS<strong>to</strong>ck<strong>to</strong>n ACE StationUnconstrained Capital Program ProjectsSan Joaquin RouteCapital Projects <strong>2007</strong>-<strong>08</strong> through <strong>2017</strong>-<strong>18</strong>Project Description Cost ($000)Construct 8" above <strong>to</strong>p of rail platform withshelter and lighting for the new stationRenovate former SP Depot for use by ACEand San Joaquin Route trains, upgradingplatforms and station tracksRichmond Station Complete design and construction of station $ 4,900Richmond StationDesign and construct 800 space parkinggarage$ 5,200Martinez StationAcquire land for additional parking andconstruct parking structure$ 11,000S<strong>to</strong>ck<strong>to</strong>n BNSF StationDesign, environmental documentation fornew station, purchase ROW and construct $ 7,500new stationMadera Station Construct station $ 2,543Sub<strong>to</strong>tal of Station Projects $ 36,343TRACK AND SIGNAL PROJECTSSacramen<strong>to</strong> - S<strong>to</strong>ck<strong>to</strong>n Track infrastructure projects Improve infrastructure including bridges $ 100,000Port Chicago <strong>to</strong> Oakley Double Track - Phase IEnvironmental, engineering and design for17.6 miles of double track; install CTC$ 33,900Port Chicago <strong>to</strong> Oakley Double Track - Phase II Construct double track $ 75,000S<strong>to</strong>ck<strong>to</strong>n Northwest Quadrant Track ConnectionsDesign, purchase land, construction of trackconnection$ 1,500Merced Crossover Design and construct crossover $ 5,000Wheat <strong>to</strong> Avena - San Joaquin County Construction of second track $ 40,000Escalon <strong>to</strong> Avena - San Joaquin County Extend double track $ 30,000Hanford <strong>to</strong> Shirley Extend double track $ 10,000Guernsey <strong>to</strong> Hanford Double track $ 36,000Gregg Double Track - Fresno County Double track $ 22,500Merced <strong>to</strong> Le Grand Double track $ 69,000Shafter <strong>to</strong> Jastro - Kern County Double track $ 40,000San Joaquin Route Capitalized Maintenance $ 10,000Sub<strong>to</strong>tal of Track and Signal Projects $ 472,900MAINTENANCE FACILITIES AND EQUIPMENT PROJECTSEquipment 2 sets equipment (6 cars-1 locomotive) $ 50,000Fresno Layover Facility Design and construct layover facility $ 15,000Sacramen<strong>to</strong> Layover Facility Design and construct layover facility $ <strong>18</strong>,000Sub<strong>to</strong>tal of Maintenance Facilities and Equipment Projects $ 83,000GRAND TOTAL SAN JOAQUIN ROUTE $ 592,243$$8004,40022
Chapter II – Capital ProgramFigure 2B (continued)Unconstrained Capital Program ProjectsCaptiol CorridorCapital Projects <strong>2007</strong>-<strong>08</strong> through <strong>2017</strong>-<strong>18</strong>Project Description Cost ($000)STATION PROJECTSFairfield - Vacaville $ 38,000Hercules $ 31,000Emeryville - Station and Track Improvements $ 10,000Sacramen<strong>to</strong> - Track Improvements $ 23,000Ticketing, Passenger Info $ 12,700Sub<strong>to</strong>tal of Station Projects $ 114,700TRACK AND SIGNAL PROJECTSSacramen<strong>to</strong> - Martinez Track Improvements $ 38,000Yolo Causeway Crossover $ 7,000Hayward Double Track $ 22,000Travel Time Reliability $ 22,000San Jose 4th Track $ 20,600Oakland - Embarcadero $ 27,000Solano -Yolo Track Improvements $ 19,000Dumbar<strong>to</strong>n Passenger <strong>Rail</strong> $ 34,000Santa Clara <strong>to</strong> Alviso Double Track $ 27,000Sacramen<strong>to</strong> - Roseville 3rd Track $ 60,000Annualized maintenance $ 10,000Sub<strong>to</strong>tal of Track and Signal Projects $ 286,600GRADE SEPARATION PROJECTSGrade Separation Projects $ 67,000Sub<strong>to</strong>tal of Grade Separation Projects $ 67,000MAINTENANCE FACILITIES AND EQUIPMENT PROJECTSRolling S<strong>to</strong>ck $ 82,000Sub<strong>to</strong>tal of Maintenance Facilities and Equipment Projects $ 82,000GRAND TOTAL CAPITOL CORRIDOR $ 550,30023
<strong>2007</strong>-<strong>08</strong> – <strong>2017</strong>-<strong>18</strong> <strong>California</strong> <strong>State</strong> <strong>Rail</strong> <strong>Plan</strong>Figure 2B (continued)Unconstrained Capital Program ProjectsCoast RouteCapital Projects <strong>2007</strong>-<strong>08</strong> through <strong>2017</strong>-<strong>18</strong>Project Description Cost ($000)STATION PROJECTSPajaro, King City and Salinas Stations Station Improvements $ 7,280Passenger Service Enhancements $ 3,000Sub<strong>to</strong>tal of Station Projects $ 10,280TRACK AND SIGNAL PROJECTSSan Jose (Tamien) <strong>to</strong> Gilroy Second Main Track Second Main Track $ 75,470Gilroy <strong>to</strong> San Luis Obispo Track Upgrades Track Upgrades $ 84,530Gilroy <strong>to</strong> San Luis Obispo Signal Upgrades Signal Upgrades $ 71,870Sargent <strong>to</strong> Aromas Curves Realignments Curves Realignments $ 122,150Watsonville Wye Curve Realignments Curves Realignments $ 11,230San Lucas Siding New Siding $ 7,560Bradley Siding Extension - near Paso Robles Siding Extension $ 8,170Cuesta Second Main Track Second Main Track $ 114,910Sub<strong>to</strong>tal of Track and Signal Projects $ 495,890GRADE CROSSING PROJECTSSafety and Mobility Enhancements $ 14,000Sub<strong>to</strong>tal Grade Crossing Projects $ 14,000MAINTENANCE FACILITIES AND EQUIPMENT PROJECTSEquipment Rolling S<strong>to</strong>ck - 2 Sets $ 60,000Layover Facility Improvements $ 10,000Sub<strong>to</strong>tal of Maintenance Facilities and Equipment Projects $ 70,000GRAND TOTAL COAST ROUTE $ 590,170CORRIDOR STRATEGIC PLANNINGPACIFIC SURFLINER ROUTEIn November 2003, the Department released the LOSSAN Corridor Strategic <strong>Plan</strong>- Los Angeles <strong>to</strong> San Diego Proposed <strong>Rail</strong> Corridor Improvement Study.This <strong>Plan</strong> analyzes rail improvements from a corridor wide perspective.It establishes a program of projects for immediate, near-term and long-termimprovements on the corridor needed <strong>to</strong> support existing and proposed levels ofrail service which include intercity and commuter passenger rail and freight rail.It complements the Environmental Impact Report/Environmental Impact<strong>State</strong>ment (EIR/EIS) process discussed below, and served as the project screeningprocess <strong>to</strong> determine which alternatives and design options should be examined inthe EIR/EIS.The work on the EIR/EIS started in 2002, when the Department, in cooperationwith the Federal <strong>Rail</strong>road Administration (FRA), <strong>California</strong> High-Speed <strong>Rail</strong>Authority (CHSRA), Amtrak and regional and local planning agencies,participated in technical studies that analyzed alternatives and opportunities forrail corridor improvements between Los Angeles and San Diego. As part of thesestudies, the Department and FRA jointly under<strong>to</strong>ok a program level EIR/EIS <strong>to</strong>24
Chapter II – Capital Programevaluate potential rail corridor improvements. The EIR/EIS was completed inSpring 2005. This document will facilitate environmental reviews of specificproject improvements under both the <strong>California</strong> Environmental Quality Act(CEQA) and the National Environmental Policy Act (NEPA).In June 2005, the Draft LOSSAN North Corridor Strategic <strong>Plan</strong> was released;it covers the route from Los Angeles <strong>to</strong> San Luis Obispo. The Department,in cooperation with regional planning agencies, Amtrak, Southern <strong>California</strong>Regional <strong>Rail</strong> Authority (SCRRA), Union Pacific <strong>Rail</strong>road (UP) and otherstakeholders, completed this <strong>Plan</strong>. The <strong>Plan</strong> outlines a list of capital projectsrequired <strong>to</strong> improve rail service for the immediate period (up <strong>to</strong> three years),near-term (four <strong>to</strong> eight year), and vision (nine <strong>to</strong> 20 years).After a period of review and comment, it was decided that additional work wouldbe undertaken before the <strong>Plan</strong> was finalized. Detailed rail capacity modeling wasdone and potential alternatives for commuter rail service between Ventura andSanta Barbara counties were studied. This information was included in a revisedfinal draft LOSSAN North Strategic <strong>Plan</strong>, released in June <strong>2007</strong>. In August <strong>2007</strong>,a LOSSAN Strategic Business <strong>Plan</strong> corridor-wide summary document wasreleased that included highlights from both Strategic <strong>Plan</strong>s including a capitalfunding program.Please note that the term LOSSAN now refers <strong>to</strong> the entire Pacific Surflinercorridor from San Diego <strong>to</strong> San Luis Obispo, even though the term originallyreferred <strong>to</strong> only the Los Angeles-San Diego segment. LOSSAN also refers <strong>to</strong> theLos Angeles-San Diego-San Luis Obispo <strong>Rail</strong> Corridor Agency.SAN JOAQUIN ROUTEIn April 2006, the Department initiated a vision plan for the San Joaquin Route.The Strategic Business <strong>Plan</strong> is being developed in conjunction with theSan Joaquin Valley <strong>Rail</strong> Committee, Amtrak, BNSF, UP and the public.The overall goal is <strong>to</strong> further develop the San Joaquins as an alternativetransportation system that relieves highway and air congestion and supportsefficient, environmentally compatible land use. The <strong>Plan</strong> will include a long-termcapital program and identify possible Route extensions and their revenue andridership. The Department anticipates the <strong>Plan</strong> will be completed in early 20<strong>08</strong>.CAPITOL CORRIDORThe CCJPA has issued a new Vision <strong>Plan</strong>, updated June 2005. This updates theoriginal Vision <strong>Plan</strong>, issued in May 2002. The <strong>Plan</strong> provides objectives,implementing strategies and actions for continued growth and expansion on theCorridor. The <strong>Plan</strong>, in conjunction with the 2005-06 CCJPA Business <strong>Plan</strong>,includes Tier I (1-5 year) capital projects and Tier II (6-20 year) capital projects.(The CCJPA identified which Tier II projects are within the ten-year timeframe ofthe <strong>State</strong> <strong>Rail</strong> <strong>Plan</strong>.)25
<strong>2007</strong>-<strong>08</strong> – <strong>2017</strong>-<strong>18</strong> <strong>California</strong> <strong>State</strong> <strong>Rail</strong> <strong>Plan</strong>OTHER PROPOSED ROUTESThe Department’s intercity rail program of new services shown in Figure 3Aincludes three route extensions/new routes: the Coast Route between San LuisObispo and San Francisco, Sacramen<strong>to</strong>-Reno and Sacramen<strong>to</strong>-Redding. Of these,only the Coast Route has been studied in detail. Amtrak’s 2001 <strong>California</strong>Passenger <strong>Rail</strong> System 20-Year Improvement <strong>Plan</strong> describes a $550 millionprogram of capital improvements for the Route, including immediate andnear-term projects.CONSTRAINED CAPITAL PROGRAMThe Department has also developed a constrained capital program based on <strong>State</strong>funding levels reasonably anticipated <strong>to</strong> be available over the next ten years.This $700 million program is shown in Figure 2C. This program funding levelassumes:• $25 million a year in the <strong>State</strong> Transportation Improvement <strong>Plan</strong> (STIP) or$250 million over the ten-year period.• $50 million in remaining Traffic Congestion Relief Program (TCRP)intercity rail project funding.• $400 million in Proposition 1B intercity rail fundsIt is difficult <strong>to</strong> project future available STIP funding for intercity rail, because somany variables are involved in projecting funding levels. $25 million in annualprojected STIP funding is a conservative estimate. The 1996 STIP provided$117 million in funding for intercity rail projects, while the 1998 STIP, asaugmented, provided an additional $<strong>18</strong>1 million. The 2000 STIP provided$46 million, and the 2002 STIP increased funding by $106 million. No additionalfunds were made available in the 2004 STIP. The 2006 STIP and STIPAugmentation provide an additional $117 million over five years, for an averageannual amount of $23 million.The TCRP specified a list of projects <strong>to</strong> be funded, including over $200 million forspecific intercity rail capital projects. To date about $150 million in projects havebeen allocated. Thus the constrained program includes $50 million in unallocatedTCRP funds. Proposition 1B makes available $400 million for intercity railprojects. From the Proposition 1B <strong>to</strong>tal, the <strong>2007</strong>-<strong>08</strong> Budget Act appropriates$<strong>18</strong>7 million for intercity rail projects. The remaining amount of $213 million isexpected <strong>to</strong> be appropriated in 20<strong>08</strong>-09.This program includes only <strong>State</strong> funds estimated <strong>to</strong> be spent on each route. Atthis time, it does not include estimates of non-state funds <strong>to</strong> be spent in theprogram. Specific projects are those that are programmed in the 2006 STIP andAugmentation and from the Proposition 1B Bond list and include track and26
Chapter II – Capital Programsignals, stations, grade separations/crossings and rolling s<strong>to</strong>ck and maintenancefacilities. Any remaining funds would be used for the next highest priorityprojects.Figure 2CConstrained Ten-Year Intercity <strong>Rail</strong>Capital Program Project CostsFY <strong>2007</strong>-<strong>08</strong> through FY <strong>2017</strong>-<strong>18</strong>($ in millions)EstimatedRouteAmount <strong>to</strong> beSpent on EachRoutePacific Surfliner - North $ 133.5Pacific Surfliner - South $ 334.0San Joaquin $ 120.5Capi<strong>to</strong>l Corridor $ 112.0Total $ 700.0CAPITAL PROGRAM FUNDINGHISTORYIn the early 1970’s the intercity rail capital program was originally funded fromspecial legislation and the Intermodal Facilities Program. This program was thenbroadened <strong>to</strong> become the Transit Capital Improvement (TCI) Program, which usedboth Transportation <strong>Plan</strong>ning and Development Account funds (whichsubsequently became the PTA) and SHA funds. In the late 1980s, some capitalfunding was provided through direct appropriations in the Budget Act or in otherlegislation. Proposition 1<strong>08</strong> provided $1 billion in bond funds for rail projects,including about $225 million for intercity rail. Proposition 116, a vo initiativemeasure, also was approved. It provided $2 billion for rail, including about$382 million for intercity rail. To date, practically all available Proposition 1<strong>08</strong>and 116 funds for intercity rail have been used.The new bond programs allowed the Department <strong>to</strong> begin its intercity railequipment acquisition program. Prior <strong>to</strong> passage of the bonds there was limitedfunding available for the acquisition of intercity rail equipment. This is becauseArticle XIX of the <strong>State</strong> Constitution does not allow rail equipment <strong>to</strong> be fundedfrom SHA funds that are generated by excise taxes on fuel. Proposition 116specifically required that the Department design and acquire intercity railequipment and provided a funding source for equipment.27
<strong>2007</strong>-<strong>08</strong> – <strong>2017</strong>-<strong>18</strong> <strong>California</strong> <strong>State</strong> <strong>Rail</strong> <strong>Plan</strong>In 1997, Chapter 622, Statutes of 1997 [Senate Bill (SB) 45-Kopp], was passedwhich gives intercity rail projects a minimum of nine percent of the interregionalportion of the STIP as part of the Interregional Transportation ImprovementProgram (ITIP). Intercity rail projects can also be funded in the RegionalTransportation Improvement Program (RTIP). As a result, in the 1996 STIP, 1998STIP, the 1998 STIP Augmentation, the 2000 STIP, the 2002 STIP and the2006 STIP and STIP Augmentation (due <strong>to</strong> severe funding constraints, the2004 STIP did not program any new funding for intercity rail projects), a <strong>to</strong>tal of$567 million was programmed. Of this amount $402 million has been allocated.Since the passage of SB 45 in 1997, most intercity rail funding provided by the<strong>State</strong> has come from projects proposed by the Department in the ITIP, whichreceives only 25 percent of all STIP funding. The RTIP, for which projects areproposed by the Regional Transportation <strong>Plan</strong>ning Agencies (RTPAs), receivesthe remaining 75 percent of STIP funding. However, as part of the partnershipbetween the Department and the RTPAs, significant intercity rail expansions willrequire funding commitments from RTPAs in the RTIP.Chapter 91, Statutes of 2000 [Assembly Bill (AB) 2928–Torlakson], establishedthe Governor’s TCRP <strong>to</strong> be funded from the TCRF. The TCRP contained$201.5 million for specific intercity rail capital projects, including $148.5 millionfor the Pacific Surfliners, $25 million for the San Joaquins, and $28 million forthe Capi<strong>to</strong>l Corridor.The 1999-00 Budget provided $17.5 million for equipment acquisition. Also in1999-00, $17 million in proceeds from leveraged leaseback of the existing<strong>California</strong> Car and locomotive fleet was received for purchase of new intercity railequipment. The 2001-02 Budget included $91 million in PTA funds for trackimprovements on all three <strong>State</strong>-supported routes.Additional funding will come from Proposition 1B. The intercity rail programwill receive $400 million from this Act. A <strong>to</strong>tal of $<strong>18</strong>7 million has beenappropriated for projects in the <strong>2007</strong>-20<strong>08</strong> Budget, including $150 million for newequipment.Figure 2D provides a summary of all capital funding for intercity rail in <strong>California</strong>since the beginning of <strong>State</strong>-supported rail service. The summary reflects allexpended and allocated funds, including funds from Propositions 1<strong>08</strong> and 116,funds provided by the TCRP, and funds from all sources programmed in the 1996,1998, 2000, and 2002 STIPs and carried over <strong>to</strong> the 2004 STIP. As of December2005 over $2.8 billion has been invested or reserved, including projects forstations, track and signal improvements, maintenance and layover facilities androlling s<strong>to</strong>ck. Although the <strong>State</strong> has provided about 63 percent of the <strong>to</strong>talinvestment, local entities, the Federal government, Amtrak, and the privaterailroads have made substantial contributions.28
Chapter II – Capital ProgramThe Department’s publication, the <strong>California</strong> Intercity <strong>Rail</strong> Capital Program,December 1, 2005 (IRCP) details the projects shown in Figure 2C.The Department expects <strong>to</strong> update this publication <strong>to</strong> include new funding sources,including the 2006 STIP and Proposition 1B bond funds by December <strong>2007</strong>.Figure 2DIntercity <strong>Rail</strong> Capital Program Funding His<strong>to</strong>ryJuly 1976 through December 2005Expended and Reserved FundsSUMMARY OF PROJECTS BY PROJECT TYPE($ in Millions)Project TypeMaintenanceRouteStationsTrack andSignaland LayoverFacilities Rolling S<strong>to</strong>ck TotalPacific Surfliner - North $ 103.8 $ 240.6$ 344.4Pacific Surfliner - South $ 143.9 $ 666.1$ 810.0Total Pacific Surfliner $ 247.7 $ 906.7$ 1,154.4San Joaquin $ 150.5 $ 392.7$ 543.2Capi<strong>to</strong>l Corridor $ 100.0 $ 196.9$ 296.9Other Routes $ 44.3 $ 24.4$ 68.7Maintenance and LayoverFacilities $ 143.8$ 143.8Rolling S<strong>to</strong>ck $ 609.6 $ 609.6Grand Total $ 542.5 $ 1,520.7 $ 143.8 $ 609.6 $ 2,816.6SUMMARY OF PROJECTS BY FUNDING SOURCE($ in Millions)Funding SourceRoute <strong>State</strong> Local Federal Amtrak <strong>Rail</strong>road Other TotalPacific Surfliner - North $ 229.5 $ 85.4 $ 25.1 $ 3.1 $ 1.3$ 344.4Pacific Surfliner - South $ 516.2 $ 104.9 $ 153.3 $ 16.1 $ 7.1 $ 12.4 $ 810.0Total Pacific Surfliner $ 745.7 $ 190.3 $ 178.4 $ 19.2 $ 8.4 $ 12.4 $ 1,154.4San Joaquin $ 395.3 $ 33.1 $ 32.7 $ 2.0 $ 78.4 $ 1.7 $ 543.2Capi<strong>to</strong>l Corridor $ 198.6 $ 51.4 $ 31.1 $ 1.2 $ 14.5 $ 0.1 $ 296.9Other Projects $ 30.3 $ 7.8 $ 21.4 $ 3.0 $ 6.2$ 68.7Maintenance and LayoverFacilities $ 80.8 $ 0.5$ 62.5$ 143.8Rolling S<strong>to</strong>ck $ 306.3$ 0.5 $ 296.5$ 6.3 $ 609.6Grand Total $ 1,757.0 $ 283.1 $ 264.1 $ 384.4 $ 107.5 $ 20.5 $ 2,816.6OUTLOOKThe intercity rail program has received significant capital funding, as is discussedabove. However, as it also mentioned above, adequate <strong>State</strong> funding is notprojected <strong>to</strong> be available <strong>to</strong> fund the unconstrained capital program presented inFigure 2A. The only ongoing and guaranteed capital funding source is the ninepercent of the ITIP that was provided by SB 45. Other major intercity rail capitalfunding sources, such as Proposition 1<strong>08</strong>, Proposition 116 and Proposition 1B29
<strong>2007</strong>-<strong>08</strong> – <strong>2017</strong>-<strong>18</strong> <strong>California</strong> <strong>State</strong> <strong>Rail</strong> <strong>Plan</strong>bond funds and TCRP funds do not provide ongoing funding. As well, fundingfrom sources such as the GF was on a project specific basis. There have been anumber of proposals on the Federal level for an ongoing intercity rail capital grantprogram, but, <strong>to</strong> date, no program has been enacted.The lack of a stable and adequate ongoing funding source for the intercity railcapital program is a major concern. It is difficult <strong>to</strong> develop long-range serviceplans that are dependent upon new equipment and capital projects when fundinglevels are uncertain. Also, it is difficult <strong>to</strong> determine the most cost-effectivecapital projects in the short-term, when the magnitude of the long-term capitalprogram is uncertain. The Department will continue <strong>to</strong> explore mechanisms for astable intercity rail capital funding source.While Proposition 1B is anticipated <strong>to</strong> provide $150 million for intercity railequipment, this amount may not be adequate <strong>to</strong> fund all equipment necessary forthe new frequencies, expansions, and new routes planned through <strong>2017</strong>-<strong>18</strong>.Stable funding for equipment acquisition remains a concern. This is becauseArticle XIX of the <strong>State</strong> Constitution does not allow rail equipment <strong>to</strong> be fundedfrom SHA funds that are generated by excise taxes on fuel. Equipment in the pasthas been funded primarily from Propositions 1<strong>08</strong> and 116 and one-time budgetappropriations from sources such as the General Fund. As there is a very limitedsupply of existing equipment that could be available for lease, new intercity railservice is dependent on the <strong>State</strong> purchasing new equipment.Additionally, existing equipment requires funding for maintenance and overhaul.To date, PTA funds have been used for this purpose. However, as existingequipment ages and new equipment is acquired, overhaul needs will increase, andadditional funds will be needed.Funding for intercity rail operations is considerably more stable than capitalfunding. The PTA, which is designed under law as a trust fund for transportationplanning and mass transportation purposes, has been the exclusive source forintercity rail operations. Under Proposition 42, enacted in March 2002, it isanticipated that the transfer of certain gasoline sales tax revenue <strong>to</strong> the PTA couldincrease PTA funding available for expansion of intercity rail operations.ROLLING STOCK PROGRAMROLLING STOCK FLEETThe <strong>State</strong> has an intercity rail rolling s<strong>to</strong>ck program unparalleled by any other statein the nation. The <strong>State</strong> owns its own fleet of 88 cars and 17 locomotives.The <strong>State</strong> has spent over $300 million on the design and acquisition of cars andlocomotives since the early 1990’s. Proposition 116, passed by the voters in 1990,provided the initial funds for the design and purchase of equipment. This fleet hasallowed significant frequency increases on all three routes.30
Chapter II – Capital ProgramIn the mid-1990s, the <strong>State</strong> designed and acquired the innovative 66-unit<strong>California</strong> Car fleet, plus nine locomotives. The cars were delivered between 1995and 1997, and the locomotives were delivered between 1994 and 1995. The carsare bi-level, with many amenities that bring a new level of comfort <strong>to</strong> passengers,and are fully compliant with the Americans with Disabilities Act (ADA).The General Mo<strong>to</strong>rs F59PHI locomotives have a maximum operating speed of110 mph, emission reduction technology, and features <strong>to</strong> improve operational andfunctional safety. Two additional General Electric Dash-8 locomotives werepurchased from Amtrak in 1994.In 2002, the <strong>State</strong> purchased and placed in service an additional 22 cars andsix locomotives. The cars were acquired as an option <strong>to</strong> Amtrak’s 40-carPacific Surfliner fleet order for Southern <strong>California</strong>. Twelve of the <strong>State</strong>-ownedcars were for Northern <strong>California</strong> operations, and ten cars were forPacific Surfliner operations. The locomotives are General Mo<strong>to</strong>rs model F59PHI.The Northern <strong>California</strong> fleet, which is used on both the San Joaquins andCapi<strong>to</strong>l Corridor, is entirely <strong>State</strong>-owned. It includes 78 cars – the original66 <strong>California</strong> cars and 12 new Pacific Surfliner cars, and 17 locomotives –15 General Mo<strong>to</strong>rs F59PHI and two General Electric Dash-8 units.The Pacific Surfliner fleet includes 50 cars and 14 locomotives. The only <strong>State</strong>ownedequipment in this fleet is ten cars.The Department is currently developing technical specifications for new cars andlocomotives for use on the three <strong>State</strong>-supported routes. The <strong>2007</strong>-<strong>08</strong> Budget Actprovides $150 million in Proposition 1B funds for rail cars. Because Amtrak doesnot have any additional equipment for use, or leased equipment that would besuitable for <strong>California</strong> intercity rail service, the Department has <strong>to</strong> procure its ownequipment in order <strong>to</strong> expand service. The Department is currently developingspecifications for new cars. While the new cars will be compatible with existingequipment, they will include federal structural requirements introduced since thepurchase of the Pacific Surfliner cars in 2002.ROLLING STOCK MAINTENANCE AND OVERHAUL PROGRAMIn addition <strong>to</strong> equipment procurement, the equipment program also includeswarranty, rework, and modification of procured equipment; scheduledmaintenance; heavy equipment overhaul; equipment modernization; inspectionand safety moni<strong>to</strong>ring; and repair of damaged equipment.In 2001-02, the Department started its heavy equipment overhaul program for itsfleet of <strong>California</strong> Cars and locomotives. Different components of the equipmentneed <strong>to</strong> be overhauled on a cyclical basis. The overhaul cycle varies from two <strong>to</strong>eight years depending on the component being serviced. The principal overhaul isat eight years and is called the mid-life overhaul. Thus, the overhaul program isongoing, and in each year different cars and components receive this service.31
<strong>2007</strong>-<strong>08</strong> – <strong>2017</strong>-<strong>18</strong> <strong>California</strong> <strong>State</strong> <strong>Rail</strong> <strong>Plan</strong>Funding for the overhaul program varies by budget year based on the specificoverhauls planned for that particular budget year. The overhaul program has beenfunded through PTA funds appropriated each year by the Budget Act. Article XIXof the <strong>State</strong> Constitution prohibits the use of SHA funds for mass transit vehicleacquisition or maintenance. Thus, SHA funds cannot be used for the overhaulprogram, nor is there any dedicated funding source for the overhaul work neededin the future as the equipment ages.In 2003-04, the Department contracted for the mid-life (eight-year) overhaul of theoriginal 66 <strong>California</strong> Cars. Design, engineering and the completion of theoverhaul and testing of the four pilot (pro<strong>to</strong>type) cars (cab, coach, foodservice andbaggage) was completed in 2004-05, and overhauls of the remainder of the fleetwill be completed by December <strong>2007</strong>. This overhaul cycle includes manymechanical components; heavy cleaning of vehicle interior including upholsteryand carpets; rebuilding and new flooring in <strong>to</strong>ilet rooms; new side door and enddoor operating systems; 110 volt convenience outlets at every seat; as well asother additions and improvements <strong>to</strong> the cars. The Department oversees andinspects the contrac<strong>to</strong>r’s overhaul work. In future years, the newer 22 cars (12 inthe Northern <strong>California</strong> fleet and ten in the Southern <strong>California</strong> fleet) will needtheir mid-life overhaul as will the remaining eight locomotives.The Department also has an overhaul program for its 17 locomotives (15 GM F59and two GE Dash-8) which includes improving locomotive fuel efficiency andemission reduction. The Environmental Protection Agency instituted emissionrequirements for diesel locomotives in 2001. ll locomotives purchased afterJanuary 1, 2001 must meet Tier 0 emission requirements. The next set ofstandards, called Tier 1, <strong>to</strong>ok effect on January 1, 2004. t requires passengerlocomotives purchase after that date emit 25 percent less nitrogen oxides (NOx)and 33 percent less particulates than previously allowed. Tier 2 standards, which<strong>to</strong>ok effect January 1, 2005, required that passenger locomotives purchased afterthat date emit 35 percent less NOx and less than half the particulates thanpreviously allowed.In early 2004, the Department completed the mid-life overhaul of the nine originalF59PHI locomotives acquired in 1994-95, which met Tier 1 standards whenpurchased. This project improved both the reliability and appearance of thelocomotives, with graphics that match the new F59PHIs. Also, the remotelocomotive health moni<strong>to</strong>ring system currently in place on the six new F59PHIlocomotives was installed on the nine locomotives in 2003-04.The two GE locomotives will be overhauled in early 20<strong>08</strong> at which time they willbe brought up <strong>to</strong> Tier 0 standards. All 15 F59 locomotives will receive Tier 2engine kits for the main engines at their next overhaul. Overhauls are scheduled <strong>to</strong>begin during the summer of 20<strong>08</strong>.32
Chapter II – Capital ProgramFigure 2E provides information on the overhaul program. For the ten-year period,it shows annual funding needs and the number of vehicles (cars and locomotives)needing overhaul. The figure includes costs and numbers of vehicles for alloverhaul cycles – the eight year mid-life cycle as well as other cycles for specificcomponents. The figure assumes that equipment purchases projected in theten-year capital plan will be made and overhaul of this equipment will beginwithin the ten-year period.Figure 2EIntercity <strong>Rail</strong> Rolling S<strong>to</strong>ck Overhaul ProgramFiscal Year($ in millions)Projected OverhaulFunding NeedsProjected Numberof Units forOverhaul2005-06 $ 13.8 482006-07 $ 14.4 52<strong>2007</strong>-<strong>08</strong> $ 13.8 6620<strong>08</strong>-09 $ 9.3 432009-10 $ 13.2 362010-11 $ 12.7 722011-12 $ 13.5 532012-13 $ 13.8 582013-14 $ 14.1 642014-15 $ 14.5 662015-16 $ 16.5 74RAIL-HIGHWAY GRADE CROSSING IMPROVEMENT ANDSEPARATION PROGRAMSThe Department has a number of programs <strong>to</strong> improve safety at rail-highwaygrade crossings as well as improve rail and road operations. Locations where arailroad track and a street or road cross each other at separate grades are calledrail-highway grade separations. The <strong>State</strong> Section 190 Program focuses onconstructing grade separations Locations where a railroad track and a street orroad cross each other at the same grade are called rail-highway grade crossings.The Federal Section 1010/1103 Program and the Federal Section 130 Programfocus on improving safety and operations at grade crossings. These programscombined receive approximately $35 million a year in funds. Additionally,Proposition 1B includes $250 million for high-priority grade separation andrailroad crossing safety improvements.33
<strong>2007</strong>-<strong>08</strong> – <strong>2017</strong>-<strong>18</strong> <strong>California</strong> <strong>State</strong> <strong>Rail</strong> <strong>Plan</strong>STATE SECTION 190 GRADE SEPARATION PROGRAMThe Section 190 Grade Separation Program is a <strong>State</strong>-funded safety program thatprovides for the elimination of existing at-grade railroad crossings. Most projectsfunded under this program are grade separations. However, consolidations ortrack removal projects that eliminate grade crossings can also be considered.Eligible projects are identified on the basis of the priority list established by theCPUC. This list is developed every two years, and becomes effective in July ofeven numbered years. Local agencies, railroad companies or the Department cannominate projects. Nominated projects are prioritized on the basis of a formulathat incorporates such fac<strong>to</strong>rs as traffic volumes (both roadway and railroad),projected <strong>State</strong> contribution, accident his<strong>to</strong>ry, and physical conditions at thecrossing <strong>to</strong> be eliminated.Once the CPUC list has been established, the Department administers theprogram. The annual amount of <strong>State</strong> funding for the program is $15 million, witha maximum amount of $5 million annually per project. In general, the <strong>State</strong>contribution for any one project is limited <strong>to</strong> 80 percent or $5 million, whicheveris less, of the project cost if the grade crossing <strong>to</strong> be eliminated has been inexistence for at least ten years prior <strong>to</strong> the date of allocation of the funds.The railroad must contribute a minimum of ten percent of the <strong>to</strong>tal cost of theproject, and the lead agency must cover the rest. (Note: if the lead agency elects <strong>to</strong>use Federal funding for a portion of the project, the railroad contribution is subject<strong>to</strong> statu<strong>to</strong>ry requirements which may reduce the railroad contribution <strong>to</strong>five percent).The <strong>to</strong>tal project cost includes design, right-of-way (ROW) acquisition, utilityrelocation, and environmental clearance. In addition, it includes all constructionelements (structures, approaches, ramps, connections, drainage, etc.) required <strong>to</strong>make the grade separation operable.Requests for allocations are due <strong>to</strong> the Department on April 1 of each fiscal year.Within the limits of available funding, allocations are made by the Department,pursuant <strong>to</strong> a delegation from the <strong>California</strong> Transportation Commission, inpriority order for all projects that meet the requirements. If a project only receivesa partial allocation because of limited funding, it will be au<strong>to</strong>matically eligible forthe balance of its funding in the following fiscal year. Projects that do not receivean allocation within the two-year life of the CPUC priority list must berenominated in order <strong>to</strong> remain eligible. Grade separation projects are alsoeligible for STIP funding.PROPOSITION 1B HIGHWAY-RAILROAD CROSSING PROGRAMProposition 1B includes $250 million for high-priority grade separation andrailroad crossing safety improvements from the new Highway-<strong>Rail</strong>road CrossingSafety Account. One hundred and fifty million dollars of these funds will34
Chapter II – Capital Programsupplement the existing Section 190 Grade Separation Program. However, adollar for dollar match will be required for these funds (unlike the existing Section190 Program). One hundred million dollars of the funds will be used for highprioritygrade crossings. The <strong>2007</strong>-<strong>08</strong> Budget Act includes $122.5 million for theHighway-<strong>Rail</strong>road Crossing Safety Account.FEDERAL SECTION 130 CROSSING IMPROVEMENT PROGRAMSection 14036.4 of the Government Code requires the Department <strong>to</strong> report on theamount of funds available <strong>to</strong> the <strong>State</strong> under the Federal rail-highway crossingprogram (23 U.S.C. 130), including the cash balance, funds encumbered duringthe last year, and amounts anticipated <strong>to</strong> be received during the subsequent year.This information is included in Figure 2F.Prior <strong>to</strong> Federal Fiscal Year (FFY) 2005-06, the Federal Section 130 Programprovided about $10.2 million per year in Federal highway funds for grade crossingsafety projects. Beginning in FFY 2005-06 however, additional funds were madeavailable. Pursuant <strong>to</strong> the Safe, Accountable, Flexible, Efficient TransportationEquity Act: a Legacy for Users (SAFETEA-LU), this amount increased <strong>to</strong>$16.2 million. The Department supplements this program each year with otherFederal funds <strong>to</strong> pay for grade crossing improvements on <strong>State</strong> routes. With thesupplemental Federal funds, the <strong>to</strong>tal statewide financial commitment <strong>to</strong> gradecrossing improvements will range from about $19 million <strong>to</strong> $21 million per year,with $16 million allocated <strong>to</strong> projects <strong>to</strong> eliminate hazards at rail crossings onlocal streets and roads and the balance ($3 <strong>to</strong> $5 million) allocated <strong>to</strong> projects on<strong>State</strong> routes. Improvements include any treatment contained in the <strong>California</strong>Manual for Uniform Traffic Control Devices as determined by an engineeringstudy at sites where data show a high hazard index.Figure 2FSection 130 Federal Crossing Improvement Program Funding StatusFederal Fiscal Year 2006-07 – <strong>2007</strong>-<strong>08</strong>($ in thousands)Obligated/Encumbered2006-07 Entitlement Expected in <strong>2007</strong>-<strong>08</strong>Cash Balance 10/1/07(Includes priorentitlements)$12,500 $16,000 $16,000 $29,128Based on available funds, the Department selects projects from the prioritiesidentified by the data for inclusion in the Section 130 Program Funding <strong>Plan</strong>programmed in the Federal STIP. Under Federal law, the annual grade crossingimprovement program must be included in the Federal TransportationImprovement Programs (FTIPs) of the appropriate Metropolitan <strong>Plan</strong>ningOrganizations and the statewide FSTIP prior <strong>to</strong> obligation of funding.35
<strong>2007</strong>-<strong>08</strong> – <strong>2017</strong>-<strong>18</strong> <strong>California</strong> <strong>State</strong> <strong>Rail</strong> <strong>Plan</strong>The Department administers Section 130 funding for projects involving railroadcrossings of both <strong>State</strong> highways and local streets and roads. Program staffdevelops the financing for the construction of eligible projects; ensures thatFederal and <strong>State</strong> law, policies, practices and standards are observed; issuesagreements <strong>to</strong> railroad companies and local agencies; provides follow-up onproject delivery for grade crossing projects; and moni<strong>to</strong>rs Section 130expenditures.FEDERAL SECTION 1010/1103(C) RAILWAY-HIGHWAY CROSSINGHAZARD ELIMINATION IN HIGH SPEED RAIL CORRIDORSPROGRAMSection 1010 of the Intermodal Surface Transportation Efficiency Act (ISTEA)(23 U.S.C. 104(d)), which was enacted in 1991, provides $5 million per year forelimination of hazards at railway-highway crossings. When ISTEA wasreauthorized in 1998 as the Transportation Efficiency Act for the 21st Century, orTEA-21, Section 1010 was revised as Section 1103(c). In order for rail corridors<strong>to</strong> be eligible <strong>to</strong> compete for Section 1010 funding, they must include rail lineswhere railroad speeds of 90 mph are occurring or can reasonably be expected <strong>to</strong>occur in the future. <strong>California</strong>’s existing <strong>State</strong>-supported intercity passenger railroutes, plus the Coast Route between San Jose and San Luis Obispo, <strong>to</strong>gethercomprise one of the nationally designated corridors eligible <strong>to</strong> compete for theSection 1010 funding. Since FY 1992-93, the Department has received$6.3 million in Federal funds from the program. The Department uses theSection 1010 funds for improvements in signaling at grade crossings, private gradecrossing closures, and other grade crossing safety improvements.STATION PROGRAMSPARKING FACILITIES AT INTERCITY RAIL STATIONSSection 14036.2 of the Government Code requires the identification of those railpassenger stations which require upgraded parking facilities <strong>to</strong> encourageau<strong>to</strong>mobile drivers <strong>to</strong> utilize available rail passenger service. Below is adescription of the status of parking facilities at stations on the three intercitypassenger rail routes.Much progress has been made, and continues <strong>to</strong> be made, in providing additionalparking at stations on the San Joaquin Route. Projects were completed inconjunction with the construction of new stations at Modes<strong>to</strong> in 1999, Bakersfieldand Merced in 2000, and Martinez in 2001. A new parking structure wascompleted at Lodi in 2002. A new station was completed at Wasco in 2006 with36 parking spaces. At Fresno, parking improvements include new paving andsecurity fencing.36
Chapter II – Capital ProgramA number of parking projects are now planned for San Joaquin stations. For theEmeryville station, funds are programmed <strong>to</strong> construct a 337-space parkinggarage. For the Richmond station, funds have been allocated <strong>to</strong> design a new800-space parking garage. For the Martinez station, funds are programmed <strong>to</strong>acquire land for additional parking. At the Sacramen<strong>to</strong> station, a project started inthe spring 2005 <strong>to</strong> upgrade surface parking lots, au<strong>to</strong> and bus circulation, andsecurity and lighting continues. An additional 20-35 parking places are underconstruction. Light rail service <strong>to</strong> the Amtrak station is provided by an extension<strong>to</strong> the Sacramen<strong>to</strong> system. Service was initiated in December, 2006.On the Pacific Surfliners progress has also been made in adding parking.At existing stations, additional parking was completed in 2000 in Santa Ana, andin 2001 at San Luis Obispo. The Surf station, opened in 2000, included parking.The Camarillo station project, including parking improvements, was completed in2006. At the Fuller<strong>to</strong>n station, a multi-level parking structure is underdevelopment. At Irvine, funds are reserved <strong>to</strong> construct a parking structure at thestation. At the Oceanside station, a 450-space parking structure was completed in2006, and at Oxnard preliminary work on an additional 95 parking spaces isunderway.On the Capi<strong>to</strong>l Corridor, significant additional parking capacity has also beenadded in the recent past <strong>to</strong> meet growing ridership. A satellite parking facility ofabout 80 spaces was constructed at the Roseville station in summer 2004.The interim parking lot at the Rocklin station was replaced in fall 2004 with70 permanent parking spaces and an improved access road. A new parking lotwith over 100 spaces and an improved access road were constructed at theSanta Clara/Great America station in summer 2004. At the Auburn station, thesecond phase of parking (about 50 spaces) was added in summer 2005. While theprimary upgrades at the Berkeley station that were completed in August 2005focused on a new platform and landscaping, the project also includes improvedaccess for transit and parking. The new Oakland Coliseum station opened inJune 2005 and includes parking as well as connections <strong>to</strong> Bay Area Rapid Transit(BART) and the Oakland International Airport. Funds are also programmed for asecond parking lot at the Fremont-Centerville station.DECREPIT STATIONSSection 14036.2 of the Government Code requires the identification of the threemost decrepit intercity rail passenger stations in the <strong>State</strong> used by Amtrak operatedtrains. Webster’s New World Dictionary, Third College Edition, copyright 1988,defines decrepit as "broken down or worn out by old age or long use.”The following stations are those identified by the Department as the three mostdecrepit:37
<strong>2007</strong>-<strong>08</strong> – <strong>2017</strong>-<strong>18</strong> <strong>California</strong> <strong>State</strong> <strong>Rail</strong> <strong>Plan</strong>Madera (Avenue 15½ at 29th Road): This station serves the San Joaquins and isin a residential-industrial area. It is unattractive, and the shelter has been removed.There is no landscaping at the station. The parking lot is paved but deterioratedwith many potholes, and a number of the lights are broken. Representatives of theCity, County, Amtrak and the Department are planning <strong>to</strong> move the station <strong>to</strong> anew location that is adjacent <strong>to</strong> a major road serving Madera’s population center.The project will include purchase of ROW, construction of a two-lane access road,a new parking lot, platform, and shelter for the new station. The project is plannedfor completion in 20<strong>08</strong>-09. In FY 2005-06 a <strong>to</strong>tal of 13,239 passengers used thestation.Dunsmuir (5750 Sacramen<strong>to</strong> Avenue): This station serves Amtrak’sCoast Starlight. The premises are very old and dilapidated with poor passengeramenities. The exterior has deteriorated paint and brickwork and the interiorwaiting room is sparsely furnished. Heating facilities are minimal. The parkinglot is also in a deteriorated state. In FY 2005-06 there were 4,2<strong>18</strong> passengersusing the Dunsmuir station.Salinas (Foot of Station Place): This station is also on the Coast Starlight Route.While the station exterior is adequate, the interior of the station is a marked stateof disrepair. There are broken tiles and peeling paint. Restrooms are in adegraded state, with missing and broken <strong>to</strong>ilets. Security when the station is notstaffed is also an issue. Pedestrians often cross the tracks in proximity <strong>to</strong> thestation which is a safety and security issue as well. In FY 2005-06 a <strong>to</strong>tal of27,586 passengers used this station.38
Chapter III – Operations ProgramCHAPTER IIIOPERATIONS PROGRAMThis chapter describes the <strong>State</strong>’s intercity rail operations program. First, 10-yearridership and service levels and the 10-year operations financial plan (revenue,expenses, and farebox ratio) are presented. Then the Department’s past progressin meeting these goals is assessed. Finally, the operations program is discussed,including the following five components: operational efficiency, passengeramenities, emerging technologies, connecting Amtrak bus services, andmultimodal connectivity including airport access.OPERATIONS PROGRAM GOALSThe Department’s goals for its Operations Program are:1. Provide cost-effective, operationally efficient service that meets or exceedsthe Department’s 50 percent farebox ratio standard. (Furtherance of thethree goals below will increase revenues and reduce costs, with theresulting increase in farebox ratio.)2. Improve service access and attractiveness by making the service morepassenger friendly with amenities such as on-line ticket reservations andpayment, improved real-time passenger information and notification, andon-board internet access.3. Provide safe, reliable, and convenient intercity rail and connecting Amtrakbus service with frequent service during business hours, and travel optionsduring evenings and weekends.4. Create “seamless” multimodal connectivity between intercity rail servicesand commuter/urban rail, transit, and airports with convenient connections<strong>to</strong> all major urban, and many <strong>to</strong>urist and rural destinations.TEN-YEAR INTERCITY RAIL SERVICE LEVELS ANDOPERATIONS FINANCIAL PLANFigure 3A presents the Department’s 10-year projected intercity passenger railridership and service levels (as well as actual ridership and service levels for2005-06 and 2006-07). The Department developed the service levels for thePacific Surfliners and San Joaquins. In conjunction with the Capi<strong>to</strong>l CorridorJoint Powers Authority (CCJPA), the Department also developed the Capi<strong>to</strong>lCorridor service levels. The Department is proposing the service levels for routeextensions and new routes. The ridership estimates for the three existing routeswere developed in conjunction with Amtrak and with the use of the <strong>Rail</strong>Ridership/Revenue Forecasting Model. The ridership levels are conservative with39
<strong>2007</strong>-<strong>08</strong> – <strong>2017</strong>-<strong>18</strong> <strong>California</strong> <strong>State</strong> <strong>Rail</strong> <strong>Plan</strong>growth primarily projected <strong>to</strong> be the result of general population increases, andnew frequencies.Figure 3A shows that in <strong>2017</strong>-<strong>18</strong>, combined ridership on the three routes isprojected <strong>to</strong> be 8.3 million, an increase of 67 percent over 2006-07 ridership.Projected service frequencies are: 13 San Diego-Los Angeles round-trips on thePacific Surfliner, eight round-trips on the San Joaquins, and <strong>18</strong> Oakland-Sacramen<strong>to</strong> round-trips on the Capi<strong>to</strong>l Corridor.In the development of increased service levels, service extensions, and newservices, the Department considers the following:• Ridership demand based on actual train ridership, or in the case ofextensions or new routes, based on bus ridership and overall travel demandin the corridor.• Potential <strong>to</strong> improve cost-effectiveness of existing services, and positivecost-effectiveness of new routes.• Feasibility of increased service based on route capacity, equipmentavailability, and infrastructure quality.• Local support for the service.It is important <strong>to</strong> note that implementation is subject <strong>to</strong> demonstrated ridershipdemand, approval from Amtrak and the relevant railroad(s), availability ofoperating and capital funding and equipment, and completion of necessary capitalprojects. The service expansions are described in more detail in later chapters.Chapters VI, VII, and VIII describe the increased frequencies and serviceexpansions for each route. Chapter X describes the new routes the Department isrecommending.Figure 3B summarizes the ten-year operations financial plan. Figure 3B presents:revenue, expense and farebox ratio for existing routes; and projected <strong>State</strong> costsfor existing and new routes for the ten-year period from 20<strong>08</strong>-09 through <strong>2017</strong>-<strong>18</strong>.This data was developed by the Department in conjunction with Amtrak based onthe Department’s service levels shown in Figure 3A. The Figure also shows actualand projected costs for the Department’s heavy equipment overhaul program, aswell as actual data for 2005-06 and 2006-07 and current data for <strong>2007</strong>-<strong>08</strong>.Figure 3B shows in <strong>2017</strong>-<strong>18</strong> the farebox ratio on the Pacific Surfliners is projected<strong>to</strong> be 68.2 percent, on the San Joaquins 52.3 percent and on the Capi<strong>to</strong>l Corridor46.1 percent. <strong>State</strong> costs for the three existing routes are projected <strong>to</strong> be$156.6 million, and for new routes, $20.3 million.Figure 3C shows in graph form the projected trend of the three key performancemeasures (ridership, revenue and farebox ratio) on each route. These performancemeasures are projected <strong>to</strong> improve on all three routes over the ten-year period.40
Chapter III – Operations ProgramFigure 3D shows in graph form the <strong>State</strong> cost per passenger, per passenger mileand per train mile for each of the three <strong>State</strong>-supported routes over the ten-yearperiod. By the end of the period <strong>State</strong>-cost per passenger mile is projected <strong>to</strong>decrease slightly on all three routes. The cost per passenger is projected <strong>to</strong> behighest on the San Joaquins because the average trip length per passenger on thisRoute is the longest of the three routes. The <strong>State</strong> cost per passenger mile and pertrain mile is projected <strong>to</strong> remain relatively stable on the Pacific Surfliners, andshow some fluctuation on the other two routes related <strong>to</strong> new frequencies.PROGRESS IN MEETING ROUTE OBJECTIVESFigure 3E assesses the Department’s progress in meeting its principal routeobjectives. First, the Figure assesses the Department’s success in meeting thegoals established in the previous 2005-06 <strong>to</strong> 2015-16 Sate <strong>Rail</strong> <strong>Plan</strong>. To do so, theFigure compares the route objectives in the 2005-06 <strong>Plan</strong> for the 2006-07 yearwith actual results. In general, the ridership and farebox ratio goals for 2006-07and actual results were consistent. Actual revenue on all three routes was higherthan projected. Actual OTP on all three routes was below projected OTP,primarily as the result of increased freight traffic. On the Capi<strong>to</strong>l Corridor,four additional Oakland-Sacramen<strong>to</strong> trains were projected for <strong>2007</strong>-<strong>08</strong> thatactually started earlier in 2006-07.Next, the Figure compares the difference in the long-term goals between the2005-06 and <strong>2007</strong>-<strong>08</strong> <strong>Rail</strong> <strong>Plan</strong> by comparing the route objectives for 2015-16presented in the 2005-06 <strong>California</strong> <strong>State</strong> <strong>Rail</strong> <strong>Plan</strong> with those in the current<strong>2007</strong>-<strong>08</strong> <strong>California</strong> <strong>State</strong> <strong>Rail</strong> <strong>Plan</strong>. These objectives are very similar. On thePacific Surfliner Route the same level of service is projected. On the San JoaquinRoute, the same level of service is projected, except in the current <strong>Plan</strong>, tworound-trip Oakland-S<strong>to</strong>ck<strong>to</strong>n trips are projected. And on the Capi<strong>to</strong>l Corridor,three more Oakland <strong>to</strong> San Jose round-trips and two more Sacramen<strong>to</strong>-Rosevilleround-trips were projected in the 2005-06 <strong>Plan</strong> as compared <strong>to</strong> the <strong>2007</strong>-<strong>08</strong> <strong>Plan</strong>.Finally, the goals for the last year of the <strong>2007</strong>-<strong>08</strong> <strong>to</strong> <strong>2017</strong>-<strong>18</strong> <strong>Rail</strong> <strong>Plan</strong> arepresented.41
<strong>2007</strong>-<strong>08</strong> - <strong>2017</strong>-<strong>18</strong> <strong>California</strong> <strong>State</strong> <strong>Rail</strong> <strong>Plan</strong>Figure 3AINTERCITY RAIL RIDERSHIP AND SERVICE LEVELSFederal Fiscal Years 2005-06 - <strong>2017</strong>-<strong>18</strong>Actual Current Budget Projected2004-05 2005-06 2006-07 <strong>2007</strong>-<strong>08</strong> 20<strong>08</strong>-09 2009-10 2010-11 2011-12 2012-13 2013-14 2014-15 2015-16 2016-17 <strong>2017</strong>-<strong>18</strong>RIDERSHIP (thousands) #Pacific Surfliners (<strong>to</strong>tal) 2,454 2,655 2,707 2,773 2,846 2,920 2,992 3,113 3,<strong>18</strong>4 3,574 3,837 3,914 3,989 4,061San Joaquins 743 801 805 825 852 880 909 1,058 1,092 1,127 1,163 1,200 1,388 1,432Capi<strong>to</strong>l Corridor 1,239 1,270 1,450 1,483 1,525 1,567 1,609 1,885 1,933 2,175 2,402 2,458 2,533 2,759Total Ridership 4,436 4,726 4,962 5,<strong>08</strong>1 5,223 5,367 5,510 6,056 6,209 6,876 7,402 7,572 7,910 8,252FREQUENCIESPacific Surfliners (<strong>to</strong>tal)San Diego-Los Angeles 11 11 11 11 11 11 11 12 12 12 13 13 13 13Los Angeles-Goleta 5 5 5 5 5 5 5 5 5 6 6 6 6 6Goleta-San Luis Obispo 2 2 2 2 2 2 2 2 2 3 3 3 3 3Total 11 11 11 11 11 11 11 12 12 12 13 13 13 13San JoaquinsOakland-Bakersfield 4 4 4 4 4 4 4 4 4 4 5 5 5 5Sacramen<strong>to</strong>-Bakersfield 2 2 2 2 2 2 2 3 3 3 3 3 3 3Oakland-S<strong>to</strong>ck<strong>to</strong>n 2 2 2 2 2 2 2Total 6 6 6 6 6 6 6 7 7 7 8 8 8 8Capi<strong>to</strong>l CorridorSan Jose-Oakland 4 4 7 7 7 7 7 11 11 11 13 13 13 16Oakland-Sacramen<strong>to</strong> 12 12 16 16 16 16 16 16 16 <strong>18</strong> <strong>18</strong> <strong>18</strong> <strong>18</strong> <strong>18</strong>Sacramen<strong>to</strong>-Roseville 1 1 1 1 1 1 1 4 4 4 6 6 8 10Roseville-Auburn 1 1 1 1 1 1 1 2 2 2 4 4 4 4Total 12 12 16 16 16 16 16 16 16 <strong>18</strong> <strong>18</strong> <strong>18</strong> <strong>18</strong> <strong>18</strong>Route Extensions/New RoutesSan Francisco-San Luis Obispo 1 1 1 2 2 2 2 2Sacramen<strong>to</strong>-Reno 1 1 2 2Sacramen<strong>to</strong>-Redding 1 1 1# - Does not include ridership for route extensions, only included is ridership for existing and additional frequencies.42
Chapter III - Operations ProgramFigure 3BINTERCITY RAIL OPERATING FINANCIAL PLANFederal Fiscal Years 2004-05 - <strong>2017</strong>-<strong>18</strong>(Dollars in Millions)Actual Current • Budget Projected2004-05 2005-06 2006-07 <strong>2007</strong>-<strong>08</strong> 20<strong>08</strong>-09 2009-10 2010-11 2011-12 2012-13 2013-14 2014-15 2015-16 2016-17 <strong>2017</strong>-<strong>18</strong>REVENUESPacific Surfliners § $ 26.7 $ 32.6 $ 34.5 $ 36.1 $ 37.6 $ 39.4 $ 41.3 $ 44.1 $ 46.1 $ 53.4 $ 58.9 $ 61.6 $ 64.2 $ 67.0San Joaquins $ 22.6 $ 26.5 $ 26.5 $ 29.0 $ 28.8 $ 30.4 $ 32.0 $ 38.6 $ 40.6 $ 42.7 $ 45.0 $ 47.3 $ 56.5 $ 59.4Capi<strong>to</strong>l Corridor $ 14.8 $ 15.7 $ <strong>18</strong>.8 $ 20.7 $ 20.5 $ 21.5 $ 22.6 $ 27.3 $ 28.6 $ 33.1 $ 37.5 $ 39.1 $ 41.5 $ 46.0Total Revenues $ 64.1 $ 74.8 $ 79.8 $ 85.8 $ 86.9 $ 91.3 $ 95.9 $ 110.0 $ 115.3 $ 129.2 $ 141.4 $ 148.0 $ 162.2 $ 172.4EXPENSESPacific Surfliners § $ 48.1 $ 57.8 $ 55.9 $ 58.7 $ 60.3 $ 62.7 $ 64.0 $ 67.5 $ 69.5 $ 81.6 $ 89.9 $ 92.6 $ 95.4 $ 98.3San Joaquins $ 49.9 $ 58.2 $ 57.2 $ 61.0 $ 61.3 $ 63.1 $ 65.0 $ 83.4 $ 85.9 $ 88.5 $ 91.2 $ 93.9 $ 110.2 $ 113.5Capi<strong>to</strong>l Corridor $ 39.2 $ 38.8 $ 47.0 $ 44.4 $ 52.6 $ 54.2 $ 55.8 $ 65.7 $ 67.7 $ 76.5 $ 85.0 $ 87.6 $ 91.6 $ 99.7Total Expenses $ 137.2 $ 154.8 $ 160.1 $ 164.1 $ 174.2 $ <strong>18</strong>0.0 $ <strong>18</strong>4.8 $ 216.6 $ 223.1 $ 246.6 $ 266.1 $ 274.1 $ 297.2 $ 311.5FAREBOX RATIOPacific Surfliners § 55.5% 56.4% 61.7% 61.5% 62.4% 62.8% 64.5% 65.3% 66.3% 65.4% 65.5% 66.5% 67.3% 68.2%San Joaquins 45.3% 45.5% 46.3% 47.5% 47.0% 48.2% 49.2% 46.3% 47.3% 48.2% 49.3% 50.4% 51.3% 52.3%Capi<strong>to</strong>l Corridor 37.8% 40.5% 40.0% 46.6% 39.0% 39.7% 40.5% 41.6% 42.2% 43.3% 44.1% 44.6% 45.3% 46.1%STATE COSTS *Existing RoutesPacific Surfliners § $ 21.4 $ 21.9 $ 22.1 $ 23.1 $ 23.1 $ 23.1 $ 23.1 $ 23.8 $ 23.8 $ 28.6 $ 31.5 $ 31.5 $ 31.6 $ 31.8San Joaquins $ 27.3 $ 27.6 $ 27.4 $ 32.5 $ 32.9 $ 33.2 $ 33.4 $ 45.3 $ 45.8 $ 46.2 $ 46.7 $ 47.1 $ 54.2 $ 54.6Capi<strong>to</strong>l Corridor $ 24.4 $ 23.6 $ 23.6 $ 24.1 $ 32.6 $ 33.1 $ 33.7 $ 38.8 $ 39.5 $ 43.9 $ 48.0 $ 48.9 $ 50.5 $ 54.2Sub Total $ 73.1 $ 73.1 $ 73.1 $ 79.7 $ 88.6 $ 89.4 $ 90.2 $ 107.9 $ 109.1 $ 1<strong>18</strong>.7 $ 126.2 $ 127.5 $ 136.3 $ 140.6Equipment-Heavy Overhaul $ 13.5 $ 13.8 $ 14.0 $ 13.8 $ 9.3 $ 13.1 $ 12.6 $ 13.6 $ 14.6 $ 15.6 $ 16.0 $ 16.0 $ 16.0 $ 16.0Total $ 86.6 $ 86.9 $ 87.1 $ 93.5 $ 97.9 $ 102.5 $ 102.8 $ 121.5 $ 123.7 $ 134.3 $ 142.2 $ 143.5 $ 152.3 $ 156.6Route Extensions and New RoutesSan Francisco-San Luis Obispo $ 4.6 $ 5.1 $ 5.1 $ 10.3 $ 10.4 $ 10.5 $ 10.6 $ 10.7Sacramen<strong>to</strong>-Reno $ 3.1 $ 3.1 $ 6.3 $ 6.3Sacramen<strong>to</strong>-Redding $ 3.3 $ 3.3 $ 3.3Total $ 4.6 $ 5.1 $ 5.1 $ 10.3 $ 13.5 $ 16.9 $ 20.2 $ 20.3Existing and New RoutesGrand Total $ 86.6 $ 86.9 $ 87.1 $ 93.5 $ 97.9 $ 102.5 $ 107.4 $ 126.6 $ 128.8 $ 144.6 $ 155.7 $ 160.4 $ 172.5 $ 176.9• - 2006-07 revenues and expenses are partial year actual and projected for the remainder of the year.# - Expenses do not include equipment lease costs, as all new equpment will be <strong>State</strong> owned.* - Reflects operating contract maximum from 2004-05 through 2006-07. In all years, includes payment <strong>to</strong> Amtrak for minor capital projects not included in any other line item.§ - Reflects Revenues, Expenses, Farebox Ratio and <strong>State</strong> Costs for state supported portion of the service.43
<strong>2007</strong>-<strong>08</strong> – <strong>2017</strong>-<strong>18</strong> <strong>California</strong> <strong>State</strong> <strong>Rail</strong> <strong>Plan</strong>Figure 3CPerformance by RouteRidership5,000,0004,000,000Actual ResultsProjected in <strong>2007</strong>-<strong>08</strong> <strong>California</strong> <strong>State</strong> <strong>Rail</strong> <strong>Plan</strong>3,000,0002,000,0001,000,000-Farebox Ratio80%70%60%50%40%30%20%10%0%Actual ResultsProjected in <strong>2007</strong>-<strong>08</strong> <strong>California</strong> <strong>State</strong> <strong>Rail</strong> <strong>Plan</strong>2000-012001-022002-032003-042004-052005-062006-07<strong>2007</strong>-<strong>08</strong>20<strong>08</strong>-092009-102010-112011-122012-132013-142014-152015-162016-17<strong>2017</strong>-<strong>18</strong>2000-012001-022002-032003-042004-052005-062006-07<strong>2007</strong>-<strong>08</strong>20<strong>08</strong>-092009-102010-112011-122012-132013-142014-152015-162016-17<strong>2017</strong>-<strong>18</strong>Revenue(in Millions)$80$70$60$50$40$30$20$10$-Actual ResultsProjected in <strong>2007</strong>-<strong>08</strong> <strong>California</strong> <strong>State</strong> <strong>Rail</strong> <strong>Plan</strong>2000-012001-022002-032003-042004-052005-062006-07<strong>2007</strong>-<strong>08</strong>20<strong>08</strong>-092009-102010-112011-122012-132013-142014-152015-162016-17<strong>2017</strong>-<strong>18</strong>Pacific Surfliner Route - <strong>State</strong> Supported Portion San Joaquin Route Capi<strong>to</strong>l Corridor44
Chapter III – Operations ProgramFigure 3D<strong>State</strong> Costs by Route<strong>State</strong> Cost Per Passenger$50$40$30$20$10$-Actual ResultsProjected in <strong>2007</strong>-<strong>08</strong> <strong>California</strong> <strong>State</strong> <strong>Rail</strong> <strong>Plan</strong>2000-012001-022002-032003-042004-052005-062006-07<strong>2007</strong>-<strong>08</strong>20<strong>08</strong>-092009-102010-112011-122012-132013-142014-152015-162016-17<strong>2017</strong>-<strong>18</strong><strong>State</strong> Cost Per Passenger Mile$0.35$0.30$0.25$0.20$0.15$0.10$0.05$-Actual ResultsProjected in <strong>2007</strong>-<strong>08</strong> <strong>California</strong> <strong>State</strong> <strong>Rail</strong> <strong>Plan</strong>2000-012001-022002-032003-042004-052005-062006-07<strong>2007</strong>-<strong>08</strong>20<strong>08</strong>-092009-102010-112011-122012-132013-142014-152015-162016-17<strong>2017</strong>-<strong>18</strong><strong>State</strong> Cost Per Train Mile$35$30$25$20$15$10$-$5Actual ResultsProjected in <strong>2007</strong>-<strong>08</strong> <strong>California</strong> <strong>State</strong> <strong>Rail</strong> <strong>Plan</strong>2000-012001-022002-032003-042004-052005-062006-07<strong>2007</strong>-<strong>08</strong>20<strong>08</strong>-092009-102010-112011-122012-132013-142014-152015-162016-17<strong>2017</strong>-<strong>18</strong>Pacific Surfliner Route - <strong>State</strong> Supported Portion San Joaquin Route Capi<strong>to</strong>l Corridor45
<strong>2007</strong>-<strong>08</strong> – <strong>2017</strong>-<strong>18</strong> <strong>California</strong> <strong>State</strong> <strong>Rail</strong> <strong>Plan</strong>Figure 3ERidership(thousands)Revenue(millions)ROUTE OBJECTIVES BY CORRIDORFFY2005-06<strong>Rail</strong> <strong>Plan</strong>2006-07 2015-16 <strong>2017</strong>-<strong>18</strong>ActualResults2005-06<strong>Rail</strong> <strong>Plan</strong>Pacific Surfliner Route<strong>2007</strong>-<strong>08</strong><strong>Rail</strong> <strong>Plan</strong><strong>2007</strong>-<strong>08</strong><strong>Rail</strong> <strong>Plan</strong>2,637 2,707 3,611 3,914 4,061$29.4 $34.5 $45.4 $61.6 $67.0Farebox Ratio 59.8% 61.7% 65.0% 66.5% 68.2%On TimePerformance82% 74.8% 90% 90% 90%Frequency:Los Angeles- 11 11 13 13 13San DiegoLos Angeles-Goleta5 5 6 6 6San Joaquin RouteRidership(thousands)Revenue(millions)791 805 1,133 1,200 1,432$25.0 $26.5 $40.7 $47.3 $59.4Farebox Ratio 47.4% 46.3% 49.1% 50.4% 52.3%On TimePerformance75% 67.9% 90% 90% 90%Frequency:Oakland-4 4 5 5 5BakersfieldSacramen<strong>to</strong>-Bakersfield 2 2 3 3 3Ridership(thousands)Revenue(millions)Capi<strong>to</strong>l Corridor1,429 1,450 2,483 2,458 2,759$16.9 $<strong>18</strong>.8 $29.8 $39.1 $46.0Farebox Ratio 38.9% 40.0% 44.6% 44.6% 46.1%On TimePerformance90% 74.6% 90% 90% 90%Frequency:Sacramen<strong>to</strong>- 12 16 <strong>18</strong> <strong>18</strong> <strong>18</strong>OaklandOakland-San Jose7 7 16 13 1646
Chapter III – Operations ProgramADMINISTRATION AND MARKETING COSTSFigure 3F shows <strong>State</strong> support levels for administration and marketing costs for2005-06 through <strong>2007</strong>-<strong>08</strong>. These costs have remained constant over the three-yearperiod.Figure 3FIntercity <strong>Rail</strong> Administration and Marketing Costs($ in Millions)ActualCurrentFFY 2005-06 2006-07 <strong>2007</strong>-<strong>08</strong>STATE SUPPORTPacific SurflinersAdministration $1.5 $1.5 $1.5Marketing $2.3 $2.3 $2.3Totals $3.8 $3.8 $3.8San JoaquinsAdministration $1.3 $1.3 $1.3Marketing $1.5 $1.5 $1.5Totals $2.8 $2.8 $2.8Capi<strong>to</strong>l CorridorAdministration $1.3 $1.3 $1.3Marketing $1.2 $1.2 $1.2Totals $2.5 $2.5 $2.5Totals - All RoutesAdministration $4.1 $4.1 $4.1Marketing $5.0 $5.0 $5.0Grand Total $9.1 $9.1 $9.1OPERATIONS PROGRAMThe Department manages the Operations Program for the Pacific Surfliner andSan Joaquin Routes, while the CCJPA manages Operations for theCapi<strong>to</strong>l Corridor. However, there is coordination between the Department and theCCJPA concerning operations. This Section primarily discusses the Department’sProgram. The CCJPA’s Program can be found in Chapter VIII,The Capi<strong>to</strong>l Corridor. While the Department’s operations, marketing and capitalprograms are all interrelated, the operations program is focused on operationalefficiency, passenger amenities, emerging technologies, connecting Amtrak busservices, and multimodal connectivity. Each of these areas is discussed below.Also, the Department’s 10-year operations goals for the Pacific Surfliner andSan Joaquin Routes are presented in Chapters VI and VII.OPERATIONAL EFFICIENCYImprovements in operational efficiency are heavily dependent on theimplementation of the 10-year capital improvement program discussed inChapter II. For example, double and triple track improvement projects increase47
<strong>2007</strong>-<strong>08</strong> – <strong>2017</strong>-<strong>18</strong> <strong>California</strong> <strong>State</strong> <strong>Rail</strong> <strong>Plan</strong>the route’s capacity by allowing passenger and freight trains <strong>to</strong> travel on separatetracks, thus avoiding the delays associated with single track operations.The addition of sidings at key locations on the route also allow trains <strong>to</strong> waiten-route while other trains pass through. Increased capacity and improved on-timeperformance (a measurement of the timeliness of train arrivals at specificdestinations) are essential <strong>to</strong> operational efficiency.On-Time Performance (OTP)The ten-year OTP goal for all three routes (Pacific Surfliner, San Joaquin, andCapi<strong>to</strong>l Corridor) is 90 percent.Pacific Surfliner Route – In FFY 2006-07, the Department’s OTP goal for thePacific Surfliner Route was 82 percent, with the actual year results of74.8 percent. While the Pacific Surfliner Route handles high volumes of traffic,freight, commuter rail (Metrolink and Coaster), Amtrak <strong>California</strong> and Amtraknational service, the route is still operating with 70 percent single-track.The Department has added double and triple track at key locations in prior years,and will continue <strong>to</strong> increase capacity with several additional projects as fundingbecomes available.The Lincoln Avenue double track project in Orange County, completed in <strong>2007</strong>,closed a 1.8-mile gap in double-track terri<strong>to</strong>ry, allowing trains <strong>to</strong> pass moreefficiently and improve OTP. Another 1.8-mile double track project north ofOceanside was completed in early <strong>2007</strong>, with resulting improvements <strong>to</strong> OTP andreliability. Also, work is progressing on the large Los Angeles-Fuller<strong>to</strong>n thirdmain track and six grade separations project. To date, four miles of triple trackhave been completed. Segments are being completed sequentially and each newsegment improves reliability and OTP for both commuter and Pacific Surflinerservices. Other projects currently programmed that will improve OTP include theOceanside double-track project <strong>to</strong> extend a siding, and the Santa Margarita doubletrackbridge project.San Joaquin Route – In FFY 2006-07, the Department’s OTP goal for theSan Joaquin Route was 75 percent, with the actual results of 67.9 percent(extensive track work in January and February significantly lowered thepercentage). Over 75 percent of the 365-mile route from Bakersfield <strong>to</strong> Oakland issingle-track and therefore susceptible <strong>to</strong> increases in traffic and service disruptions(i.e., crossing accidents, broken rails, and maintenance of way work).OTP should improve significantly due <strong>to</strong> the completion of two important doubletrackprojects on the route: the Shirley <strong>to</strong> Hanford project, completed inearly 2006, reduced the running time on four trains by five minutes; the Calwa <strong>to</strong>Bowles (near Fresno) double track project, completed in January <strong>2007</strong>, will furtherimprove reliability and OTP. Performance measures were contained in thecontracts for these capital projects that require the BNSF, upon projectcompletion, <strong>to</strong> maintain 90 percent OTP, excluding a number of delays outside its48
Chapter III – Operations Programcontrol, such as weather problems, on the track it owns. Also, the installation ofCentralized Traffic Control (CTC) between Port Chicago and Oakley should becompleted in <strong>2007</strong>-<strong>08</strong> and will improve OTP.The Department applies additional operational strategies <strong>to</strong> increase OTP andreliability on the San Joaquin Route. First, OTP incentives are contained in theAmtrak operating agreement with BNSF and UP, and incentive payments are onlymade when OTP standards are met. Second, weekly operations conference callsinvolving the railroads (both the UP and the BNSF), Amtrak, and periodically, theDepartment, identify issues identified in the prior week’s performance, and reviewOTP projections for the upcoming week(s). Third, the Department participateswith the railroads and Amtrak in developing schedules <strong>to</strong> minimize freight andpassenger train operation conflicts.Capi<strong>to</strong>l Corridor – On the Capi<strong>to</strong>l Corridor, where much of the route is alreadydouble-track, the goal is <strong>to</strong> maintain OTP at 90 percent. The actualFFY 2006-07 OTP was 74.6 percent, which is due primarily <strong>to</strong> freight andpassenger train congestion, track construction work, bridge opening delays, andmechanical incidents.New capital projects will further improve OTP. For example, the Phase 1 of theOakland <strong>to</strong> San Jose track improvements and the Yolo Causeway second maintrack project, completed in 2004, cut running time by 10 minutes betweenSacramen<strong>to</strong> and Oakland.SCHEDULE PLANNINGIn schedule planning, an essential component of the Operations Program, theDepartment reviews and revises train schedules <strong>to</strong> improve ridership, yield, andoperational efficiency within the established number of round-trips on the route.Intercity passenger rail serves a key role in a variety of travel patterns, which tend<strong>to</strong> become more complex as population growth and business centers move furtheraway from cities. Thus, train schedules, particularly in regard <strong>to</strong> equipment usageand crew schedules, are designed <strong>to</strong> provide optimum flexibility and coverage sothat passengers can plan convenient business or day trips <strong>to</strong> major urbandestinations, such as San Francisco, Oakland, Los Angeles, Sacramen<strong>to</strong>, andSan Diego. Also, the Department works <strong>to</strong>gether with other rail and transitproviders <strong>to</strong> develop schedules that easily connect with these services.Additionally, optimal schedules for the traveler are considered when the benefitsof capital projects are modeled. The goal is for capital projects <strong>to</strong> allow more trainscheduling flexibility as well as improved OTP and reliability.Cost-Effectiveness <strong>Plan</strong>ningThe Department also works with Amtrak <strong>to</strong> increase revenue yields and containcosts through analysis of segment profitability, yield pricing and othermechanisms, and establish fares that maximize yields and ridership. This effort iscoordinated with the market research and ridership/revenue modeling work49
<strong>2007</strong>-<strong>08</strong> – <strong>2017</strong>-<strong>18</strong> <strong>California</strong> <strong>State</strong> <strong>Rail</strong> <strong>Plan</strong>described in Chapter IV. Additionally, the Department moni<strong>to</strong>rs Amtrak billingsfor accuracy.Another potential avenue for reducing costs and increasing service quality is thecompetitive bidding of either the entire intercity rail service function or of specificancillary services. The Department has examined these options in the past andwill continue <strong>to</strong> study the feasibility of competitively bidding rail services. This isa timely issue as there has been strong interest from the Federal administration andmany in Congress <strong>to</strong> introduce competition <strong>to</strong> Amtrak. Amtrak’s own strategicreform initiatives concerning competition are discussed in the “Amtrak <strong>Plan</strong>ningSection” of Chapter XI.PASSENGER AMENITIESOn Board AmenitiesA hallmark of intercity rail service includes enhanced passenger amenities.All trains on each of the three <strong>State</strong> routes include a food service car that providestable seating, snacks, drinks, beer and wine. Passengers can also take food andbeverages back <strong>to</strong> their own seat. The San Joaquin Route also provides a fullmeal on a tray, including vegetarian items. Food service is evaluated and adjustedon an ongoing basis <strong>to</strong> improve quality, variety and cost effectiveness.Seating reservations are made at the time of ticket purchase on the San Joaquins.Reserved seating on the Pacific Surfliners is available with Business ClassService, which includes large reclining seats, extra legroom, and at-seat service offood, beverages, and a newspaper. The Capi<strong>to</strong>l Corridor provides one “quiet car”per train for passengers who want <strong>to</strong> sleep or relax. The CCJPA is also exploringthe development of a Business/Cus<strong>to</strong>m Class Car with the objective of providingadditional services and amenities not found in other Coach Cars. Checkedbaggage is available on the San Joaquins at all staffed stations and on thePacific Surfliners at most staffed stations.The fleet of <strong>California</strong> Cars (San Joaquin and Capi<strong>to</strong>l Corridor) and SurflinerCars (Pacific Surfliner) were designed <strong>to</strong> provide superior passenger amenitiesincluding on board bicycle facilities, and complete accessibility consisting of onboardwheelchair lifts, two designated spaces per train car for passengers inwheelchairs, and one wheelchair-accessible lava<strong>to</strong>ry on the lower level of eachtrain car. Current upgrades underway for the <strong>California</strong> Car provide 110-voltconvenience outlets at every seat. In the longer term, the Department is in theprocess of developing specifications for new rail cars that will increase on-boardamenities as well as operational efficiency.The Department is also exploring new technologies <strong>to</strong> improve on-board amenities(see the Section below titled “Emerging Technologies”).50
Chapter III – Operations ProgramStation AmenitiesPassenger amenities are also provided at stations on all three <strong>State</strong> routes.The 10-year capital program includes several station improvement and parkingprojects, including the Emeryville and Richmond Stations (on the San Joaquin andCapi<strong>to</strong>l Corridor Routes), and new station projects in Elk Grove, S<strong>to</strong>ck<strong>to</strong>n andMadera on the San Joaquin Route. The 10-year plan also includes new parkingprojects at the Oxnard, Fuller<strong>to</strong>n, and Solana stations on the Pacific SurflinerRoute. Over the years, most of the existing stations were either rebuilt orsignificantly upgraded. Near-term projects involve deployment of next-generationticket machines on the Pacific Surfliners <strong>to</strong> allow cross ticketing between Amtrakand Metrolink. Also, the Department encourages mixed-use development, at ornear stations that can provide improved access <strong>to</strong> food, entertainment andtransportation services.Passenger InformationPassenger information serves both a marketing and operational function.The Department is continually looking for new ways <strong>to</strong> inform cus<strong>to</strong>mers andpotential cus<strong>to</strong>mers about: rail service; transit, air and au<strong>to</strong> connections <strong>to</strong> trainsand connecting buses; and locations served by trains and connecting buses.Passenger information is disseminated in various forms, including: telephoneinformation; printed timetables; signage and displays at stations and bus s<strong>to</strong>ps; andvia the internet. The Department seeks <strong>to</strong> provide passengers with information onthe “<strong>to</strong>tal trip”, including extensive information on destinations.Amtrak’s national telephone information number, 1-800-USA-RAIL, is the mostwidely used source of information for Amtrak <strong>California</strong> cus<strong>to</strong>mers. The traintimetable (for each of the three <strong>State</strong> routes) provides essential passengerinformation. Timetables, which are updated with every schedule change, providetrain and connecting Amtrak bus schedules, a list of connecting transit services(including detailed information on commuter rail connections), and a list ofpassenger amenities for each station.Passenger information is also provided at train stations, bus s<strong>to</strong>ps, and on theinternet. The timetable is displayed on “Info Posts” at all train stations (on theplatform) and bus s<strong>to</strong>ps (at the s<strong>to</strong>p). These displays include local area maps withinformation (including phone numbers) for hotels, restaurants, rental car agenciesand other services located near the station. All Info Posts are updated with everyschedule change. Electronic Passenger Information Display Systems (at allstations on the three <strong>State</strong> routes) provide passengers with real-time audio andvisual information on train arrivals and departures. These information displays areespecially helpful at un-staffed stations. Future projects include displaying realtimeinformation on the train status of connecting commuter and transit systemsIn 1996, the Department established the Amtrak <strong>California</strong> web site,www.amtrakcalifornia.com, that provides detailed information on <strong>California</strong>51
<strong>2007</strong>-<strong>08</strong> – <strong>2017</strong>-<strong>18</strong> <strong>California</strong> <strong>State</strong> <strong>Rail</strong> <strong>Plan</strong>routes, fare promotions and discounts, and downloadable timetables. The websitealso provides local information <strong>to</strong> assist with trip planning, station information,local transit information, links <strong>to</strong> local transit opera<strong>to</strong>rs, and direct links <strong>to</strong>Amtrak’s national web site, www.amtrak.com, that provides general information,on-line reservations, ticket purchasing for all Amtrak trains, and Amtrak <strong>to</strong>ur andvacation package information. The Amtrak <strong>California</strong> web site also includes adirect link <strong>to</strong> the CCJPA’s web site, www.amtrakcapi<strong>to</strong>ls.com, which providesinformation on the Capi<strong>to</strong>l Corridor.The Department launched “Caltrans in Transit”, a web-based travel planner forCaltrans employees in Summer <strong>2007</strong>. This <strong>to</strong>ol will provide employees with the“best bets” for using public transportation when traveling on <strong>State</strong> businessbetween Headquarters and District offices. The “Caltrans in Transit” web-basedtravel planner will present employees with transportation options, trip costs, anddetailed travel instructions. In addit, the Department’s Internet Travel Reservationservice will be enhanced in <strong>2007</strong> <strong>to</strong> allow making Amtrak reservations with thesame ease as making airline and car rental reservations. Finally, Amtrak installeda “Quik-Trak” ticket machine at the Department’s Headquarters location that isavailable <strong>to</strong> the public <strong>to</strong> purchase Amtrak tickets. The Department will moni<strong>to</strong>rthe success of the program and possibly expand it <strong>to</strong> District offices.EMERGING TECHNOLOGIESDue <strong>to</strong> emerging technology primarily related <strong>to</strong> wireless networking, possibilities<strong>to</strong> streamline operations and improve passenger amenities exist that previouslywould have been very costly or not available. Some of these improvements arerelated <strong>to</strong> technology that is currently available and some involve development ofa comprehensive wireless system. These applications are discussed below, whilethe specific applications <strong>to</strong> each Route are discussed in Chapters VI, VII, and VIII.Passenger On-Board Wireless Internet ServiceWireless internet service is becoming commonplace. The Capi<strong>to</strong>l Corridoroffered internet service in selected cars on a pilot basis, but it was determined <strong>to</strong>not be cost-effective at the time. The Department would like <strong>to</strong> add passenger onboardwireless internet capabilities <strong>to</strong> its Routes. However, as is discussed below,this may not be cost effective unless the wireless system is linked <strong>to</strong> a morecomprehensive system-wide network involving operational applications.Also, application <strong>to</strong> each route could differ as the Department owns all of theequipment on the San Joaquins, while the majority of equipment on thePacific Surfliners is owned by Amtrak.Au<strong>to</strong>mated Ticket ValidationAu<strong>to</strong>mated Ticket Validation and on-line ticketing is a wireless application thatcan be implemented in advance of a full wireless network. It would improvecus<strong>to</strong>mer service, operations, and safety. <strong>Rail</strong> passengers have been able <strong>to</strong> make52
Chapter III – Operations Programreservations and purchase tickets over the internet for some time now, but thetickets purchased are traditional paper tickets and must be mailed <strong>to</strong> the purchaseror picked up at an Amtrak ticket office prior <strong>to</strong> departure. Airlines went one stepfarther and introduced “paperless” ticketing several years ago where passengerscan make their own reservations on-line that are used <strong>to</strong> print a boarding pass prior<strong>to</strong> departure, either on the passengers’ own computer or at a check-in terminal atthe airport. A similar system for train travel would be much more convenient formany passengers, particularly those boarding at small unstaffed stations along theroute, because it would eliminate the need <strong>to</strong> obtain actual paper tickets prior <strong>to</strong>traveling, or purchasing them on board.The system would have many operational advantages. Conduc<strong>to</strong>rs would scan thetickets with hand-held bar code readers and the information would be s<strong>to</strong>redelectronically, eliminating the manual processing of tickets, both on-board thetrains and in Amtrak’s central accounting offices. Tickets could be also purchasedon-board, and on-board credit card sales could be checked for invalid credit cardusage. The hand-held system will also print out a seat check for each ticketvalidation or on-board ticket sale. By cross reference <strong>to</strong> the maintained ticket saledatabase and the validation of ticket use or sale while in service, it will be feasible<strong>to</strong> produce a passenger manifest. This is a significant safety and security featureand will be similar <strong>to</strong> that currently required of the passenger airline industry.This system would also allow actual trip origin-destination information, instead onthe current estimates (particularly for 10-ride and monthly tickets), <strong>to</strong> betterinform management of actual usage, thus allowing better insight and managemen<strong>to</strong>f the service delivered <strong>to</strong> the cus<strong>to</strong>mer.The CCJPA in <strong>2007</strong> is undertaking an au<strong>to</strong>mated ticket validation pilot project thatis funded by the Department. Depending upon the results, the Department willdevelop a plan for project implementation on the Pacific Surfliners andSan Joaquins.Wireless Train Management SystemThe Department is investigating the use of wireless train management that is awireless network of communication between locomotives, wayside signalingsystems, and dispatchers that functions as a safety overlay on <strong>to</strong>p of existing traincontrol and signal systems. The purpose is <strong>to</strong> improve safety and <strong>to</strong> prevent traincollisions and accidents. A computerized system is installed inside eachlocomotive that receives information from the railroad’s existing GlobalPositioning System (GPS) network, and once the train is underway, the systemtracks the train’s location. The system can: override and au<strong>to</strong>matically controltrain speed, relay information such as speed limits and track switch positions <strong>to</strong> acomputer screen inside the locomotive cab, sending warnings <strong>to</strong> the crew, andau<strong>to</strong>matically starting the braking process (if the crew does not respond promptly).Wireless train management is a significant safety miles<strong>to</strong>ne for the rail industry.53
<strong>2007</strong>-<strong>08</strong> – <strong>2017</strong>-<strong>18</strong> <strong>California</strong> <strong>State</strong> <strong>Rail</strong> <strong>Plan</strong>The Electronic Train Management System (ETMS) is a patented system that isused by BNSF. As a pilot project in 2004, BNSF installed ETMS on 50 of itslocomotives along a 135-mile stretch of track in Illinois. In January <strong>2007</strong>, theFederal <strong>Rail</strong>road Administration (FRA) gave approval <strong>to</strong> begin using (ETMS) onother parts of the BNSF network. The Department first plans <strong>to</strong> implement ETMSon the San Joaquin Route because a majority of the railroad track is owned byBNSF who plans <strong>to</strong> install ETMS in the next few years. The BNSF’s currenttentative timeline is <strong>to</strong> begin work in FY 2009-10 and complete work inFY 2010-11. Funding for the project still needs <strong>to</strong> be finalized.Installation of a wireless train management system on the Pacific Surfliners wouldbe more complex because of the multiple railroad ownership on the Route. On theCapi<strong>to</strong>l Corridor, the CCJPA would have <strong>to</strong> work with the UP on installation of asimilar system.Comprehensive Wireless NetworkA comprehensive wireless network could have many applications forimprovement of safety, operations, cost-control, and cus<strong>to</strong>mer service.The network would include hardware installations on the <strong>State</strong>-owned rollings<strong>to</strong>ck and would likely include equipment installations along the right-of-way andother fixed facilities. Systems such as this are in use <strong>to</strong>day in Europe.This network could use similar technology <strong>to</strong> an ETMS system, however would becompletely separate, as ETMS must be a <strong>to</strong>tally closed-system in order <strong>to</strong> maintainthe high level of accuracy and lack of failure necessary for a signal safety system.The applications that can be developed based on a comprehensive wirelessnetwork represent options that would have previously been very costly orimpossible, and as such, a wireless network has a very strong potential <strong>to</strong> be oneof the most significant changes <strong>to</strong> passenger rail service and operations in thefuture. The applications listed in Figure 3G below are initial options fordevelopment and implementation. Figure 3G describes specific applications of thewireless network, their applications and their benefits. Additionally, when newand innovative means <strong>to</strong> improve cus<strong>to</strong>mer service, safety, security, and improvethe efficiency of operations (maintenance, fare collection, etc.) are identified,a stable and cost effective network exists for development and deployment.Business model analysis indicates that providing cus<strong>to</strong>mer internet access, either“free” (included with the train ticket fare), or charged separately, and the potentialuse of on-train digital advertising, could provide an ongoing flow of revenue <strong>to</strong>support much of, if not all of, the capital and operating expenses for the network.Thus, cus<strong>to</strong>mer access may be able <strong>to</strong> support the costs of the operational andsafety components of the system.54
Chapter III – Operations ProgramFigure 3GComprehensive Wireless Network ApplicationsApplication Uses BenefitsRight-of-Way(ROW)CamerasOn-TrainSecurityCamerasConduc<strong>to</strong>rHand-heldCamerasPlaced at grade crossings, at othercrucial infrastructure points, or inkey spots along the ROW andviewed in the train engineer’s cab.The real-time video image providesa ‘look ahead’ for the engineerwithin sufficient braking distance<strong>to</strong> avoid damage <strong>to</strong> life andproperty. Remote viewing at anoperations center can track andrecord illegal dumping andtrespassing, unauthorized entry orany unauthorized placement ofobjects/devices in the ROW.Remote viewing of the ROW canbe enhanced by video analyticswhich analyzes image for incidentabnormalities and then alerts adecision maker <strong>to</strong> view the affectedcamera.Cameras placed in passenger cars,and on the front of locomotives canprovide remote viewing capabilityat an operations or an emergencyresponse (police/fire) unit, and itmay be activated via video and/oraudio analytics. The images canalso be saved for later access.Conduc<strong>to</strong>r activated, mobilecamera powered via Wi-Fiequipped device <strong>to</strong> allow remoteviewing of incidents, passengeractions, and remote mechanicalviewing and repair management.They are a <strong>to</strong>ol for conduc<strong>to</strong>rs <strong>to</strong>use in situations where conduc<strong>to</strong>rsdetermine that remote direction andguidance would help them respond<strong>to</strong> incidents.• Reduces loss of life and injury,property damage <strong>to</strong> railequipment, track infrastructure.• Reduces cascading and multihourdelays <strong>to</strong> passenger andfreight trains and costs <strong>to</strong>“rescue” passengers strandedwhile incident damage isevaluated and res<strong>to</strong>red.• Reduces liability/legal costs fromreduced number of incidents.• Keeps more trains in service <strong>to</strong>fulfill the service plan.• Video analysis allows for actionand response after unauthorizedentry or placement of devices.• Reduces train repairs for strikeincidents that often exceeds$100,000 per incident.• Real-time decision and analysis<strong>to</strong>ol for train crew, emergencypersonnel, and operationspersonnel <strong>to</strong> respond moreeffectively <strong>to</strong> incidents.• Legal record of incident leads <strong>to</strong>improved prosecution, orreduction/elimination of claims.• Allows for more rapid repair anddiagnostics from mechanicaldelays which improves on-timeperformance.• Likely <strong>to</strong> reduce extreme delaywaiting for mechanical staff <strong>to</strong>arrive at train.• Provides a record of conduc<strong>to</strong>r’sactions when activated for anincident.55
<strong>2007</strong>-<strong>08</strong> – <strong>2017</strong>-<strong>18</strong> <strong>California</strong> <strong>State</strong> <strong>Rail</strong> <strong>Plan</strong>Figure 3G (continued)Comprehensive Wireless Network ApplicationsApplication Uses BenefitsAu<strong>to</strong>matedTicketValidationProgramMechanicalDiagnosticReal-TimeFeedFood ServiceReal-TimeInven<strong>to</strong>ryChangeableCus<strong>to</strong>merInformationVideo ScreenTrain DelayDatabaseReportingA Wi-Fi enabled hand-held bar codescanner can be programmed <strong>to</strong>record and sell valid Amtrakpassenger train tickets which,through a database of ticket sales,can be used <strong>to</strong> establish a real-timepassenger manifest. Also a <strong>to</strong>ol <strong>to</strong>track, validate, and sell tickets <strong>to</strong>passengers.Data feed that tracks locomotive anden-route fleet performance canprovide mechanical diagnosticsinformation on a real-time basis foren route moni<strong>to</strong>ring. It improvesscheduling for actionable repair andupdating of the maintenance log forscheduled or targeted maintenance.Maintain a real-time inven<strong>to</strong>ry offood s<strong>to</strong>ck and sales for en route res<strong>to</strong>ckingand for long-term salestracking.Wi-Fi updated, in car mounted LCDscreen that conveys cus<strong>to</strong>merinformation and/or media content.Providing cus<strong>to</strong>mer alerts, internaltrain status, and an opportunity foradvertisement (revenue).Via the same Wi-Fi handheld unitsfor the ATV project, conduc<strong>to</strong>rs dodirect electronic entry <strong>to</strong> delayincident reporting database.• Real-time passenger manifestupdates available in the event ofan incident.• Real-time processing of on-boardcredit card sales reduces revenueloss (due <strong>to</strong> post processing) ofinvalid credit card usage.• Also provides a platform forricher ridership data and analysis.• Improves maintenance and fewerincidents due <strong>to</strong> road failures; andmore rapid and thoroughunderstanding of road failurereason.• Improves on-time performancethrough more rapid incidentresolution and by overallreduction of maintenance delayincidents.• Can reduce food spoilage costs.• Vastly improves sales <strong>to</strong>inven<strong>to</strong>ry tracking and revenuemoni<strong>to</strong>ring.• Data can provide for a menuchange <strong>to</strong> improve sales.• Most effective on-traincommunications <strong>to</strong>ol and newcus<strong>to</strong>mer <strong>to</strong>uch point.• Opportunity for advertisementrevenue for use of screen space.• Reduces data entry costs.• Real-time accuracy and tracking.The CCJPA has taken the lead on researching the use of technology <strong>to</strong> improvecus<strong>to</strong>mer service and railroad operations. The Department has funded andsupported this work. To date the CCJPA has developed a Request for Information(RFI) and worked with consultants. By 20<strong>08</strong>, the CCJPA expects a Request for56
Chapter III – Operations ProgramProposal (RFP) process <strong>to</strong> be in place that seeks <strong>to</strong> find the best technology andbusiness model fit with a network opera<strong>to</strong>r or service provider <strong>to</strong> establish andmaintain such a network. Based on the results of the RFP process, the Departmentwill develop plans <strong>to</strong> implement a wireless network on the Pacific Surfliner andSan Joaquin routes.Cus<strong>to</strong>mer Relationship Management (CRM)Cus<strong>to</strong>mer Relationship Management (CRM) also uses new technology <strong>to</strong> improvethe information exchange between the rail opera<strong>to</strong>r and the cus<strong>to</strong>mer that isinitiated with ticket sales. CRM is centered on a greatly improved ticket salesdatabase system. CRM ties <strong>to</strong>gether the sales, cus<strong>to</strong>mer service, marketing, andsupply chain/operations activities <strong>to</strong> deliver service <strong>to</strong> the cus<strong>to</strong>mer.Many businesses are using CRM <strong>to</strong> gain better sales and cus<strong>to</strong>mer data andstreamline cus<strong>to</strong>mer service processes. In many other industries, and most notably,the airline industry, cus<strong>to</strong>mers are accus<strong>to</strong>med <strong>to</strong> a detailed level of cus<strong>to</strong>merservice that is typically delivered via CRM.The train cus<strong>to</strong>mer could use this system <strong>to</strong> get train-related information tailored<strong>to</strong> their needs, such as electronic alerts on specific trains, general rail serviceupdates, special promotions/offers, and other communication as requested by thecus<strong>to</strong>mer. In turn, Amtrak <strong>California</strong> would gain valuable demographic cus<strong>to</strong>merdata that would provide a better understanding of the cus<strong>to</strong>mers and provide a <strong>to</strong>ol<strong>to</strong> deliver service that is more closely aligned with the cus<strong>to</strong>mer’s needs anddesires. Data from a CRM system would allow management <strong>to</strong> use predictiveanalytics <strong>to</strong> determine cus<strong>to</strong>mer travel and usage patterns. As well, in themarketing arm of cus<strong>to</strong>mer relations, the data would allow for improvedpromotions and techniques <strong>to</strong> build cus<strong>to</strong>mer trust and loyalty, which is nearlyimpossible with <strong>to</strong>day’s system.The relationship between the wireless network, au<strong>to</strong>mated ticket validation, andCRM is inter-connected. They are linked through the use of technology anddatabases <strong>to</strong> gain a unified, cost-effective platform for improving passenger railoperations in general. The Department will continue <strong>to</strong> research the feasibility ofimplementing these systems.CONNECTING AMTRAK BUS SERVICESAll three <strong>State</strong> routes include connecting Amtrak bus service. On theSan Joaquins, the bus network is an essential element of the system, with at least70 percent of San Joaquin passengers using at least one connecting bus at thebeginning or end of their trips. The buses are utilized <strong>to</strong> reach markets that are notdirectly served by intercity passenger rail. The Amtrak buses are guaranteedconnections; if a train is late, the bus connection waits until the train arrives.Government Code Section 14035.55 requires that Amtrak bus riders must use thetrain for part of their trips; thus Amtrak has specific ticketing policies <strong>to</strong> ensurebus access is not provided <strong>to</strong> non-train riders.57
<strong>2007</strong>-<strong>08</strong> – <strong>2017</strong>-<strong>18</strong> <strong>California</strong> <strong>State</strong> <strong>Rail</strong> <strong>Plan</strong>Bus routes are evaluated for their cost-effectiveness. Under Government CodeSection 14035.2, the Department is required <strong>to</strong> conduct cost recovery analyses onbus routes, and restructure or discontinue routes if they do not meet standards.The Department developed written standards <strong>to</strong> implement the law, includingtwice-yearly route and segment evaluations. Cost recovery (or break-even) isdefined (under the law) by subtracting bus route operations costs from bus routerevenue plus the train revenue contributed from bus route passengers. Utilizingthis financial analysis, it is evident that the bus system provides a net incrementalgain <strong>to</strong> the trains. The Department continues <strong>to</strong> evaluate bus routes on this basisand restructures or eliminates routes as necessary. Also, certain s<strong>to</strong>ps may beadded, relocated, or eliminated, and frequencies may be adjusted <strong>to</strong> reflect marketconditions.Figure 3H shows the performance of currently operated bus routes forFY 2004-05 and 2005-06. The column headed “Net Generated Revenue” requiresfurther explanation: few connecting bus passengers would use the train if thefeeder bus service did not exist; therefore, Generated Revenue represents the <strong>to</strong>talbus/train revenue generated by such passengers. The cost of the bus service isdeducted from Generated Revenue <strong>to</strong> determine Net Generated Revenue, whichshows the economic impact of the bus service on the rail network in <strong>California</strong>.All routes with a positive Net Generated Revenue serve <strong>to</strong> link communities withthe train route, and <strong>to</strong> contribute <strong>to</strong> the economic success of the rail network.If a route has a negative Net Generated Revenue, the Department evaluates thereasons for this performance. If the service is relatively new, negative results mayoccur during its initial growth period. If ridership and revenue continue <strong>to</strong>increase, the service will be continued <strong>to</strong> allow further growth, even though theservice is not yet making a positive economic contribution <strong>to</strong> the rail network.If ridership and revenue do not increase, the service is reviewed for potentialwithdrawal <strong>to</strong> allow more effective use of <strong>State</strong> funding.58
Chapter III – Operations ProgramFigure 3HBusRouteNumberBus Route End PointsAMTRAK CONNECTING BUS PERFORMANCEBusPassengersOne-Way BusTripsPassengersper Bus TripNet GeneratedRevenueNet GeneratedRevenue perBusPassengerOc<strong>to</strong>ber 2005 through September 20061 Los Angeles-Bakersfield 249,266 12,779 19.5 $ 6,585,116 $ 26.423 S<strong>to</strong>ck<strong>to</strong>n-Redding 104,150 4,674 22.3 $ 630,782 $ 5.834 Los Angeles-Santa Barbara 10,982 772 14.3 $ 163,481 $ 14.266 S<strong>to</strong>ck<strong>to</strong>n-San Jose 24,063 4,380 5.5 $ (501,680) $ (21.16)7 Martinez-McKinleyville 43,920 5,844 7.5 $ 162,214 $ 1.759 Bakersfield-Las Vegas 16,077 2,190 7.3 $ 54,093 $ 1.9810 Bakersfield-Santa Barbara 27,954 2,922 9.6 $ 286,968 $ 9.9712 Bakersfield-Palmdale 11,619 1,460 8.0 $ 6,557 $ (0.17)17A Santa Barbara-Paso Robles 47,631 2,576 <strong>18</strong>.5 $ (191,9<strong>08</strong>) $ (4.03)17C Paso Robles-San Francisco 7,589 730 10.4 $ (326,897) $ (43.<strong>08</strong>)<strong>18</strong> Hanford-San Luis Obispo 20,006 1,460 13.7 $ 34,298 $ 1.7119 Bakersfield-Indio 31,812 2,920 10.9 $ (105,430) $ (3.31)20 Sacramen<strong>to</strong>-Reno/Sparks 51,227 3,288 15.6 $ 150,854 $ 2.9421B Oakland - San Jose 36,034 3,650 9.9 $ (21,358) $ (0.59)21C San Jose- Santa Barbara 13,149 728 <strong>18</strong>.1 $ 100,870 $ 7.6723 Sacramen<strong>to</strong>-Carson City 17,365 2,<strong>18</strong>4 8.0 $ (191,000) $ (11.00)34 S<strong>to</strong>ck<strong>to</strong>n-San Francisco 11,982 1,460 8.2 $ 54,456 $ 4.5436 (2) Oakland - San Luis Obispo 17,047 756 22.5 $ 478,953 $ 28.1037 (3) Merced-Monterey 3,893 1,336 2.9 $ 219,887 $ 56.48TOTALS 745,766 56,109 $ 7,590,256Oc<strong>to</strong>ber 2004 through September 20051 Los Angeles-Bakersfield 234,541 12,045 19.5 $ 6,003,672 $ 25.603 S<strong>to</strong>ck<strong>to</strong>n-Redding 84,452 5,<strong>08</strong>2 16.6 $ 1,112,784 $ 13.<strong>18</strong>4 Los Angeles-Santa Barbara 12,389 758 16.3 $ 221,320 $ 17.866 S<strong>to</strong>ck<strong>to</strong>n-San Jose 26,633 5,856 4.5 $ (438,934) $ (16.48)7 Martinez-McKinleyville 37,974 5,867 6.5 $ (24,719) $ (0.65)9 Bakersfield-Las Vegas 15,191 2,007 7.6 $ 40,521 $ 2.6710 Bakersfield-Santa Barbara 25,792 2,743 9.4 $ 201,889 $ 7.8312 Bakersfield-Palmdale 9,870 1,368 7.2 $ (32,196) $ (3.26)17A Santa Barbara-Paso Robles 20,924 2,509 8.3 $ 136,769 $ 6.5417C Paso Robles-San Francisco <strong>18</strong>,536 733 25.3 $ 171,012 $ 9.23<strong>18</strong> Hanford-San Luis Obispo 16,613 1,462 11.4 $ 20,029 $ 1.2119 Bakersfield-Indio 33,049 2,925 11.3 $ 300,839 $ 9.1020 Sacramen<strong>to</strong>-Reno/Sparks 50,648 8,030 6.3 $ 210,096 $ 4.1521A (1) San Jose - Monterey 2,301 496 4.6 $ (29,346) $ (12.75)21B Oakland - San Jose 24,639 3,064 8.0 $ 19,620 $ 0.8021C San Jose- Santa Barbara 12,216 730 16.7 $ 58,401 $ 4.7823 Sacramen<strong>to</strong>-Carson City 16,472 2,190 7.5 $ (93,699) $ (5.69)34 S<strong>to</strong>ck<strong>to</strong>n-San Francisco 19,407 1,476 13.1 $ 228,573 $ 11.7836 (2) Oakland - San Luis Obispo 13,016 817 15.9 $ 322,374 $ 24.77TOTALS 674,663 60,158 $ 8,429,005(1) Effective June 2005, San Jose-Monterey service discontinued(2) Effective November 2004, Route 36 service began(3) Effective November, 2005 Route 37 service began59
<strong>2007</strong>-<strong>08</strong> – <strong>2017</strong>-<strong>18</strong> <strong>California</strong> <strong>State</strong> <strong>Rail</strong> <strong>Plan</strong>MULTIMODAL CONNECTIVITYThe Department strives <strong>to</strong> make the intercity passenger rail system as “seamless”as possible with excellent connectivity <strong>to</strong> other transportation systems. Designingfor connectivity enters in<strong>to</strong> virtually every aspect of operations, marketing andcapital planning. The Department will continue <strong>to</strong> improve connectivity whereverpossible by expanding the programs discussed below, and implementing newprograms.Amtrak: The <strong>State</strong>-supported routes connect with each other and with Amtrak’snational intercity passenger rail network. Many passengers use the <strong>State</strong>supportedroutes as part of a longer rail trip. Coordination of schedules with otherservices generates additional ridership and can improve overall efficiency.The Pacific Surfliners connect <strong>to</strong> the: San Joaquins and Capi<strong>to</strong>l Corridor (viaAmtrak bus), Coast Starlight, Southwest Chief, and Sunset Limited.The San Joaquins connect <strong>to</strong> the: Pacific Surfliner (via Amtrak bus),Capi<strong>to</strong>l Corridor, Coast Starlight, <strong>California</strong> Zephyr, Sunset Limited, andSouthwest Chief. The Capi<strong>to</strong>l Corridor connects <strong>to</strong>: the San Joaquins,Pacific Surfliners (via Amtrak bus), Coast Starlight and <strong>California</strong> Zephyr.Commuter and Urban <strong>Rail</strong>: In Southern <strong>California</strong>, the Department works withboth Metrolink and Coaster <strong>to</strong> promote the <strong>Rail</strong> 2 <strong>Rail</strong> Program, which connectsthe Pacific Surfliners <strong>to</strong> Metrolink in the Los Angeles area, and Coaster in theSan Diego area. Additionally, the Pacific Surfliners s<strong>to</strong>p at stations withconnections <strong>to</strong> Los Angeles Metro <strong>Rail</strong>, San Diego Trolley, and Caltrain inSan Jose (via Amtrak bus service). In central <strong>California</strong>, the San Joaquins s<strong>to</strong>p atstations with connections <strong>to</strong> Caltrain, BART, San Francisco Muni, Santa ClaraValley Transit Authority (VTA), and Sacramen<strong>to</strong> Regional Transit. In addition,the network of commuter rail and transit systems in Southern <strong>California</strong> isaccessible <strong>to</strong> San Joaquin Route passengers by utilizing the dedicated connectingbus service at Bakersfield. In Northern <strong>California</strong>, the Capi<strong>to</strong>l Corridor s<strong>to</strong>ps atstations with connections <strong>to</strong> Caltrain, Altamont Commuter Express (ACE), BART,VTA and Sacramen<strong>to</strong> Regional Transit (fall 2006).Transit: Under the Free Transit Transfer Program, the Department and the CCJPAhave agreements with many local transit agencies, serving communities along allthree <strong>State</strong> routes, <strong>to</strong> offer Amtrak passengers free transfer passes as follows:Pacific Surfliner Route:• City of Guadalupe Transit• Regional Transit Authority (San Luis Obispo, Santa Maria, Atascadero,Paso Robles)• San Luis Obispo Regional Transit (SLO Transit)• Santa Barbara Metro Transit District60
Chapter III – Operations Program• South County Area Transit (Grover Beach)San Joaquin Route:• Alameda-Contra Costa Transit District (AC Transit)• Benicia Breeze• Contra Costa County Connection• Fresno Area Express• Merced County Transit• Rio Vista Delta Breeze• Sacramen<strong>to</strong> Regional TransitCapi<strong>to</strong>l Corridor:• Alameda-Contra Costa Transit District (AC Transit)• Contra Costa County Connection• Davis Unitrans• Fairfield/Suisun Transit• Sacramen<strong>to</strong> Regional Transit• Santa Clara Valley Transportation Authority (VTA)• Yolobus (Davis and Sacramen<strong>to</strong>)In the 10-year period, the goal is <strong>to</strong> expand the program <strong>to</strong> all major transitproviders with connections <strong>to</strong> the <strong>State</strong>-supported routes.Streets and Highways: Finally, the Department works <strong>to</strong> ensure that the trains arewell connected <strong>to</strong> streets and highways through proper design of stations andsignage, including pathfinder signs on local streets and roads and <strong>State</strong> highwaysthat guide passengers <strong>to</strong> Amtrak stations.<strong>Rail</strong> 2 <strong>Rail</strong> ProgramThe <strong>Rail</strong> 2 <strong>Rail</strong> Program, introduced in September 2002, aims <strong>to</strong> improveconnectivity between intercity and commuter rail services in southern <strong>California</strong>by coordinating schedules, ticketing, and fares between Amtrak, Metrolink andCoaster. Since the program was introduced, Pacific Surfliner ridership hasincreased 52 percent between 2001-02 and 2005-06. Each month Metrolinkmonthly ticket holders take over 36,000 trips; Coaster monthly ticket holders take6,500 trips.The joint ticketing <strong>Rail</strong> 2 <strong>Rail</strong> Program allows Metrolink and Amtrak monthlyticket holders (for the Orange County and Ventura County lines) <strong>to</strong> have access <strong>to</strong>61
<strong>2007</strong>-<strong>08</strong> – <strong>2017</strong>-<strong>18</strong> <strong>California</strong> <strong>State</strong> <strong>Rail</strong> <strong>Plan</strong>both system’s trains within the geographical limits of their tickets. Also, allAmtrak and Metrolink fares are equalized between Burbank Airport andLos Angeles Union Station, making it possible for any Metrolink or Amtrak ticket<strong>to</strong> be used on any train. In April 2004 the Program expanded <strong>to</strong> the Coasterservice allowing Amtrak ticket holders and Coaster monthly ticket holders access<strong>to</strong> both Amtrak and Coaster trains between Oceanside and San Diego. Metrolinkand Amtrak share 15 s<strong>to</strong>ps; Coaster and Amtrak share three s<strong>to</strong>ps. Figure 3I is amap of <strong>Rail</strong> 2 <strong>Rail</strong> Service.To further improve the seamless connectivity of the Southern <strong>California</strong> <strong>Rail</strong>System, <strong>Rail</strong> 2 <strong>Rail</strong> will expand <strong>to</strong> allow “through ticketing” between Amtrak andMetrolink, once through ticketing machines are in operation. They are scheduledfor deployment in <strong>2007</strong>-<strong>08</strong>, will replace the separate Amtrak and Metrolinkmachines used for their respective systems. For example, a passenger would beable <strong>to</strong> purchase a ticket from one vending machine for a trip that begins on anAmtrak train and ends on a Metrolink train.62
Chapter III – Operations ProgramFigure 3I63
<strong>2007</strong>-<strong>08</strong> – <strong>2017</strong>-<strong>18</strong> <strong>California</strong> <strong>State</strong> <strong>Rail</strong> <strong>Plan</strong>AIRPORT ACCESSSection 14036.7 of the Government Code requires that the Department report onthe status of all existing intercity rail station facilities that serve airports directlyand indirectly and on the Department’s activities in improving other linkagesbetween rail service and airports.Virtually all major airports in <strong>California</strong> can be reached by intercity rail with atransit connection. Figure 3J shows the intercity and commuter rail stations andtransit connections that provide access <strong>to</strong> the major <strong>California</strong> airports.The Amtrak <strong>California</strong> web site: www.amtrakcalifornia.com provides detailedinformation on access from <strong>California</strong> Amtrak services <strong>to</strong> <strong>California</strong> airports.Three airports in <strong>California</strong> are served directly by Amtrak train or connectingfeeder bus service: The Bob Hope Airport (Burbank), the Arcata-Eureka Airport,and the Palm Springs Airport. The Bob Hope Airport is directly served byPacific Surfliner trains. The rail station, which provides both Amtrak andMetrolink service, is a short walk from the main airport terminal. The stationintegrates airport shuttles, Amtrak Pacific Surfliner trains, San Joaquin feeder busservice, Metrolink trains, and local transit service. Currently, five daily round-tripPacific Surfliners and <strong>18</strong> weekday Metrolink round-trip trains serve this station.The Arcata-Eureka and Palm Springs Airports are directly served by aSan Joaquin bus s<strong>to</strong>p at the airport.64
Chapter III – Operations ProgramFigure 3J<strong>Rail</strong> Access <strong>to</strong> Major <strong>California</strong> AirportsAirport (Code) <strong>Rail</strong> Corridor* StationArcata-Eureka[ACV]Bob Hope [BUR]Fresno-YosemiteInternational [FYI]John Wayne[SNA]Long Beach[LGB]Los AngelesInternational[LAX]San Jose MinetaInternational [SJC]Public Transit Connectionbetween <strong>Rail</strong> Station andAirportSan Joaquin Bus McKinleyville (Bus s<strong>to</strong>ps at airport terminal.)Pacific Surfliner/San Joaquin Bus/MetrolinkBurbank AirportAirport shuttle (or withinwalking distance)San Joaquin Fresno Fresno Area ExpressPacific Surfliner/MetrolinkSanta AnaOrange County Transit AuthoritySan Joaquin Bus Long Beach Long Beach TransitPacific Surfliner/MetrolinkSan Joaquin BusCapi<strong>to</strong>l Corridor/San Joaquin Bus/CaltrainLos AngelesVan NuysFlyawaySan JoseOaklandOaklandCapi<strong>to</strong>l CorridorColiseumInternational[OAK] San Joaquin RichmondLos Angeles MetropolitanTransit Authority busFlyaway bus shuttleOntarioSan Joaquin Bus Ontario OmnitransInternational[ONT] Metrolink Fontana OmnitransPalm Springs[PSP]Sacramen<strong>to</strong>International[SMF]San DiegoInternational[SAN]Valley Transportation AuthorityAirBART Shuttle or AC TransitBART, AirBART Shuttle orAC TransitSan Joaquin Bus Palm Springs (Bus s<strong>to</strong>ps at airport terminal.)Capi<strong>to</strong>l Corridor/San Joaquin trainsand busesPacific Surfliner/CoasterSacramen<strong>to</strong>San DiegoYolobusSan Diego Transit busSan Francisco San Joaquin/Richmond BARTInternational Capi<strong>to</strong>l Corridor[SFO] Caltrain Millbrae BART* - A bus in the “<strong>Rail</strong> Corridor” column indicates dedicated Amtrak feeder bus connection froman Amtrak station.65
<strong>2007</strong>-<strong>08</strong> – <strong>2017</strong>-<strong>18</strong> <strong>California</strong> <strong>State</strong> <strong>Rail</strong> <strong>Plan</strong>66
Chapter IV – Marketing ProgramCHAPTER IVMARKETING PROGRAMThis chapter describes the purpose of the <strong>State</strong>’s intercity rail marketing programfor the Pacific Surfliner and San Joaquin routes and marketing goals for the nextten years. The program components include advertising, public relations/outreach,group travel, rail safety, and market research. This program is developed inpartnership with Amtrak and Capi<strong>to</strong>l Corridor Joint Powers Authority (CCJPA).Additionally, the Capi<strong>to</strong>l Corridor’s marketing program, which is formulated bythe CCJPA, is described at the end of the chapter.MARKETING PROGRAM GOALSThe Department’s goals for the Marketing Program are as follows:• Increase ridership by promoting new and expanded train and feeder busservices as consistent with ridership and service levels identified in Chapter III,Fiqure 3A.• Develop strategic partnerships with entities such as Air Quality Districts,transit agencies, and the private sec<strong>to</strong>r <strong>to</strong> leverage scarce media funds.• Develop new ways <strong>to</strong> reach our target audience more cost effectively with anemphasis on the emerging online technology. This includes the use ofattention-grabbing web banners, direct response e-mail marketing, and travelrelatedweb sites <strong>to</strong> inform travelers of the rail option.• Develop ridership in specific primary target markets that represent the greates<strong>to</strong>pportunity for increased ridership and revenue. This includes the “maturemarket” (persons over 50), families, and Hispanic persons. Secondary marketsinclude business travelers, solo travelers, and college students.• Promote recent improvements <strong>to</strong> the rail corridors including the opening ofnew and renovated stations and other capital improvements.• Promote new intercity rail services.The purpose for having a marketing program is <strong>to</strong> create awareness of <strong>California</strong>train travel in consumers’ minds. Market research shows that most <strong>California</strong>travelers do not consider taking the train when making travel decisions. Creatingthis awareness is essential for increasing demand and thus, ridership and revenue.This is accomplished through a combination of grassroots local marketingactivities and broad-based media campaigns. Increased demand will help fuel theexpansion of the new routes identified in the <strong>California</strong> <strong>State</strong> <strong>Rail</strong> <strong>Plan</strong>.67
<strong>2007</strong>-<strong>08</strong> – <strong>2017</strong>-<strong>18</strong> <strong>California</strong> <strong>State</strong> <strong>Rail</strong> <strong>Plan</strong>DEPARTMENT’S MARKETING PROGRAMThe annual intercity rail marketing program budget is $6.2 million. The budgetincludes $5 million in <strong>State</strong> funds and Amtrak supplements the budget with anadditional $1.2 million for media advertising. Of the $5 million, $3.8 million fundmarketing expenditures for the San Joaquins and Pacific Surfliner routes.The remaining $1.2 million goes <strong>to</strong> the Capi<strong>to</strong>l Corridor (the Capi<strong>to</strong>l CorridorJoint Powers Authority administers the Capi<strong>to</strong>l Corridor marketing funds.).A major challenge for the marketing program includes a limited budget that hasnot increased since 1993. Inflation and escalating media costs make it even moredifficult <strong>to</strong> maintain visibility in the media and in developing new approaches <strong>to</strong>reach audiences most likely <strong>to</strong> ride the train.Finding creative ways <strong>to</strong> leverage the marketing dollars will continue <strong>to</strong> becritical. Stretching media dollars through partnerships with media vendors allowsfor “added value” or media bonus opportunities for Amtrak <strong>California</strong>.The program has realized as much as 75 percent in additional radio and televisionexposure and will continue <strong>to</strong> expand media dollars in this way.To maximize the leveraging power of these limited funds, partnerships have beenand will continue be developed with connecting transit agencies <strong>to</strong> promote freetransit transfers on local buses and light rail. Another example is <strong>to</strong> develop costeffective ways <strong>to</strong> inform the traveling public about rail travel as simply as workingwith transit providers <strong>to</strong> include an Amtrak <strong>California</strong> web site link on<strong>to</strong> their websites.Finding ways <strong>to</strong> encourage rail travel during slow travel seasons will be developedby creating <strong>to</strong>urism packages with the Amtrak Guest Rewards Program andAmtrak’s partnerships with car rental agencies and hotels. This also includesworking with air quality districts that sponsor projects such as the Santa BarbaraCar Free project. This project promotes travel on the Pacific Surfliner trains withdiscount offers for hotels near the rail station <strong>to</strong> eliminate the need for rentinga car.Selling Amtrak tickets <strong>to</strong> increase ridership is like a retail business. Traditionaladvertising methods like with any retail business are changing with the emergenceof online information sources. More and more people will seek information fromthe internet over the next ten years and this is an area we will continue <strong>to</strong> receivemore emphasis.ADVERTISINGThe Department and Amtrak combine resources <strong>to</strong> create a single advertisingprogram for Amtrak <strong>California</strong> rail services. The Department renewed a threeyear contract with Glass-McClure Advertising of Sacramen<strong>to</strong> that expires inFY 2009-10. Contract services include strategic planning, media planning,68
Chapter IV – Marketing Programproduction and creative services, and media buys including the emerging onlinemarket.The Department formulates in conjunction with Amtrak a detailed plan for mediaexpenditures. The plan includes seasonal fare promotion campaigns that arecoordinated with Amtrak’s national campaigns and continues a successful strategyof targeting constituent groups with high likelihood of riding the train. Thesegroups have been identified through ongoing research conducted from within thetraveling public. Rider profiles help <strong>to</strong> guide the selection of media, the timesduring which it runs, and the appropriate message <strong>to</strong> motivate the target audience<strong>to</strong> consider trying the train. Current research reveals the following ridercharacteristics:Pacific Surfliner passengers:• 44 percent have an annual income greater than $75,000.• 50 percent have a four-year or higher college degree.• The majority are middle-aged or younger (ages <strong>18</strong> <strong>to</strong> 49).• 74 percent travel primarily for pleasure.San Joaquin passengers:• 47 percent have a household annual income of $50,000.• The majority are middle-aged and younger (ages <strong>18</strong> <strong>to</strong> 49).• 74 percent travel primarily for pleasure.Primary targets that address the rider profile include the mature market, families,and Hispanic persons. Important secondary targets include business travelers, solotravelers, and college students. While the majority of riders are middle-aged oryounger, the large number of leisure travelers makes the mature audience (thosewho have the time and discretionary income) a viable market segment.Price promotions appeal <strong>to</strong> a broad range of potential travelers whether studentstraveling <strong>to</strong> visit friends, single business travelers, or families. All these groupswill be targeted with campaigns and media addressing their particular travel needs.For example, television advertising features single persons and families, thusappealing <strong>to</strong> a broad range of potential travelers. Limited term price promotionscan offer an inducement for couples <strong>to</strong> travel (Free Companion Fare offers), or forindividuals and families <strong>to</strong> travel (across the board fare reductions). On-linewebsite special offers (reduced fares for short periods) reach an ever-growingbroad market segment that shop on the web for travel offers and <strong>to</strong> book trips.The limited term nature of the rail travel promotions encourages potential riders <strong>to</strong>make prompt travel arrangements.The Department’s advertising focuses on the virtues of train travel. This approachuses the “Travel Made Simple” concept for Amtrak <strong>California</strong> that combines an69
<strong>2007</strong>-<strong>08</strong> – <strong>2017</strong>-<strong>18</strong> <strong>California</strong> <strong>State</strong> <strong>Rail</strong> <strong>Plan</strong>emotional element reflecting train travel as a unique experience with price anddestination messages. This overall advertising concept will be modified whentailoring specific messages for each of the different target groups listed above.PUBLIC RELATIONS/OUTREACHThe public relations/outreach program is the grassroots part of the marketingprogram and is designed <strong>to</strong> work in conjunction with and support advertisingefforts. This allows for a cus<strong>to</strong>mized, corridor-specific program <strong>to</strong> be constructedfrom an array of the following activities.Special Promotions - Promotions have the advantage of using a tailored message<strong>to</strong> spotlight aspects of service of particular appeal <strong>to</strong> a corridor audience.Promotions will continue <strong>to</strong> include ticket giveaways in conjunction with mediabuys on local radio stations; arrangements with destinations that may includeovernight accommodations and tickets <strong>to</strong> a special event/theme park; and a varietyof cooperative efforts with well known promotional partners. These partnershipsoffer the chance for both parties <strong>to</strong> obtain exposure for their products whilesharing an audience and the cost of that exposure. Amtrak <strong>California</strong> partnershave included Holiday Inn, Sea World, Yosemite, Ringling Brothers Circus,Disneyland Resort, the Oakland Raiders, the Oakland A’s, <strong>California</strong> <strong>State</strong><strong>Rail</strong>road Museum, Six Flags Discovery Kingdom, and other organizations.Media Relations – This part of marketing includes press <strong>to</strong>urs, the production ofpress kits for special events, media familiarization trips, and the production oftravel and rail-related articles for publication. These activities are coordinatedwith Amtrak, and the Department’s Public Affairs Office and district officeswhere appropriate.Printed Materials - Making Tracks, the Amtrak <strong>California</strong> quarterly newsletter, isproduced and distributed on-board trains, in station racks, posted on the internetand by mail statewide. Collateral pieces, such as flyers and coupons, are designed<strong>to</strong> highlight various aspects of the service and are produced on demand. Examplesof these are posters promoting San Joaquins and Pacific Surfliner trains,a brochure advertising special packages <strong>to</strong> Yosemite, rack cards for special eventsand destination guides for the San Joaquins and Pacific Surfliner routes.Special Events - <strong>State</strong>-sponsored rail facilities and services have grown, andceremonial events marking this growth have been staged under the public relationsbanner. Such events introduce potential Amtrak cus<strong>to</strong>mers <strong>to</strong> the product, but theyalso generate important free publicity that may reach a different audience thanpaid advertising. The Department partners with Amtrak, chambers of commerceand other local agencies <strong>to</strong> organize these events.70
Chapter IV – Marketing ProgramGROUP TRAVELKids ‘n’ Trains - The Kids ‘n’ Trains Program teaches young people <strong>to</strong> learnabout train travel on the Pacific Surfliner and San Joaquin routes. The programpromotes field trips at a discounted fare for youth aged three <strong>to</strong> eighteen.Everyone in the group pays the same low fare for their round trip adventure bytrain.Originally, the goal of the program was <strong>to</strong> increase ridership at off-peak periods.Today the program offers an educational opportunity for the kids and theirchaperones <strong>to</strong> discover, explore, and learn about popular destinations in<strong>California</strong>, such as museums, zoos, and even the <strong>State</strong> Capi<strong>to</strong>l. The Kids ‘n’Trains Program’s popularity has increased steadily over the years. Last year’sridership increased <strong>18</strong>.7 percent on the Pacific Surfliner and increased 5.7 percen<strong>to</strong>n the San Joaquins from the previous year.Future plans include continued promotion of the program <strong>to</strong> educate childrenwhen they are young about the benefits of rail travel. These children also help usadvertise and promote rail travel by sharing their experiences with friends andfamily. For cus<strong>to</strong>mer convenience, online registration is being added <strong>to</strong> theAmtrak <strong>California</strong> web site effective fall <strong>2007</strong>.Senior Travel Program – The Pacific Surfliner and San Joaquins “All AboardSeniors!” Program was launched in January 2004. The program was patternedafter the successful Kids ‘n’ Trains Program and will continue <strong>to</strong> expand in thefuture. The program is designed <strong>to</strong> appeal <strong>to</strong> seniors who have discretionaryincome and can travel in off peak periods when ridership is low. Participation hasgrown through word of mouth and offers group discounts <strong>to</strong> a growing segment of<strong>California</strong>’s population that is predisposed <strong>to</strong> train travel according <strong>to</strong> ongoingresearch. For cus<strong>to</strong>mer convenience, online registration is being added <strong>to</strong> theAmtrak <strong>California</strong> web site fall <strong>2007</strong>.College Student Discount Travel Program – The Department and Amtrak willcontinue <strong>to</strong> sponsor a student discount program on the Pacific Surfliner andSan Joaquins routes. The program provides a 20-percent discount <strong>to</strong> students whoshow a student identification card from participating colleges. There are11 participating colleges and universities with easy access <strong>to</strong> Amtrak stations.The program introduces Amtrak travel <strong>to</strong> students who might otherwise travel bycar <strong>to</strong> and from campus. The Department collaborates with university officials <strong>to</strong>make promotional materials available on campus <strong>to</strong> students and parentsthroughout the school year. Amtrak advertising appears in the college onlinenewspapers <strong>to</strong> maintain awareness. Research suggests that college students have ahigh potential <strong>to</strong> become regular train travelers in their post college years. TheDepartment will continue <strong>to</strong> evaluate the effectiveness of this Program and expandit as other cost-effective partnerships with colleges and universities are identified.71
<strong>2007</strong>-<strong>08</strong> – <strong>2017</strong>-<strong>18</strong> <strong>California</strong> <strong>State</strong> <strong>Rail</strong> <strong>Plan</strong>RAIL SAFETYThe goal of the Department’s rail safety program is <strong>to</strong> educate the public aboutsafe behavior at railroad crossings and the dangers of trespassing on railroadrights-of-way. The Department coordinates its rail safety activities with the<strong>California</strong> affiliate of Operation Lifesaver, a national nonprofit railroad safetyorganization.<strong>California</strong> Operation Lifesaver is a coalition of railroads, Federal/<strong>State</strong> and localagencies, private businesses, and individuals concerned about promoting railsafety. The Department plans <strong>to</strong> expand the program by producing anddistributing packages of rail safety materials written in foreign languages,including a video for the farm worker community in the San Joaquin Valley;procuring “no trespassing” signs for use by the railroads’ law enforcement; andpartnering with communities along all three <strong>State</strong> routes <strong>to</strong> host <strong>Rail</strong> Safety Weekevents.MARKET RESEARCHThe Department contracts with Amtrak for market research services. With theDepartment’s participation, Amtrak contracts with various market research firms<strong>to</strong> measure cus<strong>to</strong>mer attitudes, desires and preferences in order <strong>to</strong> match services<strong>to</strong> cus<strong>to</strong>mer needs. Profiles are also created of typical riders covering income,ethnicity, travel frequency and trip purpose, among other things.Market research has included seasonal on board surveys; telephone surveys ofnon-users; license plate surveys <strong>to</strong> obtain data for ridership, modeling, andadvertising; and promotion tracking studies. The Department has examinedalternative family fare structures, participated in Amtrak’s Pacific Coast MarketStudy, conducted research in<strong>to</strong> the usage of the <strong>California</strong> <strong>Rail</strong> Pass, studied thePacific Surfliners’ Pacific Business Class, surveyed Metrolink and Coaster usersof the “<strong>Rail</strong> 2 <strong>Rail</strong>” program, and performed the Pacific Surfliner parking analysis.The annual research plan includes a contingency fund designed <strong>to</strong> conduct spotresearch on subjects that arise during the course of a given year. In 20<strong>08</strong>,the Department and Amtrak will make improvements <strong>to</strong> the readability oftimetable collateral material from a cus<strong>to</strong>mer’s perspective using focus groups.RAIL RIDERSHIP/REVENUE FORECASTING MODELThe Department contracts with Amtrak for operation and development of the<strong>Rail</strong> Ridership/Revenue Forecasting Model. It is used by the Department, Amtrakand CCJPA <strong>to</strong> estimate the ridership and revenue impacts of major servicechanges, such as new services, route extensions or truncations, frequency changes,and fare changes, as well as <strong>to</strong> help project future ridership and revenue onexisting services.72
Chapter IV – Marketing ProgramThe first stage of the model predicts <strong>to</strong>tal travel volumes for each origindestinationpair. The second stage predicts the share of intercity travel that isexpected <strong>to</strong> use each available modal alternative (au<strong>to</strong>mobile, rail) in the future.Both model stages are conditional on the characteristics of the modal services <strong>to</strong>be offered and the characteristics of the population. The model is consistentlychecked for accuracy through comparison of incremental ridership and revenueforecasts of near term service changes with the actual ridership and revenueincrements resulting from the initiative.Travel service characteristics are the key independent variable in the model,including travel time, travel cost, frequency (for rail) and time of day.The Department’s geographic information system (GIS) based intercity highwaynetwork provided the basis for highway travel times, distances and costs.The intercity rail travel characteristics are based on published timetables, ridershipand revenue data provided by both the Department and Amtrak.Highway and rail surveys provide the basis for quantifying the existing travelmarket. Over 700,000 au<strong>to</strong> and rail surveys were distributed between 1992 and2006 across <strong>California</strong>, with over 130,000 surveys returned. The goal of both setsof surveys was <strong>to</strong> understand the travel patterns and develop demographic profilesfor intercity travelers within <strong>California</strong>. This information is used in guiding thestrategic planning process by which annual marketing plans are developed.CAPITOL CORRIDOR MARKETING PROGRAMThe CCJPA’s FY <strong>2007</strong>/<strong>08</strong>-FY 20<strong>08</strong>/09 Business <strong>Plan</strong> Update states that:The CCJPA uses a combination of grassroots local marketing efforts andbroad-based joint media campaigns <strong>to</strong> build awareness of the Capi<strong>to</strong>l Corridorservice. Marketing dollars and impact are maximized through joint promotionsand advertising as well as reciprocal marketing programs with the <strong>State</strong>,Amtrak, CCJPA member agencies, and other selected partners. A primaryobjective is <strong>to</strong> promote the service <strong>to</strong> key markets and attract riders <strong>to</strong> trainswith available capacity.The CCJPA will pursue the following initiatives in <strong>2007</strong>-<strong>08</strong>, 20<strong>08</strong>-09 and beyond20<strong>08</strong>-09:FY <strong>2007</strong>-<strong>08</strong> MARKETING PROGRAMThe CCJPA’s FY <strong>2007</strong>-<strong>08</strong> Marketing Program will focus on meeting the increasedridership projections using marketing strategies based on our existing core service.Programs will be developed <strong>to</strong> target the markets most likely <strong>to</strong> benefit from theCapi<strong>to</strong>l Corridor’s FY 2006-07 service expansions. The CCJPA will continue itsindependent campaigns, but will coordinate with Amtrak and Caltrans on the mostbeneficial promotions and shared marketing collateral. Advertising media willconsist primarily of radio traffic sponsorships, online web banner campaigns, and73
<strong>2007</strong>-<strong>08</strong> – <strong>2017</strong>-<strong>18</strong> <strong>California</strong> <strong>State</strong> <strong>Rail</strong> <strong>Plan</strong>promotionally driven media buys, all of which will be tested for advertisingeffectiveness. Specific marketing programs will target the markets most likely <strong>to</strong>benefit from recent service expansions. Marketing initiatives will also aim <strong>to</strong>enhance the distinctiveness and visibility of the Capi<strong>to</strong>l Corridor brand.Key elements will include:• Introduction of a new Capi<strong>to</strong>l Corridor logo on all advertising and collateral <strong>to</strong>update the image of the service and enhance brand recognition.• Advertising messages and creative that reflect the CCJPA’s emphasis on theCapi<strong>to</strong>l Corridor as a distinct service brand.• Joint media promotions with well-known organizations <strong>to</strong> maximize mediadollars and expand market reach.• Reciprocal marketing with <strong>to</strong>urism industry members such as hotels, airports,and convention/visi<strong>to</strong>r bureaus.• Targeted marketing <strong>to</strong> school groups, senior citizens, special interest groups,and new residential communities.• Outreach and public relations efforts in the Silicon Valley/San Jose area <strong>to</strong>build awareness of recent service expansion.• Promotional partnerships will be leveraged <strong>to</strong> build loyalty among currentpassengers and awareness <strong>to</strong> new market groups.FY 20<strong>08</strong>-09 MARKETING PROGRAMThe CCJPA will place continued emphasis on the Capi<strong>to</strong>l Corridor brand <strong>to</strong>increase regional brand awareness and maximize use of the marketing budget.Creative execution will emphasize local character and personalize the service.CCJPA will build upon successful campaigns and promotions of previous years,but will also seek out innovative approaches <strong>to</strong> grow ridership <strong>to</strong> meet businessgoals. CCJPA will continue cus<strong>to</strong>mer retention activities, with efforts that buildloyalty and enhance communication.• Primary advertising media will be radio and online, with close attention paid <strong>to</strong>return-on-investment and shifts in the advertising market.• Media-inclusive promotional partnerships will serve <strong>to</strong> extend the advertisingbudget.• Marketing partnerships with companies and organizations along the serviceroute <strong>to</strong> drive ridership and awareness of Capi<strong>to</strong>l Corridor.• Improve cus<strong>to</strong>mer communications, including increased public relations effortsand website enhancements.74
Chapter IV – Marketing ProgramBEYOND FY 20<strong>08</strong>-09CCJPA aims <strong>to</strong> grow awareness of the Capi<strong>to</strong>l Corridor within theSacramen<strong>to</strong>/Sierra Foothills, San Francisco Bay Area and San Jose markets,through use of traditional advertising, community involvement, promotionalefforts and creative marketing partnerships. With the current marketing budget,the CCJPA’s ability <strong>to</strong> achieve desired visibility through media campaigns in theseNorthern <strong>California</strong> markets is constrained. Additional marketing funds will beneeded <strong>to</strong> sustain current levels of advertising impressions and <strong>to</strong> support furtherdevelopment of specific market segments.Marketing activities will be closely aligned with goals for ridership projections,with efforts focusing on attracting riders <strong>to</strong> trains with available capacity, and oncus<strong>to</strong>mer retention. Given projected ridership increases, CCJPA will likely pursuea cus<strong>to</strong>mer relations management (CRM) approach <strong>to</strong> maintain and enhancecus<strong>to</strong>mer communications and marketing campaigns. As additional trainequipment arrives and creates new opportunities for ridership growth, themarketing activities will shift <strong>to</strong> emphasize further cus<strong>to</strong>mer acquisition.75
<strong>2007</strong>-<strong>08</strong> – <strong>2017</strong>-<strong>18</strong> <strong>California</strong> <strong>State</strong> <strong>Rail</strong> <strong>Plan</strong>Figure 5A76
Chapter V – The <strong>California</strong> Passenger <strong>Rail</strong> NetworkCHAPTER VTHE CALIFORNIA RAIL NETWORKThis chapter describes the <strong>California</strong> rail network and the <strong>State</strong>’s responsibilityregarding this network. Figure 5A is a map of the intercity and commuter railpassenger systems in <strong>California</strong>, Figure 5B summarizes all of the intercity,commuter, and urban rail services in <strong>California</strong>, and Figure 5C is a summary ofintercity and commuter rail ridership in <strong>California</strong> from 1974-2006.RAIL SERVICES IN CALIFORNIAThe <strong>State</strong> rail system combines intercity, commuter, and freight rail. Intercity railincludes state-supported corridor routes and Amtrak long-distance routes.All three systems share the same infrastructure that is generally owned by privaterailroads, and in some cases, public entities. Because these systems share thesame infrastructure, joint planning and policy development increases theefficiency and effectiveness of the system, and help make infrastructuredevelopment and maintenance more cost effective. For this reason, this <strong>Plan</strong>focuses on these rail components of the larger transportation system in <strong>California</strong>.Amtrak funds and operates “basic system” long-distance (usually interstate) railroutes. Four long-distance routes operate in <strong>California</strong> (Coast Starlight,<strong>California</strong> Zephyr, Southwest Chief, and Sunset Limited). The <strong>State</strong> funds three<strong>State</strong>-supported intercity rail routes. The Department administers thePacific Surfliners and San Joaquins and the CCJPA administers theCapi<strong>to</strong>l Corridor. Amtrak operates these routes under contract with either the<strong>State</strong> or the CCJPA. Regional agencies fund and administer the four commuterrail systems in <strong>California</strong> (Caltrain, ACE, Metrolink, and Coaster).The freight rail system in <strong>California</strong> is primarily operated by two privately ownedClass I railroads: the Union Pacific <strong>Rail</strong>road (UP) and the BNSF <strong>Rail</strong>way (BNSF).Also, one Class II regional railroad and 27 Class III shortline railroads operatefreight rail service in <strong>California</strong>.Amtrak’s long-distance routes are discussed in more detail later in this Chapter.The three <strong>State</strong>-supported intercity rail routes are discussed in Chapters VI, VII,and VIII and commuter rail services are discussed in Chapter IX. Freight rail isdiscussed in detail in Part II of this <strong>Plan</strong> (Chapters XII – XVII).77
<strong>2007</strong>-<strong>08</strong> – <strong>2017</strong>-<strong>18</strong> <strong>California</strong> <strong>State</strong> <strong>Rail</strong> <strong>Plan</strong>Figure 5BRAIL PASSENGER SERVICES IN CALIFORNIAService Type Opera<strong>to</strong>r Service Name Service AreaIntercity <strong>Rail</strong>road AmtrakPacific Surfliner* San Luis Obispo-Santa Barbara-Los Angeles-San Diego<strong>Rail</strong>(100% <strong>State</strong>San JoaquinBay Area/Sacramen<strong>to</strong>-Fresno-BakersfieldSupported) Capi<strong>to</strong>l Corridor Auburn-Sacramen<strong>to</strong>-Oakland-San JoseAmtrakCoast StarlightLos Angeles-Oakland-Sacramen<strong>to</strong>-SeattleSystem<strong>California</strong> Zephyr Emeryville-Sacramen<strong>to</strong>-Denver-Omaha-Chicago(100 % Amtrak Southwest Chief Los Angeles-Kansas City-ChicagoSupported)Sunset LimitedLos Angeles-Hous<strong>to</strong>n-New OrleansPacific Surfliner* San Luis Obispo-Santa Barbara-Los Angeles-San DiegoCommuter <strong>Rail</strong>road Peninsula Corridor Peninsula Commute<strong>Rail</strong>Joint Powers Board Service (Caltrain)San Francisco-San Jose-GilroySan Joaquin Regional Altamont Commuter<strong>Rail</strong> Commission Express (ACE)S<strong>to</strong>ck<strong>to</strong>n-Livermore-Fremont-San JoseSouthern <strong>California</strong>Regional <strong>Rail</strong>AuthorityUrban <strong>Rail</strong>TransitHeavy<strong>Rail</strong>TransitLight<strong>Rail</strong>TransitCableCarNorth County TransitDistrictSan Francisco BayArea Rapid TransitDistrictLos Angeles CountyMetropolitanTransportationAuthoritySacramen<strong>to</strong> RegionalTransit DistrictSan FranciscoMunicipal <strong>Rail</strong>waySanta Clara ValleyTransportationAuthorityLos Angeles CountyMetropolitanTransportationAuthoritySan Diego Trolley,Inc.San FranciscoMunicipal <strong>Rail</strong>wayMetrolink:Ventura County LineAntelope Valley LineSan Bernardino LineRiverside LineOrange County LineInland Empire-Orange County Line91 LineCoasterBARTMetro <strong>Rail</strong>:Red LineRed Line* - <strong>State</strong> supports 70% of all service; Amtrak supports 30%.RT Light <strong>Rail</strong>:Gold LineBlue LineMuni Metro:F - Market-WharvesJ - ChurchK - InglesideL - TaravalM - OceanviewN – JudahVTA Light <strong>Rail</strong>Metro <strong>Rail</strong>:Blue LineGold LineGreen LineSan Diego Trolley:Blue LineOrange LineGreen LineMuni Cable CarLos Angeles-Oxnard-MontalvoLos Angeles-Palmdale-LancasterLos Angeles-Claremont-San BernardinoLos Angeles-Pomona-RiversideLos Angeles-Santa Ana-OceansideSan Bernardino-Santa Ana-OceansideLos Angeles-Fuller<strong>to</strong>n-RiversideOceanside-Solana Beach-San DiegoRichmond-Oakland-San Francisco-Daly CityFremont-Oakland-San Francisco-Daly CityRichmond-Oakland-FremontPittsburg/Bay Point-San Francisco-Daly CityDublin/Pleasan<strong>to</strong>n-Coliseum/Oakland Airport-San Francisco-San Francisco Airport-MillbraeLos Angeles-Hollywood/Vine-North HollywoodLos Angeles-Wilshire/WesternSacramen<strong>to</strong>-Sunrise-FolsomWatt/I-80-Sacramen<strong>to</strong>-MeadowviewFisherman’s Wharf-CastroFerry Building-Noe Valley-Balboa ParkFerry Building-Ingleside District-Balboa ParkFerry Building-San Francisco ZooFerry Building-Oceanview District-Balboa ParkCaltrain Station-Ocean BeachAlum Rock-Tasman-San Jose-Santa TeresaMountain View-Tasman-San Jose-WinchesterOholne/Chynoweth-AlmadenLos Angeles-Comp<strong>to</strong>n-Long BeachLos Angeles-Highland Park-PasadenaRedondo Beach-Aviation/LAX-Lynwood-NorwalkOld Town-San Diego-San YsidroSan Diego-El Cajon-Gillespie FieldOld Town-Qualcomm Stadium-SDSU-Santee<strong>California</strong> StreetPowell-Mason/Hyde78
Chapter V - The <strong>California</strong> Passenger <strong>Rail</strong> NetworkFigure 5CCalendarYearANNUAL INTERCITY AND COMMUTER RAIL RIDERSHIP IN CALIFORNIADOES NOT INCLUDE RIDERSHIP ON AMTRAK LONG DISTANCE TRAINS NOT SUPPORTED BY THE STATE OF CALIFORNIAINTERCITY ROUTES COMMUTER SERVICESPacificSurfliner 1 San Joaquin Capi<strong>to</strong>lCorridorTotal Caltrain Metrolink Coaster ACE Total Grand Total1974 392,170 75,360 467,530 2 --1975 353,590 64,110 417,700 2 --1976 465,250 73,070 538,320 2 --1977 688,260 86,584 774,844 2 --1978 817,566 78,345 895,911 4,341,011 4,341,011 5,236,9221979 1,169,978 96,399 1,266,377 5,699,406 5,699,406 6,965,7831980 1,253,387 155,587 1,4<strong>08</strong>,974 6,112,890 6,112,890 7,521,8641981 3 1,<strong>18</strong>8,681 <strong>18</strong>3,235 1,371,916 5,895,129 5,895,129 7,267,0451982 3 1,216,327 <strong>18</strong>0,030 1,396,357 5,195,819 5,195,819 6,592,1761983 3 1,259,<strong>18</strong>8 214,928 1,474,116 5,009,130 5,009,130 6,483,2461984 1,215,026 257,633 1,472,659 5,232,827 5,232,827 6,705,4861985 1,335,007 286,105 1,621,112 5,384,013 5,384,013 7,005,1251986 1,432,700 282,414 1,715,114 5,416,303 5,416,303 7,131,4171987 1,530,728 324,627 1,855,355 5,540,630 5,540,630 7,395,9851988 1,744,576 355,768 2,100,344 5,600,582 5,600,582 7,700,9261989 1,690,248 361,258 2,051,506 5,790,712 5,790,712 7,842,2<strong>18</strong>1990 1,690,759 538,061 2,228,820 6,970,696 6,970,696 9,199,5161991 1,562,282 507,242 10,220 2,079,744 7,111,365 7,111,365 9,191,1091992 1,665,158 510,279 271,959 2,447,396 6,833,290 165,466 6,998,756 9,446,1521993 1,638,159 530,257 300,409 2,468,825 6,889,941 1,889,980 8,779,921 11,248,7461994 1,578,946 561,674 371,919 2,512,539 7,021,<strong>18</strong>2 4,132,625 11,153,807 13,666,3461995 1,441,925 5<strong>18</strong>,737 357,123 2,317,785 7,143,091 4,645,561 514,453 12,303,105 14,620,8901996 1,574,896 578,059 480,555 2,633,510 7,765,115 5,688,814 850,999 14,304,928 16,938,4381997 1,650,411 715,103 488,150 2,853,664 8,367,683 6,314,368 945,739 15,627,790 <strong>18</strong>,481,4541998 1,559,997 665,067 464,903 2,689,967 8,643,158 6,745,282 1,132,445 67,222 16,588,107 19,278,0741999 1,547,049 675,713 552,063 2,774,825 8,990,864 7,229,677 1,251,238 424,988 17,896,767 20,671,5922000 1,594,<strong>18</strong>9 683,889 878,960 3,157,038 10,267,000 8,062,573 1,<strong>18</strong>3,058 714,259 20,226,890 23,383,9282001 1,737,532 713,<strong>08</strong>7 1,063,994 3,514,613 10,497,640 8,522,555 1,258,263 922,976 21,201,434 24,716,0472002 1,796,442 741,497 1,104,274 3,642,213 4 8,978,675 8,979,107 1,300,047 803,522 20,061,351 23,703,5642003 2,228,042 783,096 1,140,561 4,151,699 4 8,107,324 9,099,985 1,366,479 607,017 19,<strong>18</strong>0,805 23,332,5042004 2,431,<strong>08</strong>5 747,574 1,192,152 4,370,811 4 8,768,157 9,786,531 1,474,360 640,753 20,669,801 25,040,6122005 2,520,444 755,851 1,260,249 4,536,544 9,867,498 10,245,609 1,485,125 667,029 22,265,261 26,801,8052006 2,667,969 799,742 1,306,102 4,773,813 10,510,344 10,797,506 1,544,976 676,050 23,528,876 28,302,6891 Designated the San Diegan Route prior <strong>to</strong> May 21, 2000.2 Data not available.3 Pacific Surfliner ridership shown above includes the following Spirit of <strong>California</strong> ridership: 1981 (17,533), 1982 (80,360) and 1983 (64,751).4 To facilitate the implementation of "Baby Bullet" service, Caltrain suspended weekend service between July 3, 2002 and June 4, 2004, resulting in a dropin ridership. Weekend service was reestablished on June 5, 2004.79
<strong>2007</strong>-<strong>08</strong> – <strong>2017</strong>-<strong>18</strong> <strong>California</strong> <strong>State</strong> <strong>Rail</strong> <strong>Plan</strong>Urban rail transit systems in <strong>California</strong> do not share the same infrastructure withintercity, commuter and freight rail. These systems are locally controlled andfunded, and for this reason planning for these systems is not covered in this <strong>Plan</strong>.These systems include five different light rail systems; (Sacramen<strong>to</strong>,San Francisco, San Jose, Los Angeles, and San Diego), two urban heavy railsystems; BART, the Los Angeles County Metropolitan Transit Association(LACMTA) Metro <strong>Rail</strong> Red Line; and the San Francisco Municipal <strong>Rail</strong>wayCable Car. For a further discussion of these systems see Figure 5B.To further the implementation of a safe, integrated, multi-modal, transportationsystem, it is essential that the intercity and commuter rail systems be wellintegrated with the urban transit rail and bus systems. The <strong>State</strong> encourages localand regional planning agencies <strong>to</strong> share their ideas and concerns regardingintercity rail service in their respective service areas, and multi-modal integrationand connectivity is discussed throughout this <strong>Plan</strong>.THE STATE’S ROLE IN RAIL PASSENGER SERVICEINTERCITY RAIL SERVICESIntercity passenger rail service is a component of the <strong>State</strong>’s overall transportationsystem and operates between several regions of the <strong>State</strong>. Service is providedbetween metropolitan areas and <strong>to</strong> rural areas in the <strong>State</strong>. In <strong>California</strong>, Amtrakoperates all <strong>State</strong>-supported intercity rail service under the provisions of theFederal <strong>Rail</strong> Passenger Service Act (49 U.S.C. 24101). All three intercity railroutes were funded, planned and administered by the <strong>State</strong> until July 1998 whenthe CCJPA assumed administration of the Capi<strong>to</strong>l Corridor. The <strong>State</strong> continues<strong>to</strong> fund the operation of the Capi<strong>to</strong>l Corridor, and fund and administer thePacific Surfliner and San Joaquin Routes. For more information on Amtrak’srelationship with the Department and the CCJPA, see Chapter XI. For moreinformation on the intercity rail operations budget see Chapter III.The <strong>State</strong> also pays for the majority of capital improvements <strong>to</strong> intercity railservices. For detailed information on the intercity rail capital program seeChapter II. For information on intercity rail funding sources see Chapter XII.Figure 5D is a map of the three <strong>State</strong>-supported routes.COMMUTER RAIL SERVICESCommuter rail operates primarily within a single region of the Sate, servingregional and local transportation needs. Because commuter rail services primarilyserve local and regional transportation needs, they are planned and administeredby local and regional transportation agencies. Various sources of funding areavailable at the local, <strong>State</strong>, and Federal levels. Some capital funding is providedby the <strong>State</strong> through the <strong>State</strong> Transportation Improvement Program, and other80
Chapter V – The <strong>California</strong> Passenger <strong>Rail</strong> Networksources, but operating funding is provided by the local and regional agencies. Formore information on commuter rail services see Chapter IX.DEFINITION OF COMMUTER VERSUS INTERCITY RAILThe Federal <strong>Rail</strong> Passenger Service Act (RPSA) and subsequent legal decisionsdefine commuter and intercity rail service.The RPSA (49 U.S.C. 24102) states that:“Commuter rail passenger transportation” means short-haul railpassenger transportation in metropolitan and suburban areas usuallyhaving reduced fare, multiple-ride, and commuter tickets and morning andevening peak period operations.The Penn Central Transportation Company Discontinuance decision (338 ICC3<strong>18</strong>) was issued by the Interstate Commerce Commission (ICC) after a 1971investigation held <strong>to</strong> determine whether certain trains constituted commuterservice, thus placing them outside the jurisdiction of Amtrak, which at the timehad just been created.Specifically, the ICC concluded that a commuter service would likely includesome or all of the following features:• The passenger service is primarily being used by patrons traveling on aregular basis either within a metropolitan area or between a metropolitanarea and its suburbs.• The service is usually characterized by operations performed at morningand evening peak periods of travel.• The service usually honors commutation or multiple-ride tickets at a farereduced below the ordinary coach fare and carries the majority of itspatrons on such a reduced fare basis.• The service makes several s<strong>to</strong>ps at short intervals either within a zone oralong the entire route.• The equipment used may consist of little more than ordinary coaches.• The service should not extend more than 100 miles at the most, except inrare instances; although service over shorter distances may not becommuter or short haul within the meaning of this exclusion.The RPSA (49 U.S.C. 24102) also states that:• “Intercity rail passenger transportation” means rail passengertransportation, except commuter rail passenger transportation.81
<strong>2007</strong>-<strong>08</strong> – <strong>2017</strong>-<strong>18</strong> <strong>California</strong> <strong>State</strong> <strong>Rail</strong> <strong>Plan</strong>Figure 5D82
Chapter V – The <strong>California</strong> Passenger <strong>Rail</strong> NetworkThus, both the RPSA and the ICC specifically defined commuter rail service in themanner detailed above, and stated that intercity rail service is all other service notfalling within the commuter rail definition. The inclusion of <strong>State</strong>-supported railservices under the RPSA definition of "intercity" is critical because Amtrak hasthe right under the RPSA <strong>to</strong> access freight railroad tracks at incremental cost forthe operation of intercity rail passenger services.Currently, there is no definition in <strong>State</strong> law for commuter or intercity rail service.Prior definitions, which essentially referred <strong>to</strong> the Federal definitions, were deletedunder Chapter 622, Statutes of 1997 (SB 45 - Kopp).AMTRAK SYSTEM SERVICESCurrently, Amtrak operates long-distance trains on five routes in <strong>California</strong> thatlink <strong>California</strong> with other states. These trains are fully funded by Amtrak and alsoprovide varying levels of intrastate service within <strong>California</strong>.The Pacific Surfliner Route is unique because it is partially Amtrak funded andpartially <strong>State</strong>-supported.The following describes the long distance routes serving <strong>California</strong> and theirsignificance <strong>to</strong> the <strong>State</strong>’s transportation needs. Ridership figures are forFFY 2005-06 and include the <strong>to</strong>tal route ridership, not just the portion in<strong>California</strong>. Figure 5E is a map displaying the Amtrak long distance routes in<strong>California</strong>.ROUTE DESCRIPTIONSPacific Surfliner Route (San Luis Obispo-Los Angeles-San Diego)Ridership on the Pacific Surfliner Route is only exceeded by service in theNortheast Corridor operating between Bos<strong>to</strong>n, New York, and Washing<strong>to</strong>n, D.C.Eleven round trips operate on Monday through Thursday, and twelve operate onFriday through Sunday between Los Angeles and San Diego. Five daily roundtripsare extended north between Los Angeles and Santa Barbara, withtwo continuing on <strong>to</strong> San Luis Obispo. Amtrak pays for 30 percent of the entireservice while the <strong>State</strong> pays for the remaining 70 percent of the service.Ridership in FFY 2005-06 was 2,657,773, an increase of 5.4 percent from theprevious year. Chapter VI discusses this route in detail.83
<strong>2007</strong>-<strong>08</strong> – <strong>2017</strong>-<strong>18</strong> <strong>California</strong> <strong>State</strong> <strong>Rail</strong> <strong>Plan</strong>Figure 5E84
Chapter V – The <strong>California</strong> Passenger <strong>Rail</strong> NetworkCoast Starlight (Los Angeles-Oakland-Sacramen<strong>to</strong>-Portland-Seattle)The Coast Starlight’s daily round-trip is the most popular long distance train in theAmtrak system. For many years, demand has often outstripped capacity duringsummer and holiday travel periods. A substantial portion of the Route’s ridershipis generated by intrastate <strong>California</strong> travel. The Route provides the only railservice north from Sacramen<strong>to</strong> <strong>to</strong> Redding and Oregon, and the only through railservice from the Bay Area <strong>to</strong> Los Angeles. Direct connections with thePacific Surfliner at Los Angeles effectively extend the route south <strong>to</strong> San Diego.Connections with the San Joaquins at Sacramen<strong>to</strong> and Martinez provideCentral Valley access for travelers <strong>to</strong> and from the north. Portland and Seattle arekey s<strong>to</strong>ps <strong>to</strong> the north. Ridership in FFY 2005-06 on the service’s one dailyround-trip <strong>to</strong>taled 331,939, a decrease of 10.8 percent from the previous year.<strong>California</strong> Zephyr (Emeryville-Sacramen<strong>to</strong>-Reno-Denver-Chicago)The <strong>California</strong> Zephyr provides daily round-trip regional service in theEmeryville-Sacramen<strong>to</strong>-Reno corridor; extra coaches are often operated on thisportion of the route <strong>to</strong> handle heavy loads <strong>to</strong> and from Reno. Connecting buseslink Emeryville with San Francisco. A s<strong>to</strong>p in Truckee serves Lake Tahoe andnearby Sierra ski areas. Salt Lake City, Denver, Lincoln and Omaha are also s<strong>to</strong>pson the route <strong>to</strong> Chicago. Ridership in FFY 2005-06 was 335,443, n decrease of3.6 percent from the prior year.Southwest Chief (Los Angeles-Albuquerque-Kansas City-Chicago)The daily round-trip Southwest Chief provides the only rail service in <strong>California</strong>from Los Angeles east <strong>to</strong> Vic<strong>to</strong>rville, Bars<strong>to</strong>w and Needles. The Route continues<strong>to</strong> the Grand Canyon at Flagstaff and <strong>to</strong> Albuquerque, Kansas City, and Chicago.Ridership was 300,416 in FFY 2005-06, an increase of 1.7 percent from theprior year.Sunset Limited (Los Angeles-San An<strong>to</strong>nio-New Orleans-Orlando)The Sunset Limited operates three days a week in each direction and is the onlyrail service <strong>to</strong> Palm Springs. It continues east, connecting <strong>California</strong> <strong>to</strong> Tucson,El Paso, San An<strong>to</strong>nio, Hous<strong>to</strong>n, and New Orleans. It is Amtrak’s onlytranscontinental passenger train. The Texas Eagle, which links Chicago withSan An<strong>to</strong>nio, carries through-cars <strong>to</strong> and from the Sunset Limited. Ridership inFFY 2005-06 was 51,860, a decrease of 36.2 percent from the previous year.It should be noted that this train formerly continued <strong>to</strong> Mobile, Jacksonville andOrlando but has had a truncated route since Hurricane Katrina.AMTRAK RIDERSHIP BY STATIONFigure 5F shows ridership at each Amtrak train and bus station in <strong>California</strong> forFFYs 2002-03 through 2005-06. This table includes ridership on <strong>State</strong>-supportedtrains and buses as well as Amtrak’s long distance routes. Stations with ticketagent or checked baggage services are also identified.85
<strong>2007</strong>-<strong>08</strong> – <strong>2017</strong>-<strong>18</strong> <strong>California</strong> <strong>State</strong> <strong>Rail</strong> <strong>Plan</strong>Figure 5FAMTRAK TRAIN AND BUS RIDERSHIP BY STATIONFEDERAL FISCAL YEARS 2002-03 TO 2005-0605-06 Station County Ridership Ridership Ridership Ridership Route Serving Station*Rank 2005-06 2004-05 2003-04 2002-03 PS SJ CC CSCZTESC SL Services1 L. A. Union Station Los Angeles 1,616,670 1,576,145 1,489,170 1,440,484 TB B T T T T A, Bg2 Sacramen<strong>to</strong> Sacramen<strong>to</strong> 1,<strong>08</strong>0,667 1,072,278 1,016,058 1,007,172 TB T T T A, Bg3 San Diego San Diego 884,509 854,361 796,288 753,406 TB B A, Bg4 Bakersfield Kern 709,800 681,034 666,635 697,573 B T A, Bg5 Emeryville Alameda 670,420 691,523 651,715 678,675 T T T T A, Bg6 Irvine Orange 594,324 565,147 474,125 350,955 T A7 Fuller<strong>to</strong>n Orange 4<strong>18</strong>,264 405,654 378,717 332,288 T T A, Bg8 Solana Beach San Diego 414,233 400,981 378,530 346,069 TB B A, Bg9 Davis Yolo 371,4<strong>08</strong> 344,696 3<strong>18</strong>,299 315,072 B T T T A, Bg10 Martinez Contra Costa 336,642 341,555 328,026 333,146 T T T T A, Bg11 Anaheim Orange 325,419 317,022 291,261 248,636 T A, Bg12 Oakland Alameda 324,513 331,340 321,045 329,092 T TB T B A, Bg13 Santa Barbara Santa Barbara 317,625 270,<strong>08</strong>0 294,358 284,976 TB B B T A, Bg14 Oceanside San Diego 309,0<strong>08</strong> 304,999 310,590 329,517 TB B A, Bg15 S<strong>to</strong>ck<strong>to</strong>n Amtrak San Joaquin 285,124 277,769 265,870 279,619 TB A, Bg16 Fresno Fresno 274,024 260,657 242,931 261,541 T A, Bg17 San Juan Capistrano Orange 259,825 258,243 262,412 268,290 TB B A<strong>18</strong> San Francisco San Francisco 250,372 2<strong>08</strong>,716 196,634 196,892 B B B B A, Bg19 Richmond Contra Costa 238,893 223,029 203,687 170,477 T T20 San Jose Santa Clara 2<strong>18</strong>,405 209,683 205,753 221,103 B TB T A, Bg21 Santa Ana Orange 172,795 175,530 174,824 <strong>18</strong>0,514 TB B A, Bg22 Hanford Kings 170,482 158,359 151,125 159,515 T A, Bg23 San Luis Obispo San Luis Obispo 126,556 109,538 89,985 90,391 TB B B T A, Bg24 Suisun-Fairfield Solano 115,8<strong>18</strong> 117,240 1<strong>08</strong>,825 101,716 T25 Merced Merced 92,434 88,930 86,774 94,646 T A, Bg26 Oxnard Ventura 86,243 81,423 92,044 95,295 TB B T A, Bg27 Berkeley Alameda 82,409 73,993 63,840 63,603 T28 Van Nuys Los Angeles 81,093 72,252 79,425 78,404 TB B A, Bg29 Great America Santa Clara 78,850 75,106 72,570 82,095 TB30 Modes<strong>to</strong> Stanislaus 76,778 71,986 73,296 73,658 T A, Bg31 Goleta Santa Barbara 73,538 66,531 45,666 30,299 T32 Roseville Placer 63,977 70,373 66,<strong>18</strong>9 66,377 TB T33 Chatsworth Los Angeles 50,628 44,432 46,365 41,749 TB34 Auburn Placer 46,223 43,239 45,773 46,213 B TB35 Burbank Airport Los Angeles 44,554 36,130 36,989 38,988 T B36 Ventura Ventura 44,146 37,898 38,002 34,581 TB B37 Glendale Los Angeles 42,734 42,734 47,902 51,290 TB B T38 Simi Valley Ventura 40,605 36,512 41,455 48,029 TB B T39 S<strong>to</strong>ck<strong>to</strong>n ACE San Joaquin 36,369 26,971 27,891 29,878 TB A, Bg40 Rocklin Placer 31,946 32,645 34,982 39,582 B TB41 Fremont Alameda 28,487 29,521 28,001 26,496 B TB42 Salinas Monterey 27,586 25,425 27,920 28,352 B B T A, Bg43 Camarillo Ventura 25,914 21,338 <strong>18</strong>,730 13,911 T44 Hayward Alameda 24,058 23,764 23,776 23,670 TB45 Corcoran Kings 23,<strong>08</strong>6 23,469 22,817 23,831 T46 Antioch-Pittsburg Contra Costa 22,747 21,204 20,732 20,463 T47 Chico Butte 22,550 <strong>18</strong>,155 17,177 16,8<strong>08</strong> B B T48 Grover Beach San Luis Obispo 21,821 <strong>18</strong>,882 16,836 16,927 TB B B49 Carpinteria Santa Barbara <strong>18</strong>,797 15,880 17,211 14,<strong>08</strong>6 TB B50 Old Town San Diego San Diego 17,898 <strong>18</strong>,295 1,505 T51 San Bernardino San Bernardino 17,484 16,069 19,112 20,354 B T52 Redding Shasta 15,473 14,<strong>08</strong>2 <strong>18</strong>,168 <strong>18</strong>,049 B B T* Route and Symbol Key:PS Pacific Surfliner (San Luis Obispo-Los Angeles-San Diego) CZ <strong>California</strong> Zephyr (Emeryville-Chicago)SJ San Joaquin (Bay Area/Sacramen<strong>to</strong>-Fresno-Bakersfield) TE Texas Eagle (Los Angeles-Chicago)CC Capi<strong>to</strong>l Corridor (Auburn-Sacramen<strong>to</strong>-Oakland-San Jose) SC Southwest Chief (Los Angeles-Chicago)CS Coast Starlight (Los Angeles-Oakland-Sacramen<strong>to</strong>-Seattle) SL Sunset Limited (Los Angeles-Orlando)T Train at this location TB Train and bus at this locati B Connecting bus at this locationA Ticket Agent at this location Bg Checked baggage at this locationNOTE: Official Amtrak ridership data for four Federal Fiscal Years (Oc<strong>to</strong>ber 2002 through September 2006). Includes all rail and bus passengersoriginating or terminating at each station on all routes shown above.86
Chapter V – The <strong>California</strong> Passenger <strong>Rail</strong> NetworkFigure 5F (Continued)AMTRAK TRAIN AND BUS RIDERSHIP BY STATIONFEDERAL FISCAL YEARS 2002/03 TO 2005/0605-06 2005-06 2004-05 2003-04 2002-03 Routes Serving Station * ServicesRank Station County Ridership Ridership Ridership Ridership PS SJ CC CS CZ TE SC SL53 Turlock-Denair Stanislaus 15,300 15,<strong>08</strong>3 13,576 13,888 T54 Wasco Kern 14,225 13,936 14,557 14,370 T55 Riverside Riverside 14,192 13,319 11,692 11,534 B56 Paso Robles San Luis Obispo 13,534 13,551 13,997 13,802 B B B T57 Madera Madera 13,239 12,706 12,406 13,202 T58 Santa Rosa Sonoma 11,767 9,126 9,653 10,199 B B59 Moorpark Ventura 11,368 9,177 8,146 8,453 TB60 Truckee Nevada 11,356 11,992 11,212 11,355 B B T61 Yosemite Natl. Park Mariposa 10,828 11,023 13,368 16,792 B62 Long Beach (2 s<strong>to</strong>ps) Los Angeles 10,090 9,193 7,684 7,076 B B63 Guadalupe Santa Barbara 9,616 6,981 6,362 6,537 TB64 South Lake Tahoe El Dorado 9,475 8,313 9,788 9,131 B B65 Santa Maria Santa Barbara 8,897 8,701 8,4<strong>08</strong> 7,810 B B B66 Ontario San Bernardino 8,662 6,802 6,613 6,381 B T T67 Vic<strong>to</strong>rville San Bernardino 8,628 7,296 6,505 5,206 T68 San Clemente Orange 8,179 6,763 6,135 5,015 T69 Surf/Lompoc Santa Barbara 7,253 5,067 3,961 7,034 T70 SLO-Cal Poly San Luis Obispo 7,1<strong>08</strong> 6,833 4,377 3,492 B T T71 Napa Napa 6,593 4,852 5,253 5,376 B B72 Needles San Bernardino 6,132 13,045 19,669 19,153 T73 Hemet (2 s<strong>to</strong>ps) Riverside 6,034 1,806 1,644 1,811 B74 Pasadena Los Angeles 5,627 5,224 4,762 5,939 B75 San Pedro (2 s<strong>to</strong>ps) Los Angeles 5,576 5,299 6,663 4,909 B76 Arcata Humboldt 5,438 3,905 4,202 3,894 B B77 Santa Clarita-Newhall Los Angeles 4,759 4,520 3,953 3,886 B B78 Vallejo (2 s<strong>to</strong>ps) Solano 4,737 5,616 6,066 7,967 B B79 Claremont Los Angeles 4,702 4,256 4,051 4,211 B80 Bars<strong>to</strong>w San Bernardino 4,295 4,037 4,288 4,174 B T81 Colfax Placer 4,254 4,334 4,102 4,309 B B T82 Dunsmuir Siskiyou 4,2<strong>18</strong> 4,517 4,667 4,<strong>18</strong>7 T83 Marysville Yuba 3,800 3,253 2,924 2,977 B B84 Eureka Humboldt 3,799 3,123 3,216 3,280 B B85 <strong>State</strong>line El Dorado 3,791 3,702 3,848 249 B B86 Lancaster Los Angeles 3,781 3,491 3,178 2,925 B87 Visalia Tulare 3,147 1,705 1,100 1,204 B88 Solvang Santa Barbara 3,124 2,922 3,071 4,421 B B89 Oroville Butte 3,040 2,717 2,662 2,645 B B90 Petaluma Sonoma 2,569 2,126 2,066 2,052 B B91 Ukiah Mendocino 2,391 2,065 2,141 1,683 B B92 Placerville El Dorado 2,362 2,481 2,363 2,090 B B93 Palmdale Los Angeles 1,982 1,666 1,429 1,240 B94 McKinleyville Humboldt 1,849 2,300 1,863 1,990 B B95 Palm Springs Riverside 1,775 2,216 1,649 1,948 B T T96 Rohnert Park Sonoma 1,742 1,742 1,834 1,947 B B97 Lompoc Santa Barbara 1,498 1,582 1,982 3,017 B98 Tehachapi Kern 1,494 1,545 1,815 1,768 B99 Dublin-Pleasan<strong>to</strong>n Alameda 1,461 1,606 1,397 1,254 B100 Palm Springs Airport Riverside 1,454 1,454 1,349 1,293 B101 Mojave Kern 1,101 1,135 865 867 B102 Monterey Monterey 1,071 1,377 1,697 5,491 B B* Route and Symbol Key:PS Pacific Surfliner (San Luis Obispo-Los Angeles-San Diego) CZ <strong>California</strong> Zephyr (Emeryville-Chicago)SJ San Joaquin (Bay Area/Sacramen<strong>to</strong>-Fresno-Bakersfield) TE Texas Eagle (Los Angeles-Chicago)CC Capi<strong>to</strong>l Corridor (Auburn-Sacramen<strong>to</strong>-Oakland-San Jose) SC Southwest Chief (Los Angeles-Chicago)CS Coast Starlight (Los Angeles-Oakland-Sacramen<strong>to</strong>-Seattle) SL Sunset Limited (Los Angeles-Orlando)T Train at this location TB Train and bus at this location B Connecting bus at this locationA Ticket Agent at this location Bg Checked baggage at this location87
<strong>2007</strong>-<strong>08</strong> – <strong>2017</strong>-<strong>18</strong> <strong>California</strong> <strong>State</strong> <strong>Rail</strong> <strong>Plan</strong>Figure 5F (Continued)AMTRAK TRAIN AND BUS RIDERSHIP BY STATIONFEDERAL FISCAL YEARS 2001/02 TO 2005/0605-06 Ridership Ridership Ridership Ridership Routes Serving Station * ServicesRank Station County 2005-06 2004-05 2003-04 2002-03 PS SJ CC CS CZ TE SC SL103 Palo Al<strong>to</strong> Santa Clara 2,100 B104 Indio Riverside 1,523 1,052 1,254 911 B105 Garberville Humbolt 1,305 1,003 822 670 B B106 Willits Mendocino 1,217 823 848 782 B107 Red Bluff Tehama 1,<strong>18</strong>8 1,093 1,010 925 B B1<strong>08</strong> Santa Paula Ventura 1,113 1,019 891 873 B109 Fortuna Humbolt 1,004 905 965 803 B B110 Livermore Alameda 959 1,016 791 760 B111 Atascadero San Luis Obispo 788 988 1,<strong>08</strong>6 919 B B112 Pomona Los Angeles 764 771 786 679 T T113 Tracy San Joaquin 716 807 735 820 B114 Perris Riverside 626 677 490 351 B115 Corning Tehama 565 7<strong>08</strong> 533 591 B B116 Fillmore Ventura 558 385 446 387 B117 Palm Desert Riverside 535 378 404 449 B1<strong>18</strong> Carmel Monterey 485 561 863 865 B B119 Moreno Valley Riverside 463 522 557 332 B120 La Crescenta Los Angeles 463 464 414 498 B121 Healdsburg Sonoma 425 406 357 333 B B122 Beaumont Riverside 395 303 256 244 B123 Buell<strong>to</strong>n Santa Barbara 388 321 350 344 B124 Mariposa Mariposa 372 331 363 326 B125 Lay<strong>to</strong>nville Mendocino 336 273 171 205 B B126 Gilroy Santa Clara 310 330 307 368 B B127 King City Monterey 310 205 156 72 B B128 Cloverdale Sonoma 279 160 237 199 B B129 Rosamond Kern 254 264 268 261 B130 Los Banos Merced 253 B B131 Rio Dell-Scotia Humbolt 215 140 214 162 B B132 Midpines Mariposa 177 176 141 142 B133 Soda Springs Nevada 172 226 <strong>18</strong>0 235 B B134 Sunnyvale Santa Clara 136 B135 Lemoore Kings 132 90 34 64 B136 Yreka Siskiyou 127 B B137 Hollister San Beni<strong>to</strong> 124 B138 Mountain View Santa Clara 1<strong>18</strong> B139 El Portal Mariposa 102 91 62 92 B140 Santa Cruz Santa Cruz 93 56 28,651 51,363 B B141 Mt. Shasta Siskiyou 90 B B142 Leggett Mendocino 80 52 68 65 B B143 Weed Siskiyou 51 B B144 Goshen Jct. Tulare 49 8 13 19 B145 Littlerock Los Angeles 48 103 37 58 B146 San Juan Bautista San Beni<strong>to</strong> 31 B147 Kettleman City Kings 13 32 12 30 B* Route and Symbol Key:PS Pacific Surfliner (San Luis Obispo-Los Angeles-San Diego) CZ <strong>California</strong> Zephyr (Emeryville-Chicago)SJ San Joaquin (Bay Area/Sacramen<strong>to</strong>-Fresno-Bakersfield) TE Texas Eagle (Los Angeles-Chicago)CC Capi<strong>to</strong>l Corridor (Auburn-Sacramen<strong>to</strong>-Oakland-San Jose) SC Southwest Chief (Los Angeles-Chicago)CS Coast Starlight (Los Angeles-Oakland-Sacramen<strong>to</strong>-Seattle) SL Sunset Limited (Los Angeles-Orlando)T Train at this location TB Train and bus at this location B Connecting bus at this locationA Ticket Agent at this location Bg Checked baggage at this location88
Chapter V – The <strong>California</strong> Passenger <strong>Rail</strong> NetworkOTHER PASSENGER RAIL SERVICESOther railroads in <strong>California</strong> offer limited rail passenger service, which isgenerally <strong>to</strong>urist oriented. These non-Amtrak intercity rail passenger servicesremain subject <strong>to</strong> the regula<strong>to</strong>ry jurisdiction of the CPUC, FRA, and the SurfaceTransportation Board (STB).The Sierra <strong>Rail</strong>road (formally the <strong>California</strong> Western <strong>Rail</strong>road) betweenFort Bragg and Willits in Mendocino County has been the principal privatelyownedrailroad in <strong>California</strong> offering regularly scheduled rail passenger service.Sierra <strong>Rail</strong>road acquired the line and opened it in May 2004 for passengerexcursion service. Excursion related passenger traffic on the 40-mile route is theprimary business. The Sierra <strong>Rail</strong>road has begun an ongoing acquisition andrehabilitation program for stations, track and rolling s<strong>to</strong>ck. The contact phonenumber for the Skunk Train is 1-800-866-1690.Other railroads offer rail passenger <strong>to</strong>urist service generally only during summerand holiday periods. For additional information on rail passenger <strong>to</strong>urist service,call <strong>California</strong> Tourism at 1-800-862-2543 or access their website atwww.visitcalifornia.com.89
<strong>2007</strong>-<strong>08</strong> – <strong>2017</strong>-<strong>18</strong> <strong>California</strong> <strong>State</strong> <strong>Rail</strong> <strong>Plan</strong>Figure 6A90
Chapter VI – Pacific Surfliner RouteCHAPTER VIPACIFIC SURFLINER ROUTESAN LUIS OBISPO-SANTA BARBARA-LOS ANGELES-SAN DIEGOPRINCIPAL <strong>2007</strong>-<strong>08</strong> <strong>to</strong> <strong>2017</strong>-<strong>18</strong> ROUTE OBJECTIVES• Improve On-Time Performance (OTP) <strong>to</strong> 90 percent by <strong>2017</strong>-<strong>18</strong>.• Streamline operations and improve passenger amenities:o Study Premium Class Service.o Implement passenger on-board wireless internet service.o Implement au<strong>to</strong>mated ticket validation and internet ticket purchase.o In the long-term implement comprehensive wireless network forimproved on-board and equipment operations, safety and equipmentrepair.• Improve multimodal connectivity:o Cross-ticketing and coordinated schedules with Metrolink and Coaster.o Improved coordination with urban transit.o Improved Amtrak Thruway service.• Reduce Travel Times:o San Diego <strong>to</strong> Los Angeles in under 2 hours-30 minutes.o Los Angeles <strong>to</strong> San Luis Obispo in under 5 hours.o Implement express service between Los Angeles and San Diego.• Increase annual ridership 51 percent from 2,698,000 <strong>to</strong> 4,061,000.• Increase annual revenues 94 percent from $34.5 million <strong>to</strong> $67.0 millionfor the <strong>State</strong>-supported portion of the Route.• Increase revenue/cost (farebox) ratio from 67.1 percent <strong>to</strong> 68.2 percent.• Increase Service Frequency:o From 11 <strong>to</strong> 13 daily round-trips between San Diego – Los Angeles.o From 5 <strong>to</strong> 6 daily round-trips between Los Angeles – Santa Barbara.o From 2 <strong>to</strong> 3 daily round-trips between Santa Barbara – San Luis Obispo.• Expand Service:o San Francisco – San Luis Obispo – first daily round-trip in 2010-11,second daily round-trip in 2013-14.This Chapter presents the ten-year operational and service improvement and trainservice expansion plans for the Route. The Chapter also provides information on91
<strong>2007</strong>-<strong>08</strong> – <strong>2017</strong>-<strong>18</strong> <strong>California</strong> <strong>State</strong> <strong>Rail</strong> <strong>Plan</strong>route administration, route his<strong>to</strong>ry, route description, and his<strong>to</strong>rical performance.Figure 6A is the Pacific Surfliner route map, including the connecting buses.TEN-YEAR OPERATIONAL AND SERVICE IMPROVEMENTPLANSThis Section focuses on the specific ten-year operational and service improvementplans the Department has for the Route for the three key components ofOperations: on-time performance and reliability, streamlined operations andpassenger amenities, and multimodal connectivity. Key performance goals fortravel time, ridership, revenue, and farebox ratio are also presented. The combinedoperations program, as is pertains primarily <strong>to</strong> the Pacific Surfliner andSan Joaquin Routes, is also discussed in Chapter III in further detail. (Chapter IIIalso contains some information on the Capi<strong>to</strong>l Corridor operations program.)ON-TIME PERFORMANCE AND RELIABILITYThe Department’s goal is <strong>to</strong> improve service reliability and increase on-timeperformance (OTP) <strong>to</strong> 90 percent by the end of the <strong>Plan</strong> period. Increased OTPprovides improved service reliability. This goal is based on the fullimplementation of the unconstrained capital program described in Chapter II.However, even when capital projects that can improve OTP are completed, otherfac<strong>to</strong>rs, such as growth of freight rail traffic, local communities desire <strong>to</strong> add newstations and use intercity rail <strong>to</strong> increase transit options <strong>to</strong> meet stricter air qualitystandards will affect OTP.Between 2001-02 and 2003-04, OTP was about 87 percent, party due <strong>to</strong> thecompletion of key capital projects. However, two fac<strong>to</strong>rs caused the OTP <strong>to</strong> fall <strong>to</strong>72.9 percent in 2004-05. First, serious winter s<strong>to</strong>rms damaged track, interruptingand delaying service. Second, there has been a significant increase in freighttraffic and in the length of freight trains. Since that time, OTP has remained atabout a 76 percent average and has been severely affected by the increase infreight traffic, particularly from Los Angeles <strong>to</strong> San Luis Obispo, where it isalmost entirely single track and many sidings are not long enough <strong>to</strong> accommodatethe new longer freight trains.In the near term, the completion of on-going track projects will somewhat improveOTP. Work is progressing on the large Los Angeles-Fuller<strong>to</strong>n third main trackand grade separations project. To date, four miles of triple track have beencompleted. Segments are being completed sequentially and each new segmentimproves reliability and OTP for both commuter and Pacific Surfliner services.Other projects currently programmed <strong>to</strong> improve OTP include the Oceansidedouble-track project. Further in<strong>to</strong> the ten-year period, projects on the north end <strong>to</strong>add sidings, increase the length of existing sidings, and upgrade the signalingsystem will improve OTP. On the south end, double track projects andreplacement of single-track wooden bridges with double track will improve OTP.92
Chapter VI – Pacific Surfliner RouteAdditionally, the Department will work with the UP, BNSF, Metrolink, andAmtrak <strong>to</strong> identify and implement measures <strong>to</strong> enhance schedule reliability.STREAMLINED OPERATIONS AND PASSENGER AMENITIESThe Department is working <strong>to</strong> streamline operations and improve passengeramenities. Due <strong>to</strong> emerging technology related <strong>to</strong> wireless networking,possibilities exist that previously would have been costly or not available.Improvements that are dependant upon a comprehensive wireless system arediscussed below as longer-term improvements. However, other plannedimprovements are feasible in the near term that either are not related <strong>to</strong> newtechnology or can be implemented with technology that is currently available anddoes not involve development of a comprehensive wireless system. Theseimprovements are discussed below as near-term improvements.Near-Term ImprovementsPassenger On-Board Wireless Internet Service – Wireless internet service isbecoming commonplace. The Capi<strong>to</strong>l Corridor offered internet service inselected cars on a pilot basis, but did not continue the service because usagedropped off significantly when a fee was charged for the service. Also as a resul<strong>to</strong>f the pilot, the CCJPA learned that the most effective system would have bothpassenger and train operating applications. The CCJPA is now working <strong>to</strong>implement this system. The Department would like <strong>to</strong> add passenger on-boardwireless internet capabilities <strong>to</strong> the equipment assigned <strong>to</strong> the Pacific Surfliners.However, this may not be possible unless the wireless system is linked <strong>to</strong> a morecomprehensive system-wide network involving operational applications. (Seebelow for more information.)Au<strong>to</strong>mated Ticket Validation – Au<strong>to</strong>mated ticket validation is a wirelessapplication that can be implemented in advance of a full wireless network.It would improve cus<strong>to</strong>mer service, operations, and safety. <strong>Rail</strong> passengers havebeen able <strong>to</strong> make reservations and purchase tickets over the internet for sometime, but the tickets purchased are traditional paper tickets and must be mailed <strong>to</strong>the purchaser or picked up at an Amtrak ticket office prior <strong>to</strong> departure. Airlineswent one step farther and introduced “paperless” ticketing several years ago.A similar system for train travel would be much more convenient for passengers,particularly those boarding at small un-staffed stations along the route, because itwould eliminate the need <strong>to</strong> obtain actual paper tickets prior <strong>to</strong> traveling orpurchasing them on board.The system would also have many operational advantages. It would produce areal-time record of all passengers on-board. This is a safety and security featuresimilar <strong>to</strong> that currently required of the passenger airline industry. This systemwould allow actual trip origin-destination information, instead on the currentestimates (particularly for 10-ride and monthly tickets), <strong>to</strong> better inform93
<strong>2007</strong>-<strong>08</strong> – <strong>2017</strong>-<strong>18</strong> <strong>California</strong> <strong>State</strong> <strong>Rail</strong> <strong>Plan</strong>management of actual usage, thus allowing better insight and management of theservice delivered <strong>to</strong> the cus<strong>to</strong>mer.The CCJPA in early 20<strong>08</strong> is undertaking an au<strong>to</strong>mated ticket validation pilotproject that is funded by the Department. Depending upon the results, theDepartment may expand implementation <strong>to</strong> this Route.Longer-Term ImprovementsComprehensive Wireless Network – A comprehensive wireless network couldhave many significant applications for improvement of safety, operations, costcontrol,and cus<strong>to</strong>mer service. Systems such as this are in use <strong>to</strong>day in Europe.The network would include hardware installations on the <strong>State</strong>-owned rollings<strong>to</strong>ck and would likely include equipment installations along the right-of-way andother fixed facilities. The benefits of a comprehensive wireless network arediscussed in more detail in Chapter III. The CCJPA is developing a Request forProposal (RFP) <strong>to</strong> be ready by 20<strong>08</strong> <strong>to</strong> establish and maintain a wireless network.Based on the results of the RFP process, the Department will proceed withimplementing a network on the Pacific Surfliners.MULTIMODAL CONNECTIVITYThe Department strives <strong>to</strong> make the Pacific Surfliner service as “seamless” aspossible with enhanced connectivity <strong>to</strong> other transportation systems.The next element in multimodal connectivity between the Pacific Surfliners andMetrolink and Coaster is cross-ticketing and improved schedule coordination.“Next-generation” ticket vending machines are planned <strong>to</strong> be in the initial stagesof operation by <strong>2007</strong>-<strong>08</strong>. These machines will allow the purchase of a ticket for acombined Amtrak/Metrolink rail trip. The program is also planned <strong>to</strong> be expanded<strong>to</strong> the Coaster. Once the machines are in operation, schedules will be furthercoordinated and joint trip destinations will be marketed.In 2005, the Department initiated a program on the Pacific Surfliners whereconduc<strong>to</strong>rs offer free transfers <strong>to</strong> participating transit services. Within the ten-yearperiod, the Department plans <strong>to</strong> expand this program <strong>to</strong> all key transit agencies onthe Route. Expansion of marketing and passenger information programs willprovide additional information on multimodal connectivity with local transit.Connecting Amtrak BusesThe Pacific Surfliner Amtrak buses provide an important extension <strong>to</strong> this route.The Department contracts with Amtrak <strong>to</strong> provide connecting feeder bus services,who in turn, contracts with private bus opera<strong>to</strong>rs. The bus routes function as adirect part of the Amtrak system with coordinated connections, guaranteed seating,integrated fares and ticketing procedures. They are also included in Amtrak’scentral information and reservation systems. On the north end of the route, busesfrom Los Angeles <strong>to</strong> Santa Barbara and then <strong>to</strong> San Luis Obispo have served asprecursors <strong>to</strong> rail service, and play an important role in testing and developing rail94
Chapter VI – Pacific Surfliner Routeridership. Currently buses from Santa Barbara and San Luis Obispo <strong>to</strong> SanFrancisco are providing an important extension for the service and testing thismarket. The Department plans <strong>to</strong> expand and improve Amtrak Thruway busservice on the Route, including additional connections north <strong>to</strong> the San FranciscoBay Area.Following is a listing of the Pacific Surfliner bus routes and their origins/destinations. Route 1 is a San Joaquin bus route but is included since it feedspassengers <strong>to</strong> the Pacific Surfliners and functions as an important supplement <strong>to</strong>train service on the north end of the Pacific Surfliners. Cities that arePacific Surfliner train connection points are in italics.Pacific Surfliner Route Bus RoutesRoute 4–South CoastLos Angeles-Santa BarbaraRoute 17–Central CoastSanta Barbara-San Luis Obispo-San Francisco/OaklandRoute 36–Central CoastSan Luis Obispo-Paso Robles-King City-Salinas-San Jose-San Francisco/OaklandSan Joaquin Route Bus RoutesRoute 1–Los Angeles Basin (San Joaquin Route bus)Los Angeles - BakersfieldTRAVEL TIMESCurrent San Diego <strong>to</strong> Los Angeles travel times average 2 hours-44 minutes;Los Angeles <strong>to</strong> Santa Barbara averages 2 hours-42 minutes; and Santa Barbara <strong>to</strong>San Luis Obispo averages 2 hours-40 minutes. The Department’s ten year goal is<strong>to</strong> reduce travel times <strong>to</strong> under two hours-30 minutes between San Diego andLos Angeles, and under five hours between Los Angeles and San Luis Obispo.Between San Diego and Los Angeles, reductions will be accomplished through thecompletion of capital projects that will reduce actual run times as well as improveOTP. These projects include double-tracking in North San Diego County,triple-tracking between Los Angeles and Fuller<strong>to</strong>n, and replacement and doubletracking of wooden bridges. On the north end between Santa Barbara andSan Luis Obispo, updating signaling <strong>to</strong> Centralized Traffic Control (CTC),increasing siding lengths, new siding construction, and upgrading track will alsoreduce running times and allow for a reduction in schedule recovery time.(See Chapter II, for additional information about the capital projects.)95
<strong>2007</strong>-<strong>08</strong> – <strong>2017</strong>-<strong>18</strong> <strong>California</strong> <strong>State</strong> <strong>Rail</strong> <strong>Plan</strong>San Diego-Los Angeles Express ServiceThe Department is evaluating options for implementing express service betweenSan Diego and Los Angeles. Express service would include timed transfers withMetrolink and Coaster commuter services at a limited number of express s<strong>to</strong>ps. Inorder for this service <strong>to</strong> be successful, it would have <strong>to</strong> receive prioritydispatching.RIDERSHIP, REVENUE, AND FAREBOX RATIOThe Department’s goals for ridership, revenue and farebox ratio will be achievedthrough the capital, operational, and service improvements and service expansionsdiscussed in this Chapter as well as Chapters II, III, and IV. They are as follows:• Increase annual ridership 51 percent from 2,698,000 <strong>to</strong> 4,061,000.• Increase annual revenues 94 percent from $34,500,000 <strong>to</strong> $67,000,000 forthe <strong>State</strong>-supported portion of the Route.• Increase revenue/cost (farebox) ratio from 61.7 percent <strong>to</strong> 68.2 percent.TEN-YEAR TRAIN SERVICE EXPANSION PLANSINCREASED SERVICE FREQUENCIESThe Department anticipates that within the next ten years there will be sufficientdemand <strong>to</strong> support 13 round-trips on the Pacific Surfliners between San Diego andLos Angeles.The Department proposes that expansion of the Pacific Surfliner frequencies occuron the following timetable:2011-12 Los Angeles-San Diego, twelfth round-trip.2013-14 Los Angeles-Goleta, sixth round-trip.2013-14 Goleta-San Luis Obispo, third round-trip.2014-15 Los Angeles-San Diego, thirteenth round-trip.It is important <strong>to</strong> note that the above start-up dates for service are based only onprojected service needs. Demonstrated ridership demand, approval from Amtrakand the host railroads, availability of equipment, funding and construction ofnecessary capital projects, and provision of additional operating funds will affectwhen each of the service expansions actually can be implemented.SAN FRANCISCO TO SAN LUIS OBISPO (AND LOS ANGELES)EXTENSIONThe extension of the Pacific Surfliners from San Luis Obispo <strong>to</strong> San Francisco viathe Coast Route would close a key gap in the <strong>State</strong>-supported intercity rail systemby providing direct train service from San Francisco <strong>to</strong> Los Angeles.96
Chapter VI – Pacific Surfliner RouteThe Department plans one round-trip train between San Francisco and San LuisObispo, starting in 2010-11, with a second train in 2013-14. The first train wouldbe operated from San Luis Obispo <strong>to</strong> Los Angeles as an extension of thePacific Surfliner train added in November 2004, and would provide through trainservice between San Francisco and Los Angeles. The second train would operateas an extension of the planned third Los Angeles-San Luis Obispo round-trip.Direct train connections <strong>to</strong> San Diego at Los Angeles would be available on mosttrips. Regional transportation planning agencies have provided ongoing supportfor this extension. The Department expects that both regional and local agencieswill continue <strong>to</strong> provide an important role in the planning and operation of thisextension. For more detailed information on this route expansion see Chapter X.ROUTE ADMINISTRATIONThe <strong>State</strong> and Amtrak share responsibilities for operating the Pacific Surfliners.Amtrak considers 30 percent of the service, “basic system” service that is part ofnational long-distance service, and operating costs on this portion of the Route arefederally funded. The remaining 70 percent of the Route is <strong>State</strong>-supported.Amtrak operates all trains, and the Department is responsible for the oversight ofthe Pacific Surfliner service through its operating contract. The Departmentcoordinates functions such as marketing, scheduling, and on board services withAmtrak. New Pacific Surfliner equipment is used on the Route. Amtrak owns allof the locomotives and 40 cars, and the <strong>State</strong> owns ten cars. Amtrak maintains allof the equipment. For a further description of the financial relationship betweenAmtrak and the <strong>State</strong>, see Chapter XI.LOSSANThe Department works closely with the Los Angeles–San Diego–San Luis Obispo<strong>Rail</strong> Corridor Agency (LOSSAN), formed in 1989, that acts as a planning and anadvisory group for intercity rail in Southern <strong>California</strong>. The members of its Boardare: San Diego Metropolitan Transit System, San Diego Association ofGovernments, North County Transit District, Orange County TransportationAuthority, Los Angeles County Metropolitan Transportation Authority, VenturaCounty Transportation Commission, Santa Barbara County Association ofGovernments, San Luis Obispo Council of Governments, and Caltrans, Divisionof <strong>Rail</strong>. The members of the LOSSAN Technical Advisory Committee (TAC) are:the organizations mentioned above, and BNSF <strong>Rail</strong>way, <strong>California</strong> Public UtilitiesCommission, Amtrak, Southern <strong>California</strong> Regional <strong>Rail</strong> Authority, and UnionPacific <strong>Rail</strong>road (UP).ROUTE HISTORYAmtrak was created in 1971 <strong>to</strong> revitalize passenger rail service. The San Diegansoperated on tracks owned by Atchison Topeka and Santa Fe <strong>Rail</strong>way (ATSF)97
<strong>2007</strong>-<strong>08</strong> – <strong>2017</strong>-<strong>18</strong> <strong>California</strong> <strong>State</strong> <strong>Rail</strong> <strong>Plan</strong>between Los Angeles and San Diego. These trains functioned primarily asconnections <strong>to</strong> long-haul trains, as opposed <strong>to</strong> a local transportation network forpassengers traveling within the corridor. Amtrak maintained the three round tripsoperated by Santa Fe (but reduced one <strong>to</strong> tri-weekly for the first year), and serviceremained at this level until <strong>State</strong> involvement began in 1976.The segment north of Los Angeles <strong>to</strong> Santa Barbara and San Luis Obispo, onSouthern Pacific Transportation Company (SP) tracks, was served by Amtrak bythe Coast Starlight, a daily round-trip between Los Angeles and Seattle,(it operated only three times per week north of Oakland until June 1973).<strong>State</strong> support of the route began in 1976. This corridor has been unique among<strong>State</strong>-supported routes in <strong>California</strong> because some individual trains were entirelysupported by Amtrak, since they were part of their basic system. However, the<strong>State</strong> paid most of the costs of the other trains, which were considered<strong>State</strong>-supported service. In Oc<strong>to</strong>ber 1995, the cost allocation system changed andthe <strong>State</strong> began support of 64 percent of all service, instead of supportingindividual trains. This support level increased <strong>to</strong> 70 percent in November 2004.In 1988, the San Diegan Route was extended <strong>to</strong> Santa Barbara with a furtherextension <strong>to</strong> San Luis Obispo in 1995. In 2000, the route was renamed thePacific Surfliner in recognition of its expanded service area. A second round-tripbetween Los Angeles and San Luis Obispo was added on November 17, 2004.Service on the Pacific Surfliners between Los Angeles and San Diego increasedfrom the original three round-trips <strong>to</strong> the current level of eleven round-trips onMonday through Thursday and twelve round-trips on Friday through Sundayas follows:9/1/76 Los Angeles-San Diego: fourth round-trip added, <strong>State</strong>-supported.4/24/77 Los Angeles-San Diego: fifth round-trip added, <strong>State</strong>-supported.2/14/78 Los Angeles-San Diego: sixth round-trip added, <strong>State</strong>-supported.10/26/80 Los Angeles-San Diego: seventh round-trip added, Amtrak basicsystem.10/25/81 <strong>State</strong>-supported Spirit of <strong>California</strong> Los Angeles-Sacramen<strong>to</strong> roundtripovernight train provided Los Angeles <strong>to</strong> Santa Barbara service.Service discontinued Oc<strong>to</strong>ber 1, 1983.10/25/87 Los Angeles-San Diego: eighth round-trip added, <strong>State</strong>-supported.6/26/88 First train extended <strong>to</strong> Santa Barbara, <strong>State</strong>-supported.10/28/90 Second train extended <strong>to</strong> Santa Barbara, <strong>State</strong>-supported.10/25/92 Los Angeles-San Diego: ninth round-trip added, Amtrak basicsystem.98
<strong>2007</strong>-<strong>08</strong> – <strong>2017</strong>-<strong>18</strong> <strong>California</strong> <strong>State</strong> <strong>Rail</strong> <strong>Plan</strong>the current ownership, segment, mileage, and track and signal characteristics ofthe Pacific Surfliner Route.Figure 6BBetweenMilePostPACIFIC SURFLINER ROUTEOWNERSHIP AND TRACK CHARACTERISTICSAndMilePost Miles Owner of Track*No. ofTracksMax.SpeedSignalSystemSan Luis Obispo 248.5 East San Luis Obispo 251.5 3.0 UP 2 60 DTCEast San Luis Obispo 251.5 West Santa Barbara 365.2 113.7 UP 1 60 DTCWest Santa Barbara 365.2 East Santa Barbara 368.6 3.4 UP 2 40 DTCEast Santa Barbara 368.6 Moorpark 423.1 54.5 UP 1 70 DTC/CTCMoorpark423.1=426.4 Ventura/LA County Line 442.0 15.6 (a)UP/VCTC 1 70 CTCVentura/LA County Line 442.0 Raymer (West of Van Nuys) 453.1 11.1 (a)UP/LACMTA 1 70 CTCRaymer (West of Van Nuys) 453.1 Burbank Jct. 462.6 9.5 (a)UP/LACMTA 2 79 CTC462.6=Burbank Jct.11.4 Glendale (Fletcher Drive) 4.9 6.5 (a)UP/LACMTA 2 79 CTCGlendale (Fletcher Drive) 4.9 C.P. Day<strong>to</strong>n 2.1 2.8 LACMTA 2 79 CTCC.P. Day<strong>to</strong>n (b) 2.1 Mission Tower 0.8 1.3 LACMTA 2 50 CTCMission Tower 0.8 L.A. Union Station 0.0 1.6 Catellus 3 15 CTCMission Tower 0.0 Redondo Jct. 3.2 LACMTA 1 65 CTCRedondo Jct. 143.2 Fuller<strong>to</strong>n 165.0 21.8 BNSF 1 79 CTCFuller<strong>to</strong>n 165.0 Santa Ana (Aliso) 175.2 10.2 OCTA 2 79 CTCSanta Ana (Aliso) 175.2 Orange/San Diego Co. Line 207.4 32.2 OCTA 2 90 CTC/ATSOrange/San Diego Co. Line 207.4 Del Mar/San Diego City Limits 245.6 38.2 NSDCTDB 1 90 CTC/ATSDel Mar/San Diego City Limits 245.6 Sorren<strong>to</strong> 249.1 3.5 MTDB 1 90 CTC/ATSSorren<strong>to</strong> 249.1 San Diego 267.6 <strong>18</strong>.5 MTDB 1 79 CTCTotal (includes round trip between Union Station and Mission Tower) 350.6* General number of mainline tracks(a) On this segment LACMTA (VCTC between Moorpark and the Ventura/LA County Line) purchased a 40 foot wideportion of UP’s right-of-way. Between Raymer and Burbank Junction, LACMTA constructed and ownsa second main line track.(b) Via West Side of Los Angeles River (Downey Avenue Bridge)Owners:BNSF - The Burling<strong>to</strong>n Northern and Santa Fe <strong>Rail</strong>way CompanyCatellus - Catellus Develop. Corp. (a real estate develop co.; owner of L.A. Union Station)LACMTA - Los Angeles County Metropolitan Transportation AuthorityMTDB - Metropolitan Transit Development BoardNSDCTDB - North San Diego County Transit Development BoardOCTA - Orange County Transportation AuthorityUP - Union Pacific <strong>Rail</strong>road CompanyVCTC - Ventura County Transportation CommissionSignal Systems:ATS - Au<strong>to</strong>matic Train S<strong>to</strong>p - Allows speeds of 90 miles per hour. System au<strong>to</strong>matically applies train brakes ifa restrictive signal indication is not observed or warning alarm is not acknowledged.CTC - Centralized Traffic Control - Wayside signals protect possession of blocks. Signals and poweredswitches are also remotely controlled from the dispatching center <strong>to</strong> direct the movement of trains.DTC - Direct Traffic Control - Dispatching center gives authority for train movement by radio <strong>to</strong> train crew directly.HISTORICAL PERFORMANCEFigure 6C shows ridership and financial performance data on an annual basis fromthe start of <strong>State</strong>-supported service in 1976-77 through 2005-06. Ridership andfarebox return climbed steadily, with the years 1987-88 through 1992-93experiencing particularly strong ridership growth and financial strength.The farebox ratio was near or over 100 percent for these six consecutive years, andridership peaked at 1.8 million in 1992-93, and did not again reach this level until2002-03.100
Chapter VI – Pacific Surfliner RouteHowever, introduction of Metrolink commuter rail service in the Los Angelesbasin in Oc<strong>to</strong>ber 1992 and Coaster commuter rail service in the San Diego area in1995 had a negative effect on ridership. In 1995, Amtrak also increased theamount and type of costs charged <strong>to</strong> the <strong>State</strong>, with a negative effect on fareboxreturn. Farebox return reached a low of 33.9 percent in 1997-98.But overall ridership on the corridor has increased significantly in recent years,offsetting the initial impacts of the new commuter services. Ridership reachedtwo million in 2002-03, and farebox return has been over 50 percent since2000-01. The introduction of the “<strong>Rail</strong> 2 <strong>Rail</strong>” Program on Amtrak and Metrolinkservice in September 2002 and in April 2004 on the Coaster has caused a largeincrease in ridership. The program allows joint ticket honoring between Amtrakand commuter rail services. Ridership reached a peak of 2.7 million in 2005-06,a 52 percent increase over 2001-02 ridership (the year before the introduction of<strong>Rail</strong> 2 <strong>Rail</strong>).101
<strong>2007</strong>-<strong>08</strong> – <strong>2017</strong>-<strong>18</strong> <strong>California</strong> <strong>State</strong> <strong>Rail</strong> <strong>Plan</strong>Figure 6CRidership DataPACIFIC SURFLINER RouteAnnual Operating Performance - <strong>State</strong> Fiscal YearsFinancial Data for Operations - <strong>State</strong> Supported Train and Bus Service Only*<strong>State</strong><strong>State</strong>Fiscal All Trains Supported* Train Loss FareboxYear Ridership PM/TM Ridership Revenue Expense Loss <strong>State</strong> Cost Amtrak Cost per PM RatioNotes (F1) (F2) (F3) (F4) (F5) (F6)1973-74 (S1) 381,8441974-75 356,6301975-76 376,9001976-77 (S2) 607,976 146 101,572 $ 598,140 $ 1,662,714 $ 1,064,574 $ 548,53436.0%1977-78 (S3) 753,246 128 258,800 $ 1,446,036 $ 3,768,065 $ 2,322,029 $ 1,325,<strong>08</strong>738.4%1978-79 967,316 163 415,865 $ 2,203,403 $ 4,333,602 $ 2,130,199 $ 1,178,66750.8%1979-80 1,2<strong>18</strong>,196 177 557,113 $ 3,341,561 $ 5,536,840 $ 2,195,279 $ 1,064,71360.4%1980-81 (S4) 1,238,135 152 555,4<strong>18</strong> $ 4,032,480 $ 6,572,539 $ 2,540,059 $ 1,233,49061.4%1981-82 1,167,7<strong>18</strong> 144 533,093 $ 4,097,254 $ 6,607,395 $ 2,510,141 $ 1,217,4<strong>18</strong>6.3¢ 62.0%1982-83 1,131,146 138 488,606 $ 4,094,750 $ 6,928,334 $ 2,833,584 $ 1,374,0978.3¢ 59.1%1983-84 1,221,256 143 524,857 $ 4,842,400 $ 6,337,<strong>08</strong>3 $ 1,494,683 $ 1,452,4504.1¢ 76.4%1984-85 1,240,003 152 568,902 $ 5,410,502 $ 6,411,3<strong>08</strong> $ 1,000,806 $ 1,212,2612.5¢ 84.4%1985-86 1,394,320 167 597,025 $ 5,658,915 $ 6,424,634 $ 765,719 $ 1,097,9661.8¢ 88.1%1986-87 1,461,003 173 624,6<strong>18</strong> $ 6,072,523 $ 6,510,113 $ 437,590 $ 955,5091.0¢ 93.3%1987-88 (S5) 1,661,512 174 749,996 $ 8,223,462 $ 7,859,783 $ (363,679) $ 1,145,330(0.7¢) 104.6%1988-89 1,717,539 164 865,003 $ 11,458,<strong>08</strong>4 $ 10,563,459 $ (894,625) $ 794,159(1.2¢) 1<strong>08</strong>.5%1989-90 1,746,673 174 882,167 $ 12,<strong>18</strong>9,942 $ 11,8<strong>08</strong>,251 $ (381,691) $ 988,847(1.4¢) 103.2%1990-91 (S6) 1,791,781 159 946,988 $ 13,306,307 $ 13,364,150 $ 57,843 $ 1,170,448(0.7¢) 99.6%1991-92 1,673,107 161 884,224 $ 13,152,063 $ 13,245,924 $ 93,861 $ 1,012,564(0.5¢) 99.3%1992-93 (S7) 1,810,572 155 951,987 $ 13,692,612 $ 13,254,709 $ (437,903) $ 958,857(0.8¢) 103.3%1993-94 (S8) 1,699,882 133 876,766 $ 12,725,094 $ 14,017,591 $ 1,292,497 $ 1,525,074 $ 727,987 0.9¢ 90.8%1994-95 (S9) 1,464,577 119 790,781 $ 11,805,859 $ 16,061,849 $ 4,255,990 $ 3,642,588 $ 1,700,424 5.0¢ 73.5%1995-96 (S10) 1,480,674 125 912,905 $ 13,553,553 $ 23,983,026 $ 10,429,473 $ 11,107,071 $ 863,230 11.4¢ 56.5%1996-97 1,617,641 134.7 1,035,290 $ 14,804,355 $ 39,563,546 $ 24,759,191 $ 16,<strong>18</strong>9,103 $ 10,020,544 24.5¢ 37.4%1997-98 (S11) 1,624,693 120.4 1,069,547 $ 15,194,498 $ 44,769,723 $ 29,575,225 $ 20,369,417 $ 10,600,767 29.1¢ 33.9%1998-99 (S12) 1,563,275 101.9 1,047,394 $ 16,401,625 $ 40,391,845 $ 23,990,220 $ 22,078,192 $ 4,014,071 25.3¢ 40.6%1999-00 1,567,3<strong>18</strong> 99.3 1,050,103 $ 17,883,725 $ 37,497,489 $ 19,613,764 $ 20,806,672 $ 1,381,986 19.8¢ 47.7%2000-01 (S13) 1,661,704 106.2 1,113,342 $ 20,430,153 $ 38,215,732 $ 17,785,579 $ 21,911,398 $ 335,197 16.6¢ 53.5%2001-02 (S14) 1,742,768 1<strong>08</strong>.3 1,167,655 $ 20,922,453 $ 39,374,190 $ <strong>18</strong>,451,737 $ 21,976,<strong>18</strong>3 $ 502,<strong>08</strong>0 16.6¢ 53.1%2002-03 2,030,491 114.1 1,360,429 $ 22,247,564 $ 42,331,531 $ 20,<strong>08</strong>3,967 $ 23,901,407 $ 472,848 16.7¢ 52.6%2003-04 2,307,010 126.9 1,545,697 $ 24,559,<strong>18</strong>3 $ 45,300,782 $ 20,741,599 $ 21,719,288 $ 94,883 16.0¢ 54.2%2004-05 (S15) 2,454,396 129.8 1,644,445 $ 26,660,048 $ 48,105,899 $ 21,445,851 $ 21,445,85115.7¢ 55.4%2005-06 2,655,490 133.3 1,858,843 $ 31,604,715 $ 55,570,797 $ 23,966,<strong>08</strong>2 $ 23,966,<strong>08</strong>215.6¢ 56.9%TOTAL 47,786,792 25,979,431 $ 362,613,259 $ 616,372,903 $ 253,759,644 $ 249,368,723* Through September 1995, the <strong>State</strong> supported specific trains; Amtrak operated the remaining trains as basic system trains not receiving <strong>State</strong>funding. Between Oc<strong>to</strong>ber 1995 and Oc<strong>to</strong>ber 1997, the <strong>State</strong> supported 64 percent of the operation of all trainson the Pacific Surfliner Route; Amtraksupports 36 percent as basic system trains. Effective November 1997, <strong>State</strong> support increased <strong>to</strong> 67%. Effective December 2004, <strong>State</strong> supportincreased <strong>to</strong> 70%. <strong>State</strong> supports 100 percent of net cost of connecting buses; all data shown includes bus operations.(S1) Three round trips between Los Angeles and San Diego (LA-SD) (S8) Third <strong>State</strong>-supported LA-SB round trip added 2/1/94.(not <strong>State</strong>-supported) through 8/30/76.(S9) Ninth LA-SD round trip (<strong>State</strong>-supported in one direction only)(S2) Fourth LA-SD round trip (first <strong>State</strong>-supported train) added 9/1/76; discontinued 5/15/95.fifth LA-SD round trip (second <strong>State</strong>-supported train) added 4/24/77.(S10) Los Angeles-San Luis Obispo round trip added 10/29/95, also(S3) Sixth LA-SD round trip (third <strong>State</strong>-supported train) added 2/14/78.represents fourth LA-SB round trip.(S4) Seventh LA-SD round trip (not <strong>State</strong>-supported) added 10/26/80.(S11) Ninth LA-SD round trip res<strong>to</strong>red and tenth LA-SD round trip added(S5) Eighth LA-SD round trip (fourth <strong>State</strong>-supported train) added 10/26/97.10/25/87; first <strong>State</strong>-supported round trip between Los Angeles (S12) Eleventh LA-SD roundtrip added 10/25/98.and Santa Barbara (LA-SB) added 6/26/88. (S13) Twelfth LA-SD round trip on weekends only added on 5/21/01.(S6) Second <strong>State</strong>-supported LA-SB round trip added 10/28/90. (S14) Fifth LA-SB round trip on weekends only added on 5/25/02.(S7) Ninth LA-SD round trip (not <strong>State</strong>-supported) added 10/25/92. (S15) Second LA-SLO round trip added on 11/17/04.(F1) Passenger-miles per train mile (PM/TM), a measure of the average load on a train over its entire route. Actual passenger-mile data was not provided by Amtrak prior <strong>to</strong>August 1981. PM/TM figures shown for All Trains are calculated by Amtrak and cover the Amtrak Fiscal Year (Oc<strong>to</strong>ber through September).(F2) Prior <strong>to</strong> Oc<strong>to</strong>ber 1983, all trains billed on solely related cost basis. From Oc<strong>to</strong>ber 1983 through September 1995, all Los Angeles- San Diego trains and the first Los Angeles-Santa Barbara train billed on short-term avoidable cost basis. The second and third Los Angeles- Santa Barbara trains billed on long-term avoidable cost basis.Between Oc<strong>to</strong>ber 1995 and September 1996, all trains billed on long-term avoidable cost basis. Effective Oc<strong>to</strong>ber 1996, all trains billed on Full Cost (Train, Route and System)Basis. Depreciation and interest (equipment capital cost) included in operating cost under solely-related basis but excluded and charged separately under short-term, long-termavoidable and full cost bases.(F3) From Oc<strong>to</strong>ber 1976 through September 1983, <strong>State</strong> cost was 48.5 percent of operating loss (including equipment costs). For the third Los Angeles- Santa Barbara train, <strong>State</strong>cost was 100 percent of operating loss from February 1994 through September 1994, and 70 percent through September 1995. For all other trains, effective Oc<strong>to</strong>ber 1983,through September 1995, <strong>State</strong> cost was 65 percent of operating loss plus 50 percent of depreciation and interest (equipment capital cost). Between Oc<strong>to</strong>ber 1995 andSeptember 1996, <strong>State</strong> cost was 100 percent of operating loss and 60 percent of equipment capital cost for the <strong>State</strong> supported 64 percent of train service on the route.Between Oc<strong>to</strong>ber 1996 and September 1997, <strong>State</strong> cost was 55 percent of operating loss and 100 percent of equipment capital cost for the 64 percent <strong>State</strong> share. EffectiveOc<strong>to</strong>ber 1997, <strong>State</strong> is billed contractually specified percentages of most individual cost elements, plus a fixed amount for certain other cost elements. The <strong>State</strong> shareincreased <strong>to</strong> 67 percent in November 1997 and <strong>to</strong> 70 percent in December 2004 of train service on the route <strong>to</strong> reflect additional <strong>State</strong> supported service. Also includes <strong>State</strong>payment of special payments <strong>to</strong> Amtrak for additional service and <strong>State</strong> payment for entire net cost of all connecting bus routes.(F4) Between <strong>State</strong> Fiscal Years 1993-94 and 2003-04, Amtrak cost is based on billings submitted and reflects cost bases and Amtrak shares as stated in notes (F2) and (F3)above. However, Amtrak does not include the unbilled Amtrak share of fixed cost elements. Prior <strong>to</strong> FY 1993-94, data <strong>to</strong> calculate Amtrak cost is not available; beginning inFY 2004-05, no Amtrak share is billed.(F5) Train loss (deficit) per train passenger mile. Separate passenger-mile data for <strong>State</strong>-supported trains was not provided by Amtrak prior <strong>to</strong> August 1981. Connecting buses notincluded in loss per passenger mile data.(F6) Farebox Ratio, the ratio of Revenue <strong>to</strong> Expense.102
103Chapter VI – Pacific Surfliner Route
<strong>2007</strong>-<strong>08</strong> – <strong>2017</strong>-<strong>18</strong> <strong>California</strong> <strong>State</strong> <strong>Rail</strong> <strong>Plan</strong>Figure 7A104
Chapter VII – San Joaquin RouteCHAPTER VIISAN JOAQUIN ROUTEBAY AREA/SACRAMENTO-FRESNO-BAKERSFIELDLOS ANGELESPRINCIPAL <strong>2007</strong>-<strong>08</strong> <strong>to</strong> <strong>2017</strong>-<strong>18</strong> ROUTE OBJECTIVES• Improve On-Time Performance <strong>to</strong> 90 % by <strong>2017</strong>-<strong>18</strong>.• Streamline operations and improve passenger amenities:o Study Premium Class Service.o Implement passenger on-board wireless internet service.o Implement au<strong>to</strong>mated ticket validation and internet ticket purchase.o Implement Electronic Train Management System.o In the long-term implement comprehensive wireless network forimproved on-board and equipment operations, safety and equipmentrepair.• Improve mulimodal connectivity:o Improved coordination with Altamont Commuter Express (ACE),Capi<strong>to</strong>l Corridor, and local transit systems.o Improved Amtrak Thruway bus service.• Reduce Travel Times:o Oakland <strong>to</strong> Bakersfield in under six hours.o Sacramen<strong>to</strong> <strong>to</strong> Bakersfield in under five hours.• Increase annual ridership 80 % from 797,000 <strong>to</strong> 1,432,000.• Increase annual revenues 124 % from $ 26.5 million <strong>to</strong> $ 59.4 million.• Increase revenue/cost (farebox) ratio from 46.3% <strong>to</strong> 52.3%.• Increase Service Frequency:o Two new roundtrips from S<strong>to</strong>ck<strong>to</strong>n <strong>to</strong> Oakland.o Seventh Bakersfield – S<strong>to</strong>ck<strong>to</strong>n round trip, with a third daily round-tripfrom S<strong>to</strong>ck<strong>to</strong>n <strong>to</strong> Sacramen<strong>to</strong>.o Eighth Bakersfield – S<strong>to</strong>ck<strong>to</strong>n round trip, with a fifth daily round-tripfrom S<strong>to</strong>ck<strong>to</strong>n <strong>to</strong> Oakland.• Other Service Expansions:o Pursue options <strong>to</strong> originate some trains in Fresno.o Study options <strong>to</strong> extend rail service from Bakersfield <strong>to</strong> Los Angeles.105
<strong>2007</strong>-<strong>08</strong> – <strong>2017</strong>-<strong>18</strong> <strong>California</strong> <strong>State</strong> <strong>Rail</strong> <strong>Plan</strong>This Chapter presents the ten-year operational and service improvement and trainservice expansion plans for the Route. The Chapter also provides information onroute administration, route his<strong>to</strong>ry, route description, and his<strong>to</strong>rical performance.Figure 7A is the San Joaquin route map, including the connecting buses.TEN-YEAR OPERATIONAL AND SERVICE IMPROVEMENTPLANSThis Section focuses on the specific ten-year operational and service improvementplans the Department has for the San Joaquin Route for the three key componentsof Operations: on-time performance and reliability, streamlined operations andpassenger amenities, and multimodal connectivity. Key performance goals fortravel time, ridership, revenue, and farebox ratio are also presented.The combined operations program, as is pertains primarily <strong>to</strong> the San Joaquin andPacific Surfliner Routes, is also discussed in Chapter III in further detail. (ChapterIII also contains some information on the Capi<strong>to</strong>l Corridor operations program.)ON-TIME PERFORMANCE AND RELIABILITYThe Department’s goal is <strong>to</strong> improve service reliability and increase on-timeperformance (OTP) <strong>to</strong> 90 percent by the end of the <strong>Plan</strong> period. This goal is basedon significant implementation of the unconstrained capital program described inChapter II.The OTP over the years on the San Joaquins has fluctuated considerably, with agradual overall decline as passenger service levels and freight movement hasincreased. It is difficult <strong>to</strong> maintain high on-time levels because 75 percent of this365-mile corridor from Bakersfield <strong>to</strong> Oakland and Sacramen<strong>to</strong> is single-track.(See Figure 7C discussed in more detail later in the chapter, that shows the trackcharacteristics on the Route.) OTP on a single-track railroad is particularlysensitive <strong>to</strong> increases in traffic and right of way disruptions (e.g., crossingaccidents, broken rails and crossing gates, and normal maintenance of wayactivities) because there is no other track <strong>to</strong> handle the traffic or accommodate theservice disruption.Over the last two decades, the Department has financed a number of track projectsintended <strong>to</strong> increase OTP and reliability, as well as increase capacity for additionaltrain frequencies. These projects have increased the amount of double-track routemiles on the BNSF from less than four percent <strong>to</strong> about 16 percent. TheseDepartment financed track projects on private railroads included railroad on-timeperformance agreements, meaning that the railroad agrees that once a capitalproject is completed, it will maintain a specified level of OTP. Also, 25 miles ofcentralized traffic control (CTC) were installed west of S<strong>to</strong>ck<strong>to</strong>n <strong>to</strong> Oakley, andthe final 17 miles of CTC from Oakley <strong>to</strong> Port Chicago are being upgraded in<strong>2007</strong>. Several additional double-track segments are currently being studied, andbeneficial ones will be undertaken as funding becomes available. Ultimately, the106
Chapter VII – San Joaquin Routeentire BNSF main line in the San Joaquin Valley may need <strong>to</strong> be double-tracked,but that is a long term goal extending well beyond the next ten years.(See Chapter II, for additional information about capital projects.)In FFY 2000-01, OTP was 67 percent, and in FFY 2001-02 OTP rose <strong>to</strong>78 percent as the result of extensive track projects discussed above. However,OTP between FFY 2002-03 and 2004-05 averaged 59 percent. Reduced OTP hasbeen <strong>to</strong> a large extent the result of increased freight traffic causing congestion.Also necessary track maintenance in the form of winter track blitzes hasnegatively impacted OTP in the last few years. However OTP for FFY 2006-07year-<strong>to</strong>-date (Oc<strong>to</strong>ber <strong>2007</strong>- June <strong>2007</strong>) is up <strong>to</strong> 68 percent, partly as the result ofthe completion of the Shirley-Hanford double-track project in April 2006 and theCalwa-Bowles double-track project in January <strong>2007</strong> for a <strong>to</strong>tal of approximately15 miles of new double track.STREAMLINED OPERATIONS AND PASSENGER AMENITIESThe Department is working <strong>to</strong> streamline operations and improve passengeramenities. Due <strong>to</strong> emerging technology related <strong>to</strong> wireless networking,possibilities exist that previously would have been very costly or not available.Improvements that are dependant upon a comprehensive wireless system arediscussed below as longer-term improvements. However, other plannedimprovements are feasible in the near term that either are not related <strong>to</strong> newtechnology or can be implemented with technology that is currently available anddoes not involve development of a comprehensive wireless system. Theseimprovements are discussed below as near-term improvements.Near-Term ImprovementsPremium Class Service - Many corridor routes in the Amtrak system, includingthe Pacific Surfliners in Southern <strong>California</strong>, offer a premium class (extra fare)coach service, with special amenities for the passengers. This type of service isvery popular and is a source of extra revenue. The San Joaquins offered such aservice briefly in the late 1980’s, but it was not as successful as anticipated.The Department is currently conducting a study of reintroducing “Business Class”(as such service is currently identified) <strong>to</strong> the San Joaquins. Current demandprojections are being developed, and ways <strong>to</strong> accommodate the service using thepresent equipment are being explored. If it proves feasible, premium service couldbe offered in the near future.New Fresno Terminal - One significant market that is not well served by thepresent schedule structure is between the southern half of the San Joaquin Valleyand Southern <strong>California</strong>. Fresno is the largest urban area in the Valley and themost significant intermediate market area on the route. Yet, the earliest departurefrom Fresno <strong>to</strong> Southern <strong>California</strong> is not until almost ten in the morning, becausethe equipment for that departure has <strong>to</strong> originate in Sacramen<strong>to</strong>, over three hours<strong>to</strong> the north. Similarly, because the equipment has <strong>to</strong> continue on <strong>to</strong> Sacramen<strong>to</strong>,107
<strong>2007</strong>-<strong>08</strong> – <strong>2017</strong>-<strong>18</strong> <strong>California</strong> <strong>State</strong> <strong>Rail</strong> <strong>Plan</strong>the last arrival in Fresno from the south originates (by bus) in Los Angeles in themid afternoon, with a Pacific Surfliner connection that leaves San Diego at noon.Currently trains have <strong>to</strong> terminate and originate in Oakland because that is theonly layover facility on the Route. If there were a layover servicing facility inFresno, one or more trains could originate in Fresno earlier in the morning, withLos Angeles arrivals well before noon. In the other direction, it would be possible<strong>to</strong> offer end-of-the-workday and/or early evening departures from Los Angeles ifthe equipment could terminate in Fresno instead of continuing on <strong>to</strong> the north lateat night. The Department is investigating possible locations for such a facility andincludes this project in its ten-year capital program.In addition <strong>to</strong> allowing improved scheduling opportunities for Fresno and thesouthern San Joaquin Valley, the Fresno layover facility would provideoperational cost savings. The first northbound train in the morning is very lightlypatronized out of Bakersfield, because of its early departure time (presently before5:00 a.m.). Originating that train in Fresno would eliminate about one hundredmiles of operating costs, while preserving service <strong>to</strong> the primary markets on thatschedule. Similarly, terminating the last southbound train in Fresno would savecosts and improve its efficiency.Passenger On-Board Wireless Internet Service - Wireless internet service isbecoming commonplace. The Capi<strong>to</strong>l Corridor offered internet service inselected cars on a pilot basis, but the CCJPA did not continue the service becauseusage dropped off significantly when a fee was charged for the service. Also as aresult of the pilot, the CCJPA learned that the most effective system would haveboth passenger and train operating applications. The CCJPA is now working <strong>to</strong>implement this system. The Department would like <strong>to</strong> add passenger on-boardwireless internet capabilities <strong>to</strong> the equipment assigned <strong>to</strong> the San Joaquins.However, this may not be possible unless the wireless system is linked <strong>to</strong> a morecomprehensive system-wide network involving operational applications(see below for more information).Au<strong>to</strong>mated Ticket Validation - Au<strong>to</strong>mated Ticket Validation is a wirelessapplication that can be implemented in advance of a full wireless network.It would improve cus<strong>to</strong>mer service, operations, and safety. <strong>Rail</strong> passengers havebeen able <strong>to</strong> make reservations and purchase tickets over the internet for sometime, but the tickets purchased are traditional paper tickets and must be mailed <strong>to</strong>the purchaser or picked up at an Amtrak ticket office prior <strong>to</strong> departure. Airlineswent one step farther and introduced “paperless” ticketing several years ago.A similar system for train travel would be much more convenient for passengers,particularly those boarding at small un-staffed stations along the route, because itwould eliminate the need <strong>to</strong> obtain actual paper tickets prior <strong>to</strong> traveling orpurchasing them on board.1<strong>08</strong>
Chapter VII – San Joaquin RouteThe system would also have many operational advantages. It would produce areal-time record of all passengers on-board. This is a safety and security featuresimilar <strong>to</strong> that currently required of the passenger airline industry. This systemwould allow actual trip origin-destination information, instead on the currentestimates (particularly for 10-ride and monthly tickets), <strong>to</strong> better informmanagement of actual usage, thus allowing better insight and management of theservice delivered <strong>to</strong> the cus<strong>to</strong>mer.The CCJPA in early 20<strong>08</strong> is undertaking an au<strong>to</strong>mated ticket validation pilotproject that is funded by the Department. Depending upon the results,the Department may expand implementation <strong>to</strong> this Route.Longer-Term ImprovementsElectronic Train Management System - The Department is investigating the useof an electronic train management system. On the San Joaquins, the patentedElectronic Train Management System (ETMS) system is being evaluated, as this isthe system BNSF has chosen <strong>to</strong> utilize. ETMS is a wireless network ofcommunication between locomotives, wayside signaling systems and dispatchersthat functions as a safety overlay on <strong>to</strong>p of existing train control and signalsystems. The purpose is <strong>to</strong> improve safety and <strong>to</strong> prevent train collisions andaccidents. A computerized system is installed inside each locomotive that receivesinformation from the railroad’s existing Global Positioning System (GPS)network, and once the train is underway, ETMS tracks the train’s location. ETMScan: override and au<strong>to</strong>matically control train speed, relay information such asspeed limits and track switch positions <strong>to</strong> a computer screen inside the locomotivecab, sending warnings <strong>to</strong> the crew, and au<strong>to</strong>matically starting the braking process(if the crew does not respond promptly). ETMS is a significant safety miles<strong>to</strong>nefor the rail industry.The Department first plans <strong>to</strong> implement ETMS on the San Joaquin Route becausea majority of the railroad track is owned by BNSF <strong>Rail</strong>way who plans <strong>to</strong> installETMS in the next few years. As a pilot project in 2004, BNSF installed ETMS on50 of its locomotives along a 135-mile stretch of track in Illinois. In January<strong>2007</strong>, the Federal <strong>Rail</strong>road Administration (FRA) gave approval <strong>to</strong> begin usingETMS on other parts of the BNSF <strong>Rail</strong>way network. Purchase and installation ofETMS components on BNSF-owned segments of <strong>California</strong>'s San Joaquin Routewould greatly increase the flexibility of rail traffic control as well as improve trainmovements and schedule reliability. For example, trains would also be capable ofsafely passing in opposite directions at or near full speed. The BNSF’s currenttentative timeline is <strong>to</strong> begin work in FY 2009-10 and complete work inFY 2010- 11. Funding for the project still needs <strong>to</strong> be finalized.Comprehensive Wireless Network - A comprehensive wireless network couldhave many significant applications for improvement of safety, operations, costcontrol,and cus<strong>to</strong>mer service. Systems such as this are in use <strong>to</strong>day in Europe.109
<strong>2007</strong>-<strong>08</strong> – <strong>2017</strong>-<strong>18</strong> <strong>California</strong> <strong>State</strong> <strong>Rail</strong> <strong>Plan</strong>The network would include hardware installations on the <strong>State</strong>-owned rollings<strong>to</strong>ck and would likely include equipment installations along the right-of-way andother fixed facilities. This network could use similar technology <strong>to</strong> an ETMSsystem, however would be completely separate, as ETMS must be a <strong>to</strong>tally closedsystemin order <strong>to</strong> maintain the high level of accuracy, and lack of failurenecessary for a signal safety system. The benefits of a comprehensive wirelessnetwork are discussed in more detail in Chapter III. The CCJPA is developing aRequest for Proposal (RFP) <strong>to</strong> be ready by 20<strong>08</strong> <strong>to</strong> establish and maintain awireless network. Based on the results of the RFP process, the Department willproceed with implementing a network on the San Joaquins.MULTIMODAL CONNECTIVYThe Department strives <strong>to</strong> make the San Joaquin Route as “seamless” as possiblewith enhanced connectivity <strong>to</strong> other transportation systems.The Department is working <strong>to</strong> improve schedule coordination with theCapi<strong>to</strong>l Corridor and Altamont Commuter Express (ACE) for direct railconnections and connecting <strong>to</strong> Amtrak Thruway buses. In 2003-04,the Department initiated a program on the San Joaquins where conduc<strong>to</strong>rs offerfree transfers <strong>to</strong> participating local transit services. Within the ten-year period,the Department plans <strong>to</strong> expand this program <strong>to</strong> all major transit providers onthe Route. Expansion of marketing and passenger information programs willprovide additional information on multimodal connectivity with local transit.Connecting Amtrak BusesThe extensive network of Amtrak dedicated feeder buses connecting with theSan Joaquins is essential <strong>to</strong> the route, as at least 70 percent of all San Joaquinriders (in 2005-06) used one or more buses for a portion of their trip. Ridershipanalysis shows that feeder bus riders make longer than average trips, and thereforeproduce higher revenues per trip.The Department contracts with Amtrak for the provision of dedicated feeder busservices, and Amtrak then contracts with bus opera<strong>to</strong>rs. The bus routes functionas direct parts of the Amtrak system, with coordinated connections, guaranteedseating, integrated fares and ticketing procedures, and inclusion in Amtrak’scentral information and reservation system in the same manner as the trains.Following is a listing of the San Joaquin bus routes and their major destinations,as well as the Capi<strong>to</strong>l Corridor bus routes that also connect <strong>to</strong> the San Joaquins.Cities that are San Joaquin train connection points are in italics. Cities designatedwith asterisks (*) are not served by all schedules on the route.110
Chapter VII – San Joaquin RouteSan Joaquin Bus RoutesRoute 1 Network–Los Angeles Basin1A–Bakersfield-Los Angeles-San Diego*1B–Bakersfield-Los Angeles-Long Beach*/San Pedro*1C–Bakersfield-Van Nuys/Simi ValleyRoute 3–Sacramen<strong>to</strong> ValleyS<strong>to</strong>ck<strong>to</strong>n*-Sacramen<strong>to</strong>-Redding-Medford*Route 6–South BayS<strong>to</strong>ck<strong>to</strong>n-San Jose-Santa Cruz*Route 7–North Bay/Redwood EmpireMartinez-Santa Rosa-Eureka*-McKinleyville*Route 9–High Desert-Las VegasBakersfield-Las VegasRoute 10–Valley-South CoastBakersfield-Oxnard-Santa BarbaraRoute 12–Antelope ValleyBakersfield-Vic<strong>to</strong>rvilleRoute 15–YosemiteMerced-Yosemite National ParkRoute <strong>18</strong>–Valley-Central Coast<strong>18</strong>A–Hanford-San Luis Obispo-Santa Maria<strong>18</strong>B–Hanford-VisaliaRoute 19–Inland Empire-Coachella ValleyBakersfield-San Bernardino-Riverside-Palm Springs*-Calexico*Route 34–Bay Area - S<strong>to</strong>ck<strong>to</strong>nS<strong>to</strong>ck<strong>to</strong>n-Oakland-San FranciscoCapi<strong>to</strong>l Corridor Bus RoutesRoute 20–Sierra Foothills/High SierraSacramen<strong>to</strong>-Reno/SparksRoute 23–Lake TahoeSacramen<strong>to</strong>-<strong>State</strong>lineAmtrak Bus RouteRoute 99–Trans BayEmeryville-San Francisco111
<strong>2007</strong>-<strong>08</strong> – <strong>2017</strong>-<strong>18</strong> <strong>California</strong> <strong>State</strong> <strong>Rail</strong> <strong>Plan</strong>TRAVEL TIMESCurrent Bakersfield <strong>to</strong> Oakland travel time averages 6 hours-9 minutes, andBakersfield <strong>to</strong> Sacramen<strong>to</strong> averages 5 hours-16 minutes. The Department’sten-year goal is <strong>to</strong> reduce travel times <strong>to</strong> under six hours between Oakland andBakersfield and under five hours between Sacramen<strong>to</strong> and Bakersfield.Running time reductions on both route segments will be accomplished through thecompletion of capital projects included in the unconstrained capital programdescribed in Chapter II. Also, operational improvements such as improveddispatching can reduce travel time.RIDERSHIP, REVENUE, AND FAREBOX RATIOThe Department’s goals for ridership, revenue and farebox ratio will be achievedthrough the capital, operational and service improvements and service expansionsdiscussed in this Chapter as well as in Chapters II, III, and IV. They are asfollows:• Increase annual ridership 80 % from 797,000 <strong>to</strong> 1,432,000.• Increase annual revenues 124 % from $26.5 million <strong>to</strong> $59.4 million.• Increase revenue/cost (farebox) ratio from 46.3% <strong>to</strong> 52.3%.TEN-YEAR TRAIN SERVICE EXPANSION PLANSINCREASED SERVICE FREQUENCIESThe Department anticipates that within the next ten years there will be sufficientdemand <strong>to</strong> support eight train round-trips in the San Joaquin Valley, withtwo additional round-trips operating between Oakland and S<strong>to</strong>ck<strong>to</strong>n.The Department proposes that expansion of the San Joaquin Route frequenciesoccur on the following timetable.2011-12 Third daily Sacramen<strong>to</strong>-Bakersfield round trip,Two new daily roundtrips from S<strong>to</strong>ck<strong>to</strong>n <strong>to</strong> Oakland.2014-15 Fifth daily Oakland-Bakersfield round trip.It is important <strong>to</strong> note that the above start-up dates for service are based only onprojected service needs. Demonstrated ridership demand, approval from Amtrakand the host railroads, availability of equipment, funding and construction ofnecessary capital projects, and provision of additional operating funds will affectwhen each of the service expansions actually can be implemented.OAKLAND-STOCKTONPrior <strong>to</strong> adding the fourth San Joaquin round trip in 1989, the Department reachedagreement with the then-Santa Fe <strong>Rail</strong>way <strong>to</strong> fund a series of track improvementsthat would allow up <strong>to</strong> six round trips over the entire Santa Fe route between112
Chapter VII – San Joaquin RoutePort Chicago and Bakersfield. However, it was decided that the fifth and sixthround trips would operate between Sacramen<strong>to</strong> and Bakersfield, so the authority <strong>to</strong>operate the last two trips between Port Chicago and S<strong>to</strong>ck<strong>to</strong>n (originating inOakland) has not been exercised.The Department is now exploring options for utilizing those two available roundtrip slots west of S<strong>to</strong>ck<strong>to</strong>n. As the result of population growth in easternContra Costa and northern San Joaquin Counties, and increasing ridership on theexisting San Joaquins on this segment, interest in an earlier schedule fromS<strong>to</strong>ck<strong>to</strong>n in<strong>to</strong> the Bay Area (not originating in Bakersfield or Fresno) has grown.Also, two major gaps in the existing Bay Area schedules could be filled byestablishing Oakland-S<strong>to</strong>ck<strong>to</strong>n train connections for one of the Sacramen<strong>to</strong> roundtrips, replacing the existing bus connection. In order <strong>to</strong> begin planning forthe Oakland-S<strong>to</strong>ck<strong>to</strong>n trains, the Department’s ten-year plans include the start oftwo Oakland-S<strong>to</strong>ck<strong>to</strong>n trains in 2011-2012.In April 2006, the Department initiated the San Joaquin Corridor StrategicBusiness <strong>Plan</strong> that includes the detailed study of potential schedules and marketanalysis for the Oakland-S<strong>to</strong>ck<strong>to</strong>n segment of the Route. These trains could run asa stand-alone segment or as part of a longer trip <strong>to</strong> Bakersfield or even Fresno.Dependant upon the results of the study, the Department will refine its plans foradding additional trains on this segment.BAKERSFIELD TO LOS ANGELESCurrently, the San Joaquins operate from Sacramen<strong>to</strong> and Oakland <strong>to</strong> Bakersfieldwith extensive dedicated feeder bus connections <strong>to</strong> Los Angeles and otherSouthern <strong>California</strong> points. About 30 percent of San Joaquin train riders used theBakersfield <strong>to</strong> Los Angeles bus in 2005-06. In view of this extensive use ofconnecting bus services between Bakersfield and Los Angeles, the Department hasfor many years been interested in developing a direct San Joaquin rail extensionbetween these points.The Union Pacific <strong>Rail</strong>road (UP) route between Bakersfield and Los Angelespasses through Mojave and Palmdale. The Bakersfield <strong>to</strong> Mojave section is one ofthe busiest single-track freight lines in the western United <strong>State</strong>s; it is also used byBNSF <strong>Rail</strong>way (formerly Burling<strong>to</strong>n Northern Santa Fe) freight trains operatingon trackage rights. Beyond Mojave, UP’s route <strong>to</strong> Los Angeles goes throughPalmdale then southeast <strong>to</strong> Col<strong>to</strong>n. The former Southern Pacific line south fromPalmdale <strong>to</strong> Los Angeles via Santa Clarita is now owned by the Los AngelesCounty Metropolitan Transportation Authority and is used for Merolink commuterservice between Lancaster and Los Angeles.In 2002, the Department requested that the UP do a <strong>State</strong>-funded rail capacitystudy between Bakersfield and Los Angeles <strong>to</strong> examine intercity passenger railservice on the line. The railroad declined <strong>to</strong> do the study, stating that because113
<strong>2007</strong>-<strong>08</strong> – <strong>2017</strong>-<strong>18</strong> <strong>California</strong> <strong>State</strong> <strong>Rail</strong> <strong>Plan</strong>there is no excess capacity on this line, the addition of regularly scheduledpassenger service would have a detrimental impact the UP’s ability <strong>to</strong> providecompetitive freight rail service.However, the Department remains interested in extending San Joaquin rail service<strong>to</strong> Los Angeles. The San Joaquin Corridor Strategic Business <strong>Plan</strong> RFPmentioned above includes the study of: (1) extending one round-trip on anovernight schedule over the UP/Metrolink route <strong>to</strong> Los Angeles; and/or (2)extending one round-trip on a mid-day schedule over the UP/Metrolink route <strong>to</strong>Los Angeles; and (3) extension of the rail line south <strong>to</strong> the foot of the Grapevinewith new track, which, coupled with the extension of certain Pacific Surflinertrains from Los Angeles north <strong>to</strong> Santa Clarita on existing Metrolink track, wouldreduce the bus portion of a trip <strong>to</strong> just about an hour ride. The Departmentdecided <strong>to</strong> examine this last option as a potential alternative <strong>to</strong> use of the UP’s linebetween Bakersfield and Lancaster. Dependent upon the results of the study, theDepartment may proceed with plans <strong>to</strong> address the gap in rail service betweenBakersfield and Los Angeles.ROUTE ADMINISTRATIONThe <strong>State</strong> and Amtrak share responsibilities for operating the San Joaquins.The <strong>State</strong> funds the Route’s operation, Amtrak operates the trains, and theDepartment is responsible for the oversight of the San Joaquin service through itsoperating contract with Amtrak. The Department coordinates functions such asmarketing, scheduling, and on board services with Amtrak. The <strong>State</strong> owns allSan Joaquin equipment, while Amtrak maintains it. For a further description ofthe financial relationship between Amtrak and the <strong>State</strong>, see Chapter XI.SAN JOAQUIN VALLEY RAIL COMMITTEEThe San Joaquin Valley <strong>Rail</strong> Committee consists of representatives from eachcounty served by the San Joaquin trains and other key counties served by feederbuses. Agency associate members represent Amtrak, CPUC, UP, BNSF,Metropolitan Transportation Commission, Southern <strong>California</strong> Association ofGovernments, and the Department. The committee is informed of all significantmatters affecting the San Joaquins. It provides valuable input <strong>to</strong> the Departmen<strong>to</strong>n all aspects of the service. Section 14074.8 of the Government Code providesthat the committee may confer with the Secretary of the Business, Transportationand Housing Agency (BTH) <strong>to</strong> coordinate intercity passenger rail service for theSan Joaquin Corridor.ROUTE HISTORYTwo daily trains served the San Joaquin Valley immediately prior <strong>to</strong> May 1971when Amtrak was formed. Each train used a different route through the Valley,and was operated by a different railroad, with different destinations. SP operated114
Chapter VII – San Joaquin Routethe San Joaquin Daylight between Oakland and Los Angeles and a connectingtrain, the Sacramen<strong>to</strong> Daylight, from Sacramen<strong>to</strong> that provided a connection withthe San Joaquin Daylight at Tracy. The ATSF operated the San Francisco Chiefbetween the Bay Area and Chicago via S<strong>to</strong>ck<strong>to</strong>n, Fresno and Bakersfield.Amtrak’s initial route structure in May 1971 used the SP’s Coast Line for servicebetween Northern and Southern <strong>California</strong>, leaving the San Joaquin Valleywithout rail passenger service. Public pressure for res<strong>to</strong>ration of rail service beganalmost immediately after the formation of Amtrak. As a result, Amtrak’sappropriation for FFY 1974 included funding for service in the San JoaquinValley. Amtrak selected a joint SP-ATSF route using a connection between thetwo railroads at Port Chicago (near Martinez). In March 1974, the newSan Joaquins entered service between Oakland and Bakersfield, entirely fundedby Amtrak.In 1979, a major reduction in Amtrak’s nationwide route structure was proposed,including the termination of the San Joaquins. However, the <strong>State</strong> reached anagreement with Amtrak <strong>to</strong> continue the train with <strong>State</strong> support under theprovisions of Section 403(b) of the Amtrak Act. Thus, <strong>State</strong> support of the routestarted in Oc<strong>to</strong>ber 1979, and a second Oakland-Bakersfield round trip was addedin February 1980.Service on the San Joaquins has increased from the original single round-trip <strong>to</strong>the current six daily round-trips as follows:2/3/80 Second round-trip added between Oakland and Bakersfield..12/17/89 Third round-trip added between Oakland and Bakersfield.10/25/92 Fourth round-trip added between Oakland and Bakersfield.2/21/99 Fifth round trip added, running between Bakersfield and Sacramen<strong>to</strong>(instead of Oakland); this is the first train service betweenSacramen<strong>to</strong> and the San Joaquin Valley since 1971.3/<strong>18</strong>/02 Sixth round trip added, also between Sacramen<strong>to</strong> and Bakersfield,making two Sacramen<strong>to</strong> round-trips.ROUTE DESCRIPTIONThere are currently six daily round trip trains on the San Joaquin Route, fourbetween Oakland and Bakersfield and two between Sacramen<strong>to</strong> and Bakersfield,with all trains running between S<strong>to</strong>ck<strong>to</strong>n and Bakersfield on the same tracks. Inorder <strong>to</strong> provide the six-frequency service between all points on the route,connecting buses are provided between S<strong>to</strong>ck<strong>to</strong>n and Sacramen<strong>to</strong> for trainsserving Oakland,; for trains serving Sacramen<strong>to</strong>, connecting buses are providedbetween S<strong>to</strong>ck<strong>to</strong>n, Oakland and San Francisco.115
<strong>2007</strong>-<strong>08</strong> – <strong>2017</strong>-<strong>18</strong> <strong>California</strong> <strong>State</strong> <strong>Rail</strong> <strong>Plan</strong>Scheduled train-running time between Bakersfield and Oakland averages 6 hours-9 minutes. Overall average speed, including station dwell time, is 51.3 mph.Scheduled train running time between Sacramen<strong>to</strong> and Bakersfield averages5 hours-16 minutes, and overall average speed is 53.7 mph. The maximum trackspeed on the San Joaquin Route is 79 miles per hour.The San Joaquin Route comprises 365 route miles, 316 miles between Oaklandand Bakersfield with 13 intermediate s<strong>to</strong>ps, and 49 miles between Sacramen<strong>to</strong> andS<strong>to</strong>ck<strong>to</strong>n with one additional intermediate s<strong>to</strong>p. Amtrak operates the San Joaquinsunder provisions of its contracts with the BNSF and UP. Predominant right-ofwayownership is by the BNSF (Port Chicago-Bakersfield). The UP owns39 miles at the north end of the route between Oakland and Port Chicago and49 miles in the segment between S<strong>to</strong>ck<strong>to</strong>n and Sacramen<strong>to</strong>. See Figure 7B, whichdescribes the current ownership, segment mileage, and track and signalcharacteristics of the San Joaquin Route.Figure 7BSAN JOAQUIN ROUTEOWNERSHIP AND TRACK CHARACTERISTICSBetweenMilePost AndMilePostRouteMilesOwnerof Track*No. ofTracksMaxSpeedSignalSystemOakland Jack LondonSquare 7.0Oakland 10thStreet **4.2 2.8 UP 2 40/60 ABSOakland 10th Street **2.2 Martinez 31.7 29.5 UP 2 40/60 ABS31.7 =Martinez1169.3 Port Chicago 1164 5.8 UP 1 30 ABS/DTCPort Chicago 1163.5 S<strong>to</strong>ck<strong>to</strong>n 1121 42.1 BNSF 1-2 79 ABS/CTCSacramen<strong>to</strong>Sacramen<strong>to</strong> 89.0 (Elvas) 91.8 2.8 UP 2 35 ABS/CTCSacramen<strong>to</strong> (Elvas)91.8=38.8 S<strong>to</strong>ck<strong>to</strong>n 84.7 45.9 UP 1 60 CTCS<strong>to</strong>ck<strong>to</strong>n 1121.4 Bakersfield 887.7 233.7 BNSF 1 79 CTCTotal 362.6* General Number of Mainline Tracks** Miles represent distances between post miles from both directions <strong>to</strong> an approximate location near10th Street in Oakland.Owners:BNSF - BNSF <strong>Rail</strong>way CompanyUP - Union Pacific <strong>Rail</strong>road CompanySignal Systems:ABS - Au<strong>to</strong>matic Block Signals - Possession of a segment of track (block) is protected bya wayside signal. Switches must be thrown manually by train crews entering sidings.CTC - Centralized Traffic Control - Wayside signals protect possession of blocks. Signals andpowered switches are also remotely controlled from the dispatching center <strong>to</strong> direct themovement of trains.DTC - Direct Traffic Control - Dispatching center gives authority for train movement by radio<strong>to</strong> train crew directly.116
Chapter VII – San Joaquin RouteHISTORICAL PERFORMANCEFigure 7C shows ridership and financial performance data on an annual (<strong>State</strong> FY)basis from the start of <strong>State</strong>-supported service in 1979-80 through 2005-06.Ridership and revenues have increased at a fairly steady rate over that period, ashave expense, loss, and <strong>State</strong> cost. Farebox ratio was at a high in 1988-89, and hassince dropped. This is largely because Amtrak has been steadily increasing theamount and type of costs that are included in the farebox ratio. (See Chapter XIfor more information on this subject.) 2005-06 was an excellent year for theRoute, with farebox at its highest since 1995-96, and ridership at an all-time peak,and four percent above the previous annual high in 2004-05.117
<strong>2007</strong>-<strong>08</strong> – <strong>2017</strong>-<strong>18</strong> <strong>California</strong> <strong>State</strong> <strong>Rail</strong> <strong>Plan</strong>Figure 7CSAN JOAQUIN RouteAnnual Operating Performance - <strong>State</strong> Fiscal Years<strong>State</strong> Ridership Data Financial Data for OperationsFiscal Train Loss FareboxYear Ridership PM/TM Revenue Expense Loss <strong>State</strong> Cost Amtrak Cost per PM RatioNotes (F1) (F2) (F3) (F4) (F5) (F6)1973-74 (S1) 38,770 83.61974-75 66,990 44.21975-76 66,530 43.81976-77 87,642 56.01977-78 80,611 52.71978-79 87,645 60.21979-80 (S2) 123,275 63.6 $ 1,174,065 $ 3,975,<strong>18</strong>5 $ 2,801,120 $ 5<strong>18</strong>,206<strong>18</strong>.4¢ 29.5%1980-81 159,498 55.3 $ 2,224,137 $ 6,940,934 $ 4,716,797 $ 1,360,391<strong>18</strong>.4¢ 32.0%1981-82 <strong>18</strong>9,479 65.3 $ 3,115,710 $ 7,774,029 $ 4,658,319 $ 2,228,58514.0¢ 40.1%1982-83 <strong>18</strong>6,121 62.9 $ 3,342,137 $ 7,991,697 $ 4,649,560 $ 2,490,27514.6¢ 41.8%1983-84 248,275 85.3 $ 4,730,431 $ 8,094,789 $ 3,364,358 $ 2,5<strong>18</strong>,0667.3¢ 58.4%1984-85 269,837 94.6 $ 5,210,951 $ 8,641,293 $ 3,430,342 $ 2,802,9557.7¢ 60.3%1985-86 280,798 101.1 $ 5,425,329 $ 8,610,554 $ 3,<strong>18</strong>5,225 $ 2,658,8956.8¢ 63.0%1986-87 304,668 106.1 $ 6,<strong>08</strong>4,677 $ 9,179,133 $ 3,094,456 $ 2,929,1485.1¢ 66.3%1987-88 340,573 121.1 $ 7,457,686 $ 9,633,659 $ 2,175,973 $ 2,605,5722.2¢ 77.4%1988-89 370,190 133.7 $ 9,527,268 $ 10,968,216 $ 1,440,948 $ 1,887,4501.3¢ 86.9%1989-90 (S3) 4<strong>18</strong>,768 116.9 $ 11,845,743 $ 15,286,520 $ 3,440,777 $ 3,544,3323.2¢ 77.5%1990-91 463,906 104.1 $ 12,691,986 $ <strong>18</strong>,456,785 $ 5,764,799 $ 5,803,5654.9¢ 68.8%1991-92 483,593 104.3 $ 12,369,805 $ <strong>18</strong>,633,777 $ 6,263,972 $ 6,472,5984.3¢ 66.4%1992-93 (S4) 516,113 109.6 $ 12,628,496 $ 22,227,149 $ 9,598,653 $ 10,789,6516.5¢ 56.8%1993-94 558,569 94.6 $ 13,894,624 $ 26,678,861 $ 12,784,237 $ 12,335,021 $ 3,937,150 8.3¢ 52.1%1994-95 524,680 88.8 $ 12,244,668 $ 25,077,153 $ 12,832,485 $ 12,668,0<strong>18</strong> $ 3,705,069 9.7¢ 48.8%1995-96 526,<strong>08</strong>8 86.6 $ 12,477,497 $ 25,386,099 $ 12,9<strong>08</strong>,602 $ 14,483,048 $ 1,360,327 11.8¢ 49.2%1996-97 652,544 106.1 $ 13,817,681 $ 34,528,165 $ 20,710,484 $ 16,265,387 $ 5,672,236 <strong>18</strong>.6¢ 40.0%1997-98 702,178 1<strong>18</strong>.0 $ 15,230,966 $ 36,517,290 $ 21,286,324 $ 17,190,515 $ 4,493,597 17.7¢ 41.7%1998-99 (S5) 680,687 102.8 $ 16,496,457 $ 37,269,835 $ 20,773,378 $ 19,938,254 $ 1,712,168 17.6¢ 44.3%1999-00 671,295 92.7 $ <strong>18</strong>,061,512 $ 41,791,782 $ 23,730,270 $ 24,232,326 $ 652,236 19.0¢ 43.2%2000-01 710,833 97.9 $ 19,667,681 $ 43,404,325 $ 23,736,644 $ 24,350,127 $ 540,809 <strong>18</strong>.2¢ 45.3%2001-02 (S6) 733,152 96.9 $ 20,114,693 $ 46,503,548 $ 26,388,855 $ 26,281,035 $ 396,392 20.0¢ 43.3%2002-03 769,7<strong>08</strong> 89.9 $ 20,3<strong>18</strong>,564 $ 50,552,529 $ 30,233,965 $ 29,729,650 $ 504,315 21.7¢ 40.2%2003-04 752,227 87.2 $ 22,100,796 $ 50,061,460 $ 27,960,664 $ 27,960,664 $ 89,345 20.5¢ 44.1%2004-05 743,245 85.1 $ 22,590,880 $ 49,883,689 $ 27,292,809 $ 27,292,8<strong>08</strong>19.6¢ 45.3%2005-06 801,242 91.1 $ 25,869,979 $ 55,226,742 $ 29,356,763 $ 29,356,76319.0¢ 46.8%TOTAL 13,609,730 $ 330,714,419 $ 679,295,198 $ 348,580,779 $ 330,693,305(S1) Service started 3/6/74 with one round-trip between Oakland and Bakersfield. Data is for four months only.(S2) <strong>State</strong> support started 10/1/79. Data is for nine months, during which time ridership <strong>to</strong>taled 93,206.Second round trip added 2/3/80 between Oakland and Bakersfield.(S3) Third round trip added 12/17/89 between Oakland and Bakersfield.(S4) Fourth round trip added 10/25/92 between Oakland and Bakersfield.(S5) Fifth round-trip added 2/21/99 between Sacramen<strong>to</strong> and Bakersfield.(S6) Sixth round-trip added 3/<strong>18</strong>/02 between Sacramen<strong>to</strong> and Bakersfield.(F1)(F2)(F3)(F4)(F5)(F6)Passenger-miles per train mile (PM/TM), a measure of the average load on a train over its entire route.Prior <strong>to</strong> Oc<strong>to</strong>ber 1983, all trains billed on solely related cost basis. From Oc<strong>to</strong>ber 1983 through September 1995, all trains billed onshort term avoidable cost basis, except fourth round trip billed at long term avoidable cost basis. Effective Oc<strong>to</strong>ber 1995, all trainsbilled on long term avoidable cost basis. Effective Oc<strong>to</strong>ber 1996, all trains billed on Full Cost (Train, Route and System) Basis.Includes cost of connecting buses. Depreciation and interest (equipment capital cost) included in operating cost undersolely-related cost basis but excluded and charged separately under short-term, long-term avoidable and full cost bases.From Oc<strong>to</strong>ber 1979 through September 1983, <strong>State</strong> cost increased in stages from <strong>18</strong>.5 <strong>to</strong> 48.5 percent of operating loss (includingequipment costs). Between Oc<strong>to</strong>ber 1983 and September 1995, <strong>State</strong> cost was 65 percent of train operating loss for first threeround trips, plus 50 percent of depreciation and interest (equipment capital cost). For the fourth round trip, <strong>State</strong> cost was70 percent of train operating loss plus equipment capital cost. Between Oc<strong>to</strong>ber 1995 and September 1996, <strong>State</strong> cost was100 percent of train operating loss and 60 percent of equipment capital cost. Between Oc<strong>to</strong>ber 1996 and September 1997, <strong>State</strong> costwas 65 percent of train operating loss. Effective Oc<strong>to</strong>ber 1997, <strong>State</strong> is billed contractually specified percentages of most individualcost elements, plus a fixed amount for certain other cost elements. Also includes <strong>State</strong> payment of costs of special agreements withAmtrak for use of equipment, and <strong>State</strong> payment of entire net cost of all connecting bus routes.Beginning in <strong>State</strong> Fiscal Year 1993-94, Amtrak cost is based on billings submitted and reflects cost bases and Amtrak shares asstated in notes (F2) and (F3) above. However, Amtrak does not include the unbilled Amtrak share of fixed cost elements.Prior <strong>to</strong> FY 1993-94, data <strong>to</strong> calculate Amtrak cost is not available. Does not represent the difference between Loss and<strong>State</strong> Cost, as the latter includes bus expenses and equipment capital costs not included in Amtrak costs.Train loss (deficit) per train passenger-mile. Connecting buses not included in loss per passenger mile data.Farebox Ratio, the ratio of Revenue <strong>to</strong> Expense.1<strong>18</strong>
119Chapter VII – San Joaquin Route
<strong>2007</strong>-<strong>08</strong> – <strong>2017</strong>-<strong>18</strong> <strong>California</strong> <strong>State</strong> <strong>Rail</strong> <strong>Plan</strong>Figure 8A120
Chapter VIII – The Capi<strong>to</strong>l CorridorCHAPTER VIIITHE CAPITOL CORRIDORAUBURN-SACRAMENTO-OAKLAND-SAN JOSEPRINCIPAL <strong>2007</strong>-<strong>08</strong> <strong>to</strong> <strong>2017</strong>-<strong>18</strong> ROUTE OBJECTIVES• Maintain On-Time Performance at 90% throughout the ten-year period.• Enhance cus<strong>to</strong>mer satisfaction.o Release RFP in 20<strong>08</strong> <strong>to</strong> implement comprehensive wireless network forcus<strong>to</strong>mer internet access and operation applications. Implement systemas feasible.o Implement Au<strong>to</strong>mated Ticket Validation System.o Implement on-board safety and security cameras.o Implement Cus<strong>to</strong>mer Relationship Management ticketing databasesystem, as feasible.• Improve multimodal connectivity, establish transfer agreements andcoordinated schedules with all local transit systems.• Reduce Travel Times by up <strong>to</strong> 12%.• Increase annual ridership 90 percent from 1,450,000 <strong>to</strong> 2,759,000.• Increase annual revenues 154 percent from $<strong>18</strong>.1 million <strong>to</strong> $46 million.• Increase revenue/cost (farebox) ratio from 40.0 percent <strong>to</strong> 46.1 percent.• Increase Service Frequency:o From 16 <strong>to</strong> <strong>18</strong> daily round-trips between Oakland and Sacramen<strong>to</strong>.o From 7 <strong>to</strong> 16 daily round-trips between San Jose and Oakland.o From 1 <strong>to</strong> 10 daily round-trips between Sacramen<strong>to</strong> and Roseville.o From 1 <strong>to</strong> 4 daily round-trips between Roseville and Auburn.• Expand Service:o Sacramen<strong>to</strong>-Reno – first daily round-trip in 2014-15, second dailyround-trip in 2016-17.o Support Auburn-Oakland Regional <strong>Rail</strong> Service commuter systemplanning.o Coordinate with Caltrain on the Dumbar<strong>to</strong>n <strong>Rail</strong> Corridor commuter railexpansion.121
<strong>2007</strong>-<strong>08</strong> – <strong>2017</strong>-<strong>18</strong> <strong>California</strong> <strong>State</strong> <strong>Rail</strong> <strong>Plan</strong>This Chapter presents the ten-year operational and service improvement and trainservice expansion plans for the Route. The Chapter also provides information onroute administration, route his<strong>to</strong>ry, route description, and his<strong>to</strong>rical performance.The CCJPA’s Marketing Program is discussed in Chapter IV, Marketing Program.Figure 8A is the Capi<strong>to</strong>l Corridor Route map, including the connecting buses.ROUTE ADMINISTRATIONThe administrative structure of the Capi<strong>to</strong>l Corridor Route differs from thePacific Surfliner and San Joaquin Routes. The Capi<strong>to</strong>l Corridor Joint PowersAuthority (CCJPA) has responsibility for management of the Route, while the<strong>State</strong> continues <strong>to</strong> fund the service operation and many capital projects.Amtrak operates the trains, the CCJPA is responsible for the oversight of theCapi<strong>to</strong>l Corridor service through its operating contract with Amtrak, and the <strong>State</strong>funds the service. The CCJPA coordinates functions such as marketing,scheduling, and on board services with Amtrak, and also coordinates somefunctions with the Department, such as marketing. The <strong>State</strong> owns all equipmentin the Northern <strong>California</strong> fleet (used by both the Capi<strong>to</strong>l Corridor and theSan Joaquins), while Amtrak maintains it and the CCJPA oversees Amtrak’smaintenance work. For a description of the financial relationship between Amtrakand the <strong>State</strong>, see Chapter XI.Local agencies have always had an active role in planning and promoting theCapi<strong>to</strong>l Corridor. Initially the Assembly Concurrent Resolution (ACR) PolicyAdvisory Committee, formed as part of the ACR 132 study, acted in an advisorycapacity <strong>to</strong> make recommendations about the route. Chapter 263, Statutes of 1996(SB 457 - Kelly), allowed the <strong>State</strong> <strong>to</strong> enter in<strong>to</strong> an interagency transfer agreement(ITA) with a joint powers authority <strong>to</strong> assume responsibility for intercity railservices on the Capi<strong>to</strong>l Corridor. The Department and the CCJPA executed anITA on July 1, 1998, transferring the responsibilities of management for theCapi<strong>to</strong>l Corridor <strong>to</strong> the CCJPA. The Bay Area Rapid Transit (BART) GeneralManager and designated BART staff provide administrative support <strong>to</strong> theCCJPA.Pursuant <strong>to</strong> the ITA, Business Transportation and Housing Agency (BTH) hasresponsibility for allocating operating funds <strong>to</strong> the CCJPA. BTH also reviews andapproves the CCJPA’s business plan that includes future service levels andfunding needs. Chapter 263 specified the composition of the CCJPA. The CCJPABoard must have the following 16 members: six representatives from the BARTBoard of Direc<strong>to</strong>rs (two residents each from Alameda County, Contra CostaCounty, and the City and County of San Francisco); and two members each fromthe Board of Direc<strong>to</strong>rs of the Sacramen<strong>to</strong> Regional Transit District, the Board ofDirec<strong>to</strong>rs of Santa Clara Valley Transportation Authority (VTA), the Yolo CountyTransportation District, the Solano Transportation Authority, and thePlacer County Transportation <strong>Plan</strong>ning Agency.122
Chapter VIII – The Capi<strong>to</strong>l CorridorTEN-YEAR OPERATIONAL AND SERVICE IMPROVEMENTPLANSON-TIME PERFORMANCEThe CCJPA’s goal is <strong>to</strong> maintain on-time-performance (OTP) at a minimum of90 percent throughout the <strong>Plan</strong> period. This goal is based on the fullimplementation of the unconstrained capital program described in Chapter II.Increased OTP provides improved service reliability and is the most effective <strong>to</strong>olfor gaining and securing ridership. OTP has consistently been the underperformingmeasure since the inception of service. In December 2003, Amtrak,CCJPA and Union Pacific <strong>Rail</strong>road (UP) revised the incentive payments <strong>to</strong> becalculated separately from UP’s incentive payments for other Amtrak trains; this isintended <strong>to</strong> give the UP more incentive <strong>to</strong> increase OTP on this route. OTP over92 percent receives increased incentive payments. This measure has had somesuccess but more successful have been the ongoing discussions with UP and stepstaken early in <strong>2007</strong> by UP <strong>to</strong> revise their freight rail operating plan <strong>to</strong> free upcapacity for freight long-hauls and passenger trains, thus improving servicereliability and OTP.Most capital funds received in the past and programmed or planned are aimed atprojects <strong>to</strong> improve reliability and capacity. The increase in capacity provides theUP dispatchers more options <strong>to</strong> maintain reliable, on-time service for all trainsoperating on the route, as well as allowing additional frequencies when approvedby the UP as part of the project agreement.ENHANCE CUSTOMER SATISFACTIONThe CCJPA’s June 2005 Vision <strong>Plan</strong> contains a number of goals for improvingcus<strong>to</strong>mer satisfaction. Use of technology and innovation is a major theme fromthe Vision <strong>Plan</strong>. Some programs have already been initiated including expandedticket vending machines, online and voice recognition trip planning and trainstatus updates, and public information displays. Future projects include wirelessinternet access with the potential for real-time on-board digital information onoperations, au<strong>to</strong>mated ticket validation on board the trains, and a revised ticketingand data management process that will emphasize a better cus<strong>to</strong>mer relationship,termed cus<strong>to</strong>mer relationship management (CRM).COMPREHENSIVE WIRELESS NETWORKBeginning in fall of 2003, the Capi<strong>to</strong>l Corridor offered internet service in selectedcars on a pilot basis. Usage dropped off significantly when a fee was charged forthe service, and the CCJPA learned through research that more technologies thatcould perform at a higher level were becoming available. As well, the CCJPA didnot understand the precise business models that could allow the service <strong>to</strong> workfor both passengers and the rail opera<strong>to</strong>r. The CCJPA is now poised <strong>to</strong> procuresuch a system after additional research with experts in the wireless industry,123
<strong>2007</strong>-<strong>08</strong> – <strong>2017</strong>-<strong>18</strong> <strong>California</strong> <strong>State</strong> <strong>Rail</strong> <strong>Plan</strong>additional technology trials, and development of partnerships around the world inthis new industry. The CCJPA is developing a Request for Proposal (RFP) <strong>to</strong> beready by 20<strong>08</strong> <strong>to</strong> establish and maintain a wireless network.A comprehensive wireless and wired network could have many significantapplications for improvement of safety, operations, cost-control, and cus<strong>to</strong>merservice. Systems such as this are in use <strong>to</strong>day in Europe on several railway lines,and more are in the planning and development stages. The network would includehardware installations on the <strong>State</strong>-owned rolling s<strong>to</strong>ck and would likely includeequipment installations along the right-of-way (ROW) and other fixed facilities.Such a system can allow for data <strong>to</strong> be sent between all points in the railwayservice, from stations, maintenance facilities, a future safety/security center, and,of course, the moving trains. The benefits of a comprehensive wireless networkare discussed in more detail in Chapter III.Au<strong>to</strong>mated Ticket ValidationAu<strong>to</strong>mated Ticket Validation (ATV) is a wireless application that can beimplemented in advance of a full wireless network. It would improve cus<strong>to</strong>merservice, operations, and safety. <strong>Rail</strong> passengers have been able <strong>to</strong> makereservations and purchase tickets over the internet for some time now, but thetickets purchased are traditional paper tickets and must be mailed <strong>to</strong> the purchaseror picked up at an Amtrak ticket office prior <strong>to</strong> departure. Airlines went one stepfarther and introduced “paperless” ticketing several years ago. A similar systemfor train travel would be much more convenient for many passengers, particularlythose boarding at small un-staffed stations along the route, because it wouldeliminate the need <strong>to</strong> obtain actual paper tickets prior <strong>to</strong> traveling.On-board the system would also have many operational advantages. It wouldproduce a real-time record of all passengers on-board. This is a significant safetyand security feature and will be similar <strong>to</strong> that currently required of the passengerairline industry. This system would also allow actual trip origin-destinationinformation, instead on the current estimates (particularly for 10-ride and monthlytickets), <strong>to</strong> better inform management of actual usage, thus allowing better insightand management of the service delivered <strong>to</strong> the cus<strong>to</strong>mer.In early 20<strong>08</strong> the CCJPA is undertaking an au<strong>to</strong>mated ticket validation pilotproject. Dependant upon the results of this project, the CCJPA will implementthis project.Safety and Security ApplicationsA wireless/wired network with sufficient bandwidth <strong>to</strong> transmit digitized livevideo is a significant advancement for safety and security for the passenger railindustry. CCJPA is specifying in its RFP for a wireless network, a network thatcan provide sufficient bandwidth <strong>to</strong> allow video cameras along the railway line, atstations, and other facilities that can be viewed in real-time, and activated using124
Chapter VIII – The Capi<strong>to</strong>l Corridorvideo analysis <strong>to</strong> allow greater ability <strong>to</strong> respond <strong>to</strong> potential or real incidents.Use of cameras is a key component of CCJPA’s Security <strong>Plan</strong> (June <strong>2007</strong>) that,combined with several other measures, such as the ATV program, will provide theability for an unprecedented level of security.Cus<strong>to</strong>mer Relationship Management (CRM)Cus<strong>to</strong>mer Relationship Management (CRM) also uses new technology <strong>to</strong> improvethe information exchange between the rail opera<strong>to</strong>r and the cus<strong>to</strong>mer that isinitiated with ticket sales. CRM is centered on a greatly improved ticket salesdatabase system. CRM ties <strong>to</strong>gether the sales, cus<strong>to</strong>mer service, marketing, andsupply chain/operations activities <strong>to</strong> deliver service <strong>to</strong> the cus<strong>to</strong>mer.Many businesses are using CRM <strong>to</strong> gain better sales and cus<strong>to</strong>mer data andstreamline cus<strong>to</strong>mer service processes. In many other industries, and most notably,the airline industry, cus<strong>to</strong>mers are accus<strong>to</strong>med <strong>to</strong> a detailed level of cus<strong>to</strong>merservice that is typically delivered via CRM.The train cus<strong>to</strong>mer could use this system <strong>to</strong> get train-related information tailored<strong>to</strong> their needs, such as electronic alerts on specific trains, general rail serviceupdates, special promotions/offers, and other communication as requested by thecus<strong>to</strong>mer. In turn, Amtrak <strong>California</strong> would gain valuable demographic cus<strong>to</strong>merdata that would provide a better understanding of the cus<strong>to</strong>mers and provide a <strong>to</strong>ol<strong>to</strong> deliver service that is more closely aligned with the cus<strong>to</strong>mer’s needs anddesires. Data from a CRM system would allow management <strong>to</strong> use predictiveanalytics <strong>to</strong> determine cus<strong>to</strong>mer travel and usage patterns. As well, in themarketing arm of cus<strong>to</strong>mer relations, the data would allow for improvedpromotions and techniques <strong>to</strong> build cus<strong>to</strong>mer trust and loyalty, which is nearlyimpossible with <strong>to</strong>day’s system.The relationship between the wireless network, au<strong>to</strong>mated ticket validation, andCRM is inter-connected. They are linked through the use of technology anddatabases <strong>to</strong> gain a unified, cost-effective platform for improving passenger railoperations in general. The CCJPA will continue <strong>to</strong> research the feasibility ofimplementing these systems.MULTIMODAL CONNECTIVITYMultimodal connectivity is one of the CCJPA’s Core Service Objectives in their2005 Vision <strong>Plan</strong>. The Route has stations that connect <strong>to</strong> BART, Caltrain, ACE,VTA, and Sacramen<strong>to</strong> Regional Transit Light <strong>Rail</strong>. The CCJPA has expandedtheir Transit Transfer Program where free transfers <strong>to</strong> local transit are offered <strong>to</strong>passengers, <strong>to</strong> additional transit providers and now has nearly all conceivable localtransit services in the program. The CCJPA will seek <strong>to</strong> expand successfulpartnerships that coordinate with local transit providers <strong>to</strong> offer connecting busservice <strong>to</strong> the Capi<strong>to</strong>l Corridor.125
<strong>2007</strong>-<strong>08</strong> – <strong>2017</strong>-<strong>18</strong> <strong>California</strong> <strong>State</strong> <strong>Rail</strong> <strong>Plan</strong>Connecting Amtrak BusesThe CCJPA contracts with Amtrak for the provision of dedicated feeder busservices, and Amtrak then contracts with bus opera<strong>to</strong>rs or local transit opera<strong>to</strong>rs.The bus routes function as direct parts of the Amtrak system, with coordinatedconnections, guaranteed seating, integrated fares and ticketing procedures, andinclusion in Amtrak’s central information and reservation system in the samemanner as the trains. The CCJPA has established partnerships with local transitproviders <strong>to</strong> operate the Highway 17 Express, the Highway 49 Express, and withthe Route 50 between San Jose and Monterey which are timed <strong>to</strong> coordinate withon-time train service.Below is a listing of the Capi<strong>to</strong>l Corridor bus routes and their origins/destinations,as well as the San Joaquin bus routes that also connect <strong>to</strong> the Capi<strong>to</strong>l Corridor.Cities that are Capi<strong>to</strong>l Corridor train connection points are in italics.Capi<strong>to</strong>l Corridor Bus RoutesRoute 20a/20b–High Sierra/Sierra FoothillsSacramen<strong>to</strong>-Auburn/Reno/SparksRoute 20c–Lake TahoeSacramen<strong>to</strong>-South Lake Tahoe/<strong>State</strong>lineRoute 21–Central CoastOakland-San Jose/San Luis Obispo/Santa BarbaraHighway 17 Express - Santa Cruz (through ticketing with local transit opera<strong>to</strong>r)San Jose-Santa CruzHighway 49 Express (through ticketing with local transit opera<strong>to</strong>r)Auburn-Grass ValleyRoute 50 Express (through ticketing with local transit opera<strong>to</strong>r)San Jose-MontereySan Joaquin Route Bus RoutesRoute 3–Sacramen<strong>to</strong> ValleySacramen<strong>to</strong>-ReddingRoute 7–North Bay/Redwood EmpireMartinez-Eureka/McKinleyvilleAmtrak Bus RouteRoute 99–Trans BayEmeryville-San FranciscoTRAVEL TIMESCurrent Oakland <strong>to</strong> Sacramen<strong>to</strong> travel times average 1 hour-48 minutes (for trainsstarting or ending in Oakland), Oakland <strong>to</strong> San Jose averages 1 hour-3 minutes,and Sacramen<strong>to</strong> <strong>to</strong> Auburn averages 1 hour-2 minutes. The CCJPA’s goal is <strong>to</strong>126
Chapter VIII – The Capi<strong>to</strong>l Corridorreduce average travel time by 12 percent, which would either be competitive orfaster than highway travel times. This goal assumes that the unconstrained capitalprogram described in Chapter II is fully implemented.Prior track improvement projects (Yolo Causeway Second Main Track and theOakland <strong>to</strong> San Jose Track Improvements) have resulted in a reduction in traveltimes and new planned capital projects will provide for additional running timereductions.RIDERSHIP, REVENUE, AND FAREBOX RATIOThe CCJPA’s goals for ridership, revenue, and farebox will be achieved throughthe capital, operational and service improvements, and service expansionsdiscussed in this Chapter as well as in Chapters II, III, and IV.• Increase annual ridership 92 percent from 1,439,000 <strong>to</strong> 2,759,000.• Increase annual revenues 154 percent from $<strong>18</strong>,100,000 <strong>to</strong> $46,000,000.• Increase revenue/cost (farebox) ratio from 40.0 percent <strong>to</strong> 46.1 percent.TEN-YEAR PLANNED TRAIN SERVICE EXPANSION PLANSINCREASED SERVICE FREQUENCIESThe Department, in conjunction with the CCJPA, anticipates there will be eventualdemand for eighteen round-trips on the Capi<strong>to</strong>l Corridor between Sacramen<strong>to</strong> andOakland.It is important <strong>to</strong> note that the start-up dates for service are based on projectedservice needs. Demonstrated ridership demand, approval from Amtrak and therelevant railroad(s), availability of capital funding and equipment, completion ofnecessary capital projects, and availability of additional operating funding willaffect when each of the service improvements can be implemented.The Department and the CCJPA’s proposed expansion of the Capi<strong>to</strong>l Corridor isas follows:2011-12 San Jose-Oakland, eighth, ninth, tenth, and eleventh round-trips.Sacramen<strong>to</strong>-Roseville, second, third, and fourth round-trips.Roseville-Auburn, second round-trip.2013-14 Oakland-Sacramen<strong>to</strong>, seventeenth and eighteenth round-trips.2014-15 San Jose-Oakland, twelfth and thirteenth round-tripsSacramen<strong>to</strong>-Roseville, fifth and sixth round-trips.Roseville-Auburn, third and fourth round-trips.2016-17 Sacramen<strong>to</strong>-Roseville, seventh and eighth round-trips.<strong>2017</strong>-<strong>18</strong> San Jose-Oakland, fourteenth, fifteenth, and sixteenth round-trips.Sacramen<strong>to</strong>-Roseville, ninth and tenth round-trips.127
<strong>2007</strong>-<strong>08</strong> – <strong>2017</strong>-<strong>18</strong> <strong>California</strong> <strong>State</strong> <strong>Rail</strong> <strong>Plan</strong>SACRAMENTO-RENO EXTENSIONThe extension of intercity rail service from Sacramen<strong>to</strong> <strong>to</strong> Reno would bring <strong>State</strong>supportedrail service <strong>to</strong> the Truckee/Tahoe and Reno/Sparks <strong>to</strong>urist areas as wellas provide relief <strong>to</strong> the highly congested I-80 Bay Area <strong>to</strong> Reno corridor.The Department’s and the CCJPA’s plan includes the extension ofone Capi<strong>to</strong>l Corridor round-trip from Auburn <strong>to</strong> Reno/Sparks in 2014-15,and a second round-trip in 2016-17. This rail service would be supplemented bycontinued operation of existing bus service that runs over the same route as thetrain, but at other times of the day. This service would require concurrence by theUnion Pacific <strong>Rail</strong>road, funds <strong>to</strong> implement required track infrastructureimprovements, adequate operating funds, and an appropriate level of financialparticipation from Nevada. For more detailed information on this route expansion,see Chapter X.DUMBARTON RAIL CORRIDORThe CCJPA is participating in the development of the Dumbar<strong>to</strong>n <strong>Rail</strong> Corridor asan extension of Caltrain <strong>to</strong> extend commuter rail service across the Bay betweenthe Peninsula and the East Bay. A phased approach <strong>to</strong> full development is nowplanned due <strong>to</strong> funding constraints. The new service is planned <strong>to</strong> start in 2012with three round-trips probably between Union City and San Francisco, and threeround-trips between Union City and San Jose. Eventually with fullimplementation, Dumbar<strong>to</strong>n <strong>Rail</strong>, could connect <strong>to</strong> the Capi<strong>to</strong>l Corridor at UnionCity where the BART station would be reconstructed as a multimodal terminal(Union City may served by the Capi<strong>to</strong>l Corridor prior <strong>to</strong> Dumbar<strong>to</strong>n <strong>Rail</strong>Service). The CCJPA’s ten-year capital improvement program includes fundingfor station and track work <strong>to</strong> allow the Capi<strong>to</strong>l Corridor trains <strong>to</strong> service the newUnion City terminal. For more detailed information on this route expansion,see Chapter IX.AUBURN-OAKLAND REGIONAL RAIL SERVICESix agencies, including the CCJPA, have partnered and developed a serviceconcept plan for a new regional commuter rail service in the urban corridorextending from Auburn (Bowman) <strong>to</strong> Oakland. The Auburn-Oakland Regional<strong>Rail</strong> Service Concept <strong>Plan</strong> (<strong>Plan</strong>) augments existing Capi<strong>to</strong>l Corridor intercityservice by providing additional peak period capacity for within the greaterSacramen<strong>to</strong> urban area and between Sacramen<strong>to</strong> and the Bay Area. The twoservices would utilize the same equipment, staff, and fare structure, and thuswould appear fully unified <strong>to</strong> the riding public. Initially, the <strong>Plan</strong> included threephases;a first phase, originally planned for 2010 would add four new Sacramen<strong>to</strong>-Oakland round-trips. The second phase, originally planned for 2015, wouldinclude four new Sacramen<strong>to</strong>-Auburn round-trips and one additional Oakland <strong>to</strong>Sacramen<strong>to</strong> round-trip. The third phase, originally planned for 2020, would addnew stations, primarily in the Sacramen<strong>to</strong> metropolitan area. However, it is128
Chapter VIII – The Capi<strong>to</strong>l Corridorexpected that these dates will slip due <strong>to</strong> lack of an identified funding source forrolling s<strong>to</strong>ck and track improvements necessary <strong>to</strong> implement the service.In addition, further discussions with the UP are required <strong>to</strong> establish theparameters <strong>to</strong> implement service. For more detailed information on this routeexpansion, see Chapter IX.ROUTE HISTORYIntercity rail service started on the Capi<strong>to</strong>l Corridor in 1991, making this route thenewest of the three <strong>State</strong>-supported routes. ACR 132 (Hannigan), Statutes of1988, directed the Metropolitan Transportation Commission (MTC), withassistance from the Sacramen<strong>to</strong> Area Council of Governments and the Department<strong>to</strong> conduct a study of the Auburn-Sacramen<strong>to</strong>-Oakland-San Jose intercity railcorridor. The final report titled ACR 132 Intercity <strong>Rail</strong> Corridor Upgrade Studywas published by MTC in 1990 and provided the basis for the initiation of serviceon the Route.Service has increased from the original three round-trips <strong>to</strong> the current sixteen(weekday) round-trips from Oakland <strong>to</strong> Sacramen<strong>to</strong> as follows:12/12/91 San Jose-Oakland-Sacramen<strong>to</strong>: three round-trips with onecontinuing <strong>to</strong> Roseville.4/2/95 Oakland-San Jose: one round-trip discontinued (except on Saturdaynorthbound and Friday, Saturday, Sunday southbound).4/14/96 Oakland-Sacramen<strong>to</strong>: fourth round-trip added.6/17/96 Oakland-San Jose round-trip that was discontinued April 2, 1995, isres<strong>to</strong>red.1/26/98 Train <strong>to</strong> Roseville extended <strong>to</strong> Colfax.10/25/98 Oakland-Sacramen<strong>to</strong>: fifth round-trip added.2/21/99 Oakland-Sacramen<strong>to</strong>: sixth round-trip added.2/27/00 Oakland-Sacramen<strong>to</strong>: seventh round-trip added.Oakland-San Jose: fourth round-trip added.Colfax round-trip cut back <strong>to</strong> Auburn.4/29/01 Oakland-Sacramen<strong>to</strong>: eighth and ninth round-trips added.Oakland-San Jose: fifth and sixth round-trips, added on weekendsonly.10/27/02 Oakland-Sacramen<strong>to</strong>: tenth round-trip, added on weekdays only.1/6/03 Oakland-Sacramen<strong>to</strong>: eleventh round-trip, added on weekdays only.4/28/03 Oakland-Sacramen<strong>to</strong>: twelfth round-trip, added on weekdays only.129
<strong>2007</strong>-<strong>08</strong> – <strong>2017</strong>-<strong>18</strong> <strong>California</strong> <strong>State</strong> <strong>Rail</strong> <strong>Plan</strong>8/26/06 Sacramen<strong>to</strong>-Oakland: thirteenth through sixteenth weekday roundtripsadded (twelfth round-trip added on weekends).Oakland-San Jose: fifth through seventh daily round trips added.ROUTE DESCRIPTIONAs a result of the capital investment in additional track capacity between Oaklandand San Jose, the Capi<strong>to</strong>l Corridor now has seven weekday round-trips betweenOakland and San Jose, sixteen weekday round-trips between Oakland andSacramen<strong>to</strong> (twelve on weekends), and one daily Sacramen<strong>to</strong> <strong>to</strong> Auburn roundtrip.Scheduled running time between Oakland and Sacramen<strong>to</strong> averages 1 hour-48 minutes (for trains starting or ending in Oakland) with the overall speedaveraging 50 mph. Scheduled running time between Oakland and San Joseaverages 1 hour-3 minutes with the overall speed averaging 43 mph. Scheduledrunning time between Sacramen<strong>to</strong> and Auburn averages one hour and two minuteswith the overall speed averaging 34 mphFigure 8BBetween Mile Post And Mile PostRouteMilesOwner ofTrack*No. ofTracksMax.SpeedSignalSystemSan Jose 47.3 Santa Clara 44.4 2.9 PCJPB 3 60 CTCSanta Clara 44.4 Newark 31.4 13.8 UP 1 70 CTCNewark 34.9 Niles Tower 29.7 5.2 UP 2 79 CTCNiles Tower 29.7 West Elmhurst 13.5 16.2 UP 1 70 CTCWest Elmhurst13.5Oakland Jack LondonSquare 7.0 6.5 UP 2 60 ABSOakland - Jack LondonSquare 7.0Oakland 10th Street**4.2 2.8 UP 2 40/60 CTCOakland 10th Street **2.2 Martinez 31.7 29.5 UP 2 40/60 CTCMartinez 31.7 Davis 75.5 43.8 UP 2 79 CTCDavis 75.5 West Causeway 81.1 5.6 UP 2 79 CTCWest Causeway 81.1 East Causeway 85.2 4.1 UP 2 79 CTCEast Causeway 85.2 Sacramen<strong>to</strong> River 88.4 3.2 UP 2 79 CTCSacramen<strong>to</strong> River 88.4 Sacramen<strong>to</strong> 89.0 0.5 UP 2 30 CTCSacramen<strong>to</strong> 89.0 Elvas 91.8 2.8 UP 2 35 CTCElvas 91.8 Roseville 106.6 14.8 UP 2 60 CTCRoseville 106.6 Auburn 124.2 17.6 UP 1 50 ABSTotal 169.3*General number of mainline tracksOwners:CAPITOL CORRIDOROWNERSHIP AND TRACK CHARACTERISTICS**Mileage represents distance between mile posts <strong>to</strong> an approximate location at 10th Street in OaklandPCJPB - Peninsula Corridor Joint Powers BoardUP - Union Pacific <strong>Rail</strong>road CompanySignal Systems:ABS - Au<strong>to</strong>matic Block Signals - Possession of a segment of track (block) is protected by a waysidesignal. Switches must be thrown manually by train crews entering sidings.CTC - Centralized Traffic Control - Wayside signals protect possession of blocks. Signals and poweredswitches are also remotely controlled from the dispatching center <strong>to</strong> direct the movement of trains.130
Chapter VIII – The Capi<strong>to</strong>l CorridorThe Capi<strong>to</strong>l Corridor extends 169 rail miles from Auburn <strong>to</strong> San Jose (35 mileseast of Sacramen<strong>to</strong> and 134 miles west of Sacramen<strong>to</strong>.) Except for three miles ofright of way (ROW) owned by the Peninsula Corridor Joint Powers Board,UP owns this entire route. Amtrak operates the Capi<strong>to</strong>l Corridor under provisionsof its contract with UP. Figure 8B describes the current ownership, segmentmileage, and track and signal characteristics of the Capi<strong>to</strong>l Corridor.HISTORICAL PERFORMANCEFigure 8C shows ridership and financial performance data on an annual basis fromthe start of <strong>State</strong>-supported Amtrak rail passenger service in 1991-92 through2005-06. Ridership and revenues have increased over that period, as haveexpenses, loss, and <strong>State</strong> cost. The farebox ratio on this Route has not fluctuatedas much as on the San Joaquins and Pacific Surfliners for a number of reasons.First, when the Capi<strong>to</strong>l Corridor service started, Amtrak had already begunincreasing costs that are included in the farebox ratio. By 1996-97, Amtrak wascharging a cost basis similar <strong>to</strong> the current basis. Also, the Capi<strong>to</strong>l Corridorservice is still relatively new and has added frequencies at a relatively fast rate.Thus, the growth in revenue tends <strong>to</strong> be offset by new expenses for increasedfrequencies. The Capi<strong>to</strong>l Corridor service has a lower farebox ratio than the othertwo routes, primarily as a result of its shorter trip length. The Capi<strong>to</strong>l Corridorfarebox ratio (40.6 percent in 2005-06) has ranged between a high of 43.4 percentin 1995-96 and a low of 29 percent in 1996-97.OTP on the Capi<strong>to</strong>l Corridor was fairly low during the initial years of the service.With the completion in early 1999 of major track and signal work over much ofthe route, OTP improved considerably. In 2005-06, OTP averaged 72.3 percent.New trackage and signal improvement projects between Oakland and San Jose andthe Yolo Causeway Second Main Track project have improved theCapi<strong>to</strong>l Corridor’s reliability and OTP by facilitating both passenger and freighttrain movements and by providing more opportunities for trains <strong>to</strong> pass each other.In addition, CCJPA funding of a dedicated track maintenance crew has resulted ina significant decrease in slow orders which has further improved OTP over what i<strong>to</strong>therwise would have been.131
<strong>2007</strong>-<strong>08</strong> – <strong>2017</strong>-<strong>18</strong> <strong>California</strong> <strong>State</strong> <strong>Rail</strong> <strong>Plan</strong>Figure 8CCAPITOL CORRIDORAnnual Operating Performance - <strong>State</strong> Fiscal Years<strong>State</strong> Ridership Data Financial Data for OperationsFiscalTrain Loss FareboxYear Ridership PM/TM Revenue Expense Loss <strong>State</strong> Cost Amtrak Cost per PM RatioNotes (F1) (F2) (F3) (F4) (F5) (F6)1991-92 (S1) 173,672 96.3 $ 1,973,255 $ 4,848,967 $ 2,875,712 $ 1,592,90715.0¢ 40.7%1992-93 238,785 67.7 $ 2,970,103 $ 8,333,093 $ 5,362,990 $ 6,712,01720.1¢ 35.6%1993-94 364,070 101.2 $ 3,598,978 $ 9,911,735 $ 6,312,757 $ 6,714,761 $ 1,697,460 15.7¢ 36.3%1994-95 (S2) 349,056 101.7 $ 3,757,146 $ 9,678,401 $ 5,921,255 $ 6,012,315 $ 1,584,692 14.9¢ 38.8%1995-96 (S3) 403,050 111.9 $ 4,805,072 $ 11,077,485 $ 6,272,413 $ 6,434,940 $ 273,025 14.9¢ 43.4%1996-97 496,586 111.3 $ 5,938,072 $ 20,509,999 $ 14,571,927 $ 9,701,519 $ 4,871,345 31.6¢ 29.0%1997-98 (S4) 484,458 109.4 $ 6,212,150 $ 20,597,133 $ 14,384,983 $ 10,830,123 $ 3,555,755 31.8¢ 30.2%1998-99 (S5) 515,768 90.8 $ 6,939,702 $ 22,343,915 $ 15,404,213 $ 14,543,722 $ 969,291 32.6¢ 31.1%1999-00 (S6) 684,334 90.1 $ 8,546,453 $ 25,048,098 $ 16,501,645 $ 17,120,868 $ 194,932 28.2¢ 34.1%2000-01 (S7) 1,030,837 106.0 $ 11,091,742 $ 27,670,759 $ 16,579,017 $ <strong>18</strong>,558,681 $ 92,014 21.0¢ 40.1%2001-02 1,090,713 96.9 $ 12,321,755 $ 32,683,794 $ 20,362,039 $ 21,263,811 $ 99,311 25.3¢ 37.7%2002-03 (S8) 1,129,683 92.0 $ 12,550,<strong>18</strong>2 $ 35,390,303 $ 22,840,121 $ 22,413,396 $ 170,254 28.1¢ 35.5%2003-04 1,148,047 86.3 $ 13,012,806 $ 36,231,990 $ 23,219,<strong>18</strong>4 $ 23,168,004 $ 9,584 28.0¢ 35.9%2004-05 1,239,<strong>08</strong>2 93.1 $ 14,788,299 $ 39,160,356 $ 24,372,057 $ 24,372,05727.3¢ 37.8%2005-06 1,269,964 95.5 $ 15,740,506 $ 38,759,149 $ 23,0<strong>18</strong>,643 $ 23,0<strong>18</strong>,64324.9¢ 40.6%TOTAL 10,6<strong>18</strong>,105 $ 124,246,221 $ 342,245,177 $ 217,998,956 $ 212,457,764(S1)(S2)(S3)(S4)(S5)(S6)(S7)(S8)Service started 12/12/91 with three <strong>State</strong>-supported round trips between Sacramen<strong>to</strong> and San Jose,with one round trip extended <strong>to</strong> Roseville. Data is for six and one-half months only.One round trip discontinued 4/2/95 between Oakland and San Jose (except on Saturday northbound andFriday, Saturday, Sunday southbound.) Feeder bus connection substituted for train.Fourth round trip added 4/14/96 between Sacramen<strong>to</strong> and Oakland.Effective 6/17/96, round trip referred <strong>to</strong> in (S2) above res<strong>to</strong>red <strong>to</strong> daily service between Oakland and San Jose.Effective 1/26/98, the round trip that previously originated and terminated at Roseville was extended <strong>to</strong> Colfax.Fifth round trip added 10/25/98 and sixth round trip added 2/21/99 between Sacramen<strong>to</strong> and Oakland.Effective 2/27/00, seventh round trip added between Sacramen<strong>to</strong> and Oakland; fourth round trip added between Oakland andSan Jose; the round trip <strong>to</strong> Colfax was cut back <strong>to</strong> Auburn.Effective 4/29/01, eighth and ninth round trips added between Sacramen<strong>to</strong> and Oakland;fifth and sixth round trips added between Oakland and San Jose on weekends only.Effective 10/27/02, tenth round trip added; effective 1/6/03, eleventh round trip added; effective 4/28/03, twelfth round tripadded. These additional trains operate weekdays only between Sacramen<strong>to</strong> and Oakland.(F1)(F2)Passenger-miles per train mile (PM/TM), a measure of the average load on a train over its entire route.Through September 1995, all trains billed on long term avoidable cost basis; includes cost of connecting buses.Effective Oc<strong>to</strong>ber 1996, all trains billed on Full Cost (Train, Route and System) Basis.(F3) Though September 1995, <strong>State</strong> cost was 65 percent of train operating loss. Between Oc<strong>to</strong>ber 1995 andSeptember 1996, <strong>State</strong> cost was 100 percent of train operating loss. Between Oc<strong>to</strong>ber 1996 and September 1997,<strong>State</strong> cost was 55 percent of the train operating loss. Effective Oc<strong>to</strong>ber 1997, <strong>State</strong> is billed contractually specifiedpercentages of most individual cost elements, plus a fixed amount for certain other cost elements. Also includes <strong>State</strong>payment of costs of special agreements with Amtrak for use of equipment, special payments for service continuationand <strong>State</strong> payment for entire net cost of all connecting bus routes. Effective Oc<strong>to</strong>ber 1999, the Capi<strong>to</strong>l Corridor JointPowers Authority (CCJPA) and Amtrak entered in<strong>to</strong> a 12 month fixed price operating contract, including all train andbus services. The <strong>State</strong> Costs shown represent the fixed price contract payment less any performance assessments.(F4) Between <strong>State</strong> Fiscal Years 1993-94 and 2003-04, Amtrak cost is based on billings submitted and reflects cost bases andAmtrak shares as stated in notes (F2) and (F3) above. However, Amtrak does not include the unbilled Amtrak share of fixed cost elements.Prior <strong>to</strong> FY 1993-94, data <strong>to</strong> calculate Amtrak cost is not available; beginning in FY 2004-05, no Amtrak share is billed.(F5) Train loss (deficit) per train passenger-mile. Connecting buses not included in loss per passenger mile data.(F6) Farebox Ratio, the ratio of Revenue <strong>to</strong> Expense.132
133Chapter IX – Commuter <strong>Rail</strong> Services
<strong>2007</strong>-<strong>08</strong> – <strong>2017</strong>-<strong>18</strong> <strong>California</strong> <strong>State</strong> <strong>Rail</strong> <strong>Plan</strong>Figure 9A134
Chapter IX – Commuter <strong>Rail</strong> ServicesCHAPTER IXCOMMUTER RAIL SERVICESThis chapter discusses the four existing commuter rail systems in <strong>California</strong>,including their extension plans: Coaster, Metrolink, Caltrain and ACE. Figure 9Ais a map of existing and potential commuter rail services. Figure 9B is a map ofSouthern <strong>California</strong> commuter rail services and Figure 9F is a map ofNorthern <strong>California</strong> commuter rail services (shown later in this chapter).Also discussed are three proposed new commuter rail routes: Ventura andSanta Barbara Commuter <strong>Rail</strong> Service, Sonoma-Marin-Area <strong>Rail</strong> Transit andAuburn-Oakland Regional <strong>Rail</strong>.COASTER COMMUTER RAIL SERVICE(SAN DIEGO-OCEANSIDE)PRINCIPAL <strong>2007</strong>-<strong>08</strong> <strong>to</strong> <strong>2017</strong>-<strong>18</strong> ROUTE SERVICE OBJECTIVES• Increase ridership and improve mobility in the region.• Implement and improve timed transfers at various stations and transitcenters.• Initiate and continue implementation of the Cus<strong>to</strong>mer AmenitiesProgram.• Implement incremental service increases, if feasible, including:supplementary mid-day service, reverse peak service, evening service,special events service and weekend service.CAPITAL IMPROVEMENT OBJECTIVESFUNDED:• Construct Oceanside passing track.• Replace single-track Santa Margarita River bridge with new two-trackconcrete bridge and connect with double track siding.• Extend platform at Sorren<strong>to</strong> Valley Station.• Build 500-space parking structure at Solana Beach Station for mixedusedevelopment.UNFUNDED OR UNDERFUNDED:• Replace single-track San Diegui<strong>to</strong> River bridge with new two-trackconcrete bridge.135
<strong>2007</strong>-<strong>08</strong> – <strong>2017</strong>-<strong>18</strong> <strong>California</strong> <strong>State</strong> <strong>Rail</strong> <strong>Plan</strong>UNFUNDED OR UNDERFUNDED (continued):• Replace single-track San Luis Rey River bridge with new two-trackconcrete bridge and connect <strong>to</strong> with double track siding.• Replace single-track San Mateo Creek bridge’s north approach withnew concrete bridge approach.• Replace other single-track timber bridges with new double-trackconcrete bridges, including seven bridges in Sorren<strong>to</strong> Valley and onebridge in Cardiff.• Sorren<strong>to</strong> <strong>to</strong> Miramar second track and curve straightening..• Continue stabilization of Del Mar Bluffs.• Extend platforms at Poinsettia Station.BACKGROUNDThe North San Diego County Transit Development Board (Board) was created by<strong>State</strong> law in 1975 <strong>to</strong> plan, construct, and operate itself or through a contrac<strong>to</strong>r, apublic transit system in its area of jurisdiction. In 1976, the Board formed theNorth County Transit District (NCTD) for the purpose of providing integratedpublic transit services within the North San Diego County region.In 1987, voters approved the Proposition A “TransNet” Ordinance, whichprovided funding for future transit projects and improvements <strong>to</strong> the existingsystem. At the same time, planning began on the Coaster commuter rail servicebetween Oceanside and San Diego. In order <strong>to</strong> expand rail passenger services, in1992 the Board purchased a significant segment of the LOSSAN <strong>Rail</strong> Corridorfrom the ATSF.In 1994, the Board created a non-profit corporation called the San Diego Northern<strong>Rail</strong>way (SDNR) <strong>to</strong> maintain, enhance, and operate the SDNR facilities andCoaster Express <strong>Rail</strong> Service. Beginning in 2000, the Board contracted directlyfor Coaster services and ceased using the SDNR non-profit corporation. In 2002,SB 1703 consolidated the planning, programming, and construction functionsunder the San Diego Association of Governments. Coaster rail service began onFebruary 27, 1995 between Oceanside and San Diego.The Board owns the portion of the LOSSAN <strong>Rail</strong> Corridor from the Orange/San Diego County Line (at Mile Post 207.4) south <strong>to</strong> the city limits ofDel Mar/San Diego (at Mile Post 245.6). The Metropolitan Transit DevelopmentBoard (MTDB) owns the portion of the LOSSAN <strong>Rail</strong> Corridor from that pointsouth <strong>to</strong> the Santa Fe Depot in San Diego (at Mile Post 267.6). Per agreement, theNCTD also provides maintenance of the LOSSAN <strong>Rail</strong> Corridor in MTDB’s areaof ownership.136
Chapter IX – Commuter <strong>Rail</strong> ServicesFigure 9B137
<strong>2007</strong>-<strong>08</strong> – <strong>2017</strong>-<strong>18</strong> <strong>California</strong> <strong>State</strong> <strong>Rail</strong> <strong>Plan</strong>ORGANIZATIONAL STRUCTUREThe Board of Direc<strong>to</strong>rs of NCTD is comprised of one member of each of the citycouncils of the cities of Carlsbad, Del Mar, Encinitas, Escondido, Oceanside,Solana Beach, San Marcos, and Vista, and one member from the San DiegoCounty Board of Supervisors.ROUTE AND SERVICE DESCRIPTIONThe Coaster serves eight stations between San Diego and Oceanside and operates22 trains per day Monday through Thursday, with 26 trains on Friday (April-September) and frequent service during peak periods. Four round-trips areoperated on Saturday. During the <strong>2007</strong> San Diego Padres Baseball season, theCoaster began providing Saturday and Sunday Padres Home Game service.This added service has been very popular and NCTD will consider continuationnext season. The running time from San Diego <strong>to</strong> Oceanside is approximately 58minutes, and all Coaster trains are wheelchair accessible.The Coaster has eight stations: Oceanside Transit Center, Carlsbad Village,Carlsbad Poinsettia, Encinitas, Solana Beach, Sorren<strong>to</strong> Valley, Old Town TransitCenter and San Diego Santa Fe Depot. All stations have parking facilities exceptdown<strong>to</strong>wn San Diego’s Santa Fe Depot. Parking improvements are currentlybeing developed for the Solana Beach Station. NCTD is also pursuing atemporary parking lot expansion on NCTD-owned right-of-way at the CarlsbadVillage Station.FARE STRUCTUREThe Coaster fare structure is based on distance traveled, with four fare zones.Passengers purchase their tickets from ticket vending machines at stationplatforms before boarding the train, and they must present a valid ticket ormonthly pass <strong>to</strong> the conduc<strong>to</strong>r or ticket inspec<strong>to</strong>r upon request. Ticket typesavailable include one-way tickets, round-trip tickets, regular monthly pass,Senior/Disabled monthly pass, and youth monthly pass. Discounts ofapproximately 50 percent for seniors and the disabled, and 25 percent for youth,are offered on the monthly passes, compared <strong>to</strong> the regular monthly pass.The <strong>Rail</strong> 2 <strong>Rail</strong> program allows Coaster and Amtrak <strong>to</strong> accept certain ticketsissued by each other’s rail services. Coaster monthly pass holders travelingbetween Oceanside and San Diego can increase their train service options at noadditional cost. Amtrak ticket holders also enjoy the same privilege on Coastertrains within the limits of their ticket at no additional charge <strong>to</strong> the passenger.However, NCTD must reimburse Amtrak $1.50 per net Coaster rider carried onAmtrak, under this program. NCTD budgeted operating funds of $125,000 forthis service in its FY<strong>08</strong> Budget.138
Chapter IX – Commuter <strong>Rail</strong> ServicesCONNECTING SERVICESCoaster passengers can connect with Amtrak trains at Oceanside, Solana Beach,Old Town Station (Sundays only), and Down<strong>to</strong>wn Santa Fe Depot in San Diego.At Oceanside Transit Center, connections are available <strong>to</strong> Metrolink commuterservice <strong>to</strong> Los Angeles and <strong>to</strong> NCTD’s new SPRINTER light rail service <strong>to</strong>Escondido via Vista and San Marcos. Connections are made <strong>to</strong> San Diego Transit,San Diego Trolley, and Metropolitan Transit System (MTS), at these stations:Sorren<strong>to</strong> Valley Station, Old Town Transit Center, and San Diego’s Santa FeDepot. The link <strong>to</strong> San Diego <strong>State</strong> University is at the Old Town Transit Centerusing the San Diego Trolley’s new Green Line Mission Valley East Extension.In addition, there is a free connection from the San Diego terminal <strong>to</strong> theSan Diego International Airport through MTS. The NCTD Breeze buses provideseveral North San Diego County region connections. Also, the Encinitas CoasterConnection and the Sorren<strong>to</strong> Valley Connection provide peak hour shuttle service<strong>to</strong> the Coaster.PERFORMANCEwould contribute <strong>to</strong> continuedexcellent performance.RidershipFigure 9C shows the annual Coasterridership data from the beginning ofservice in 1995 through <strong>2007</strong>, by FiscalYear. As traffic on I-5 and I-805continues <strong>to</strong> increase, and fuel pricesrise, more commuters have turned <strong>to</strong>the Coaster, whose ridership hasincreased <strong>to</strong> 1.56 million in FY <strong>2007</strong>.On-Time PerformanceThe Coaster’s on-time performancehas improved in FY07 after severalyears of declining performance as theLOSSAN corridor becomesincreasingly more congested (alsocontained on Figure 9C). As of theend of FY07, on-time performancehad improved <strong>to</strong> 94.0%. NCTD andits new Contrac<strong>to</strong>r, TransitAmerica,have worked very closely with allcorridor users and the MetrolinkOperations Center <strong>to</strong> achieve theimprovement. The double-track andbridge projects discussed belowFigure 9CCoaster RidershipFiscal Years 1995-2006Year Ridership OTP1995 179,3781996 736,7761997 909,9761998 1,031,2681999 1,240,225 92.5%2000 1,<strong>18</strong>7,749 93.8%2001 1,206,839 94.6%2002 1,281,144 93.8%2003 1,348,453 93.4%2004 1,429,020 91.2%2005 1,432,468 85.3%2006 1,554,450 87.6%<strong>2007</strong> 1,560,729 94.0%139
<strong>2007</strong>-<strong>08</strong> – <strong>2017</strong>-<strong>18</strong> <strong>California</strong> <strong>State</strong> <strong>Rail</strong> <strong>Plan</strong>REGIONAL SERVICE INITIATIVESThe San Diego Association of Governments (SANDAG) Draft <strong>2007</strong> RegionalTransportation <strong>Plan</strong> proposes significant improvements <strong>to</strong> service frequencies by2020 including service every 20 minutes at peak times and every 60 minutesoff-peak. Enabling these improvements <strong>to</strong> occur will require double-tracking alongthe entire rail corridor. In the near term, the only way <strong>to</strong> significantly increaseservice capacity is by operating longer consists. Intermediate term objectivesproposed are designed <strong>to</strong> increase service as double tracking is incrementallyadded over the next twenty years. The adopted <strong>2007</strong>-2011 SANDAG RegionalShort-Range Transit <strong>Plan</strong> proposed as a strategy <strong>to</strong> provide additional weekendservice including Sundays.CAPITAL IMPROVEMENT PROGRAMNCTD’s capital needs <strong>to</strong> support current and future service levels on the Coaster,as well as Amtrak, BNSF, and Metrolink, are at a critical crossroads. NCTD isworking <strong>to</strong> improve its infrastructure, including rail equipment purchases andmajor system overhauls, bridge and track improvements, facility and maintenanceimprovements, radio communication upgrades, technology enhancements, andemergency response and system safety upgrades. However, there is currently nofunding available for many of the most critical right-of-way infrastructure needs.These crucial projects are needed <strong>to</strong> maintain and increase safety and ridership,and improve reliability of the service. If funding is not found <strong>to</strong> startimplementing these infrastructure replacement projects in the next few years,NCTD will have no choice but <strong>to</strong> start reducing corridor speeds, and ultimately,service levels.Funded ProjectsOceanside Passing Track – This Department project entails two components.The first is construction of a 1.2 mile long passing track extension that will crossLoma Alta Creek on a new concrete bridge. The second is <strong>to</strong> replace the existingtimber trestle bridge over Loma Alta Creek with a concrete bridge.Santa Margarita Bridge Replacement and Second Main Track – This projectwill consist of three components: (1) replacement of the existing single-trackSanta Margarita River <strong>Rail</strong>road Bridge with a new two-track bridge, (2)construction of a 0.8 mile new second main track, and (3) an upgrade andrealignment of the existing 1.7 mile Fallbrook Junction Passing Track. Inaddition, the westerly 0.2-mile of the existing Stuart Mesa Passing Track will berealigned <strong>to</strong> accommodate new turnouts, signal modifications, retainedembankments, and drainage facilities.140
Chapter IX – Commuter <strong>Rail</strong> ServicesCP Carl <strong>to</strong> CP Farr Double-Track – This project would add two miles of secondtrack and a new concrete bridge <strong>to</strong> the current alignment between down<strong>to</strong>wnCarlsbad and Cannon Road in Carlsbad, connecting <strong>to</strong> the double-track at Cannon.The resulting double track segment would be a <strong>to</strong>tal of five miles in length.The bridge would be virtually identical <strong>to</strong> the new concrete bridge at MP 230.6completed by NCTD in 2006. Amtrak has provided much of the funding for thisproject.Solana Beach Station Parking – A 500-space parking structure will beconstructed as part of a mixed-use development located at the Station.Sorren<strong>to</strong> Valley Station Platform Extension –This project will extend the twoplatforms at Sorren<strong>to</strong> Valley Station <strong>to</strong> up <strong>to</strong> 1,000 feet in length, in order <strong>to</strong>accommodate longer trainsets. The current platforms can only accommodate fivecartrains, and ridership growth is such that six-car trains will soon be needed.Unfunded and Under-funded ProjectsSan Diegui<strong>to</strong> River Bridge Replacement and Second Main Track –This project would replace a single-track bridge with a double-track concretebridge, and add 1.1 miles of second main track <strong>to</strong> connect the existing passingtracks at Solana Beach and Del Mar. The resultant double-track will be 2.8 milesin length. The bridge has been the target of past marine borer attacks, and is underattack again at this time.San Luis Rey River Bridge and Second Track Project – This project wouldreplace the 700-foot long, 1920’s-era, troubled, single-track steel bridge at theSan Luis Rey River with a new double track concrete bridge, and connect withdouble-track segments <strong>to</strong> the north and south <strong>to</strong> create a continuous stretch ofdouble track from CP Westbrook (MP 223.6) through Oceanside Transit Centerand south <strong>to</strong> CP Escondido Junction (MP 227.2), a <strong>to</strong>tal length of 3.6 miles.San Mateo Creek Bridge North Approach – The current 558-foot long timbertrestle north approach <strong>to</strong> this bridge has been burned repeatedly during the lastthree decades and is in very poor condition. NCTD has expended approximately$500,000 on interim repairs in the past two years but this bridge portion must bereplaced. NCTD has undertaken preliminary design and environmental workusing its existing funding sources but no construction funding has been identified<strong>to</strong> date. Speed restrictions are already in place and more severe speed restrictionswill become necessary if this bridge is not replaced soon. This bridge is used byAmtrak, BNSF, and Metrolink trains, but not by Coaster trains.Replacement of other Single-Track Timber Bridges – There are seven agingtimber trestles in Sorren<strong>to</strong> Valley, in an alignment distance of only 3.8 miles.These single-track bridges date back <strong>to</strong> as early as 1911. Replacement anddouble-tracking of this segment of the alignment will require constructing the newbridges in groups <strong>to</strong> minimize environmental impact. In addition, the timber141
<strong>2007</strong>-<strong>08</strong> – <strong>2017</strong>-<strong>18</strong> <strong>California</strong> <strong>State</strong> <strong>Rail</strong> <strong>Plan</strong>trestle in Cardiff at MP 240.4 is under marine borer attack and needs <strong>to</strong> bereplaced. NCTD has undertaken preliminary design and environmental work forthese bridges using its existing funding sources but no construction funding hasbeen identified <strong>to</strong> date.Sorren<strong>to</strong> <strong>to</strong> Miramar Double Track (Phase 1 and Phase 2) – These projectswould add a second track between Sorren<strong>to</strong> Valley and the <strong>to</strong>p of Miramar Hill,a <strong>to</strong>tal of 3.1 miles. The resulting double track segment would connect withexisting double track segments both north of and south of this area, resulting in a<strong>to</strong>tal double track length of 9.1 miles. In addition, the project includes curvestraightening <strong>to</strong> improve speeds.This current stretch of single track is the slowest, steepest, and highest curveterri<strong>to</strong>ry of any segment on the LOSSAN corridor, with speeds currently restricted<strong>to</strong> 25 miles per hour. It has also been the site of two serious freight trainderailments which shut down the entire line and caused severe disruption <strong>to</strong> allcorridor services. Design is complete <strong>to</strong> 60% and funding is available for finaldesign, but no construction money is currently available.Del Mar Bluffs Stabilization-Phase 3-Additional Bluff Stabilization – Erodedtrack bed support will be replaced, the bluff face will be protected, and the bluff<strong>to</strong>e will be reinforced in high-risk s<strong>to</strong>rm erosion areas, as identified in thegeotechnical study.Poinsettia Station Platform Extension – This project would extend both stationplatforms <strong>to</strong> accommodate train consists of six or more cars.METROLINK COMMUTER RAIL SERVICE(LOS ANGELES, ORANGE, RIVERSIDE, SAN BERNARDINO, ANDVENTURA COUNTIES)PRINCIPAL <strong>2007</strong>-<strong>08</strong> <strong>to</strong> <strong>2017</strong>-<strong>18</strong> ROUTE OBJECTIVES• Improve cus<strong>to</strong>mer service and accessibility.• Improve integration with other transit services.• Purchase 107 new rail cars.• Design and construct Sealed Corridor safety improvements on SCRRAownedlines.• Complete system-wide rail line rehabilitation/renovation projects.• Construct Eastern Area maintenance facility.• Perform various projects <strong>to</strong> improve system performance.• Purchase and rebuild 15 used locomotives.• Complete Lincoln Avenue double-track.142
Chapter IX – Commuter <strong>Rail</strong> ServicesPRINCIPAL <strong>2007</strong>-<strong>08</strong> <strong>to</strong> <strong>2017</strong>-<strong>18</strong> OBJECTIVES (continued)• Construct additional platform and track at LAUS (mail dock).• Construct new rolling s<strong>to</strong>ck s<strong>to</strong>rage facility at Keller Street inLos Angeles.• Implement Perris Valley extension, Redlands extension, Santa PaulaBranch Line, and Fuller<strong>to</strong>n-Laguna Niguel/Mission Viejo serviceenhancements.BACKGROUNDIn June 1990, the <strong>California</strong> Legislature enacted SB 1402 which required thetransportation commission of the counties of Los Angeles, Orange, Riverside, andSan Bernardino <strong>to</strong> develop a plan for regional transit services within the multicountyregion.In August 1991, the Southern <strong>California</strong> Regional <strong>Rail</strong> Authority (SCRRA),a joint powers agency, was created <strong>to</strong> plan, design, construct, and administer theoperation of a regional passenger rail system serving the counties of Los Angeles,Orange, Riverside, San Bernardino, and Ventura. The SCRRA named the regionalcommuter rail system “Metrolink.” Today, Metrolink serves approximately43,000 daily trips in 238 communities throughout Southern <strong>California</strong>.The first three lines, San Bernardino, Santa Clarita (now Antelope Valley), andVentura County, began service <strong>to</strong> Los Angeles on Oc<strong>to</strong>ber 26, 1992.The Riverside Line was added in June 1993, and the Orange Line was added inApril 1994. The sixth line, Inland Empire-Orange County, was added inOc<strong>to</strong>ber 1995. In May of 2002, the 91 Line between Los Angeles and Riversidewas opened for commuters traveling via Fuller<strong>to</strong>n. The Orange County <strong>to</strong>Los Angeles Line extends as far south as Oceanside in San Diego County.The SCRRA contracts with Connex <strong>Rail</strong>road LLC <strong>to</strong> operate the commuter railservice, Bombardier for rail equipment maintenance, Los Angeles CountySheriff’s Department for security, Herzog Contracting Corporation for track andstructure maintenance, and Mass Electric Construction Company for signal andcommunications maintenance.ORGANIZATIONAL STRUCTUREThe SCRRA is a joint powers agency consisting of five member agencies andthree ex-officio member agencies; the board consists of 11 members.Member agencies include Los Angeles County Metropolitan Commission, OrangeCounty Transportation Authority, Riverside County Transportation Commission,San Bernardino Associated Governments, and Ventura County TransportationCommission. Ex-officio member agencies include Southern <strong>California</strong>143
<strong>2007</strong>-<strong>08</strong> – <strong>2017</strong>-<strong>18</strong> <strong>California</strong> <strong>State</strong> <strong>Rail</strong> <strong>Plan</strong>Association of Governments, San Diego Association of Governments, and the<strong>State</strong> of <strong>California</strong>.ROUTE AND SERVICE DESCRIPTIONMetrolink presently operates 145 daily trains weekdays, serving 54 stations on thefollowing seven lines:Ventura County Line – Montalvo, Oxnard, Camarillo, Moorpark, Simi Valley,Chatsworth, Northridge, Van Nuys, Bob Hope Burbank Airport, Down<strong>to</strong>wnBurbank, Glendale, Los Angeles.Antelope Valley Line – Lancaster, Palmdale, Vincent Grade/Ac<strong>to</strong>n,Via Princessa, Santa Clarita, Newhall, Sylmar/San Fernando, Sun Valley,Down<strong>to</strong>wn Burbank, Glendale, Los Angeles.San Bernardino Line – San Bernardino, Rial<strong>to</strong>, Fontana, Rancho Cucamonga,Upland, Montclair, Claremont, Pomona (North), Covina, Baldwin Park, El Monte,Cal <strong>State</strong> L.A., Los Angeles.Riverside Line – Riverside, Pedley, East Ontario, Down<strong>to</strong>wn Pomona, Industry,Montebello/Commerce, Los Angeles.Orange County Line – Oceanside, San Clemente, San Juan Capistrano, LagunaNiguel/Mission Viejo, Irvine, Tustin, Santa Ana, Orange, Anaheim, Fuller<strong>to</strong>n,Norwalk/Santa Fe Springs, Commerce, Los Angeles.Inland Empire-Orange County Line – San Bernardino, Riverside Down<strong>to</strong>wn,Riverside La Sierra, West Corona, Anaheim Canyon, Orange, Santa Ana, Tustin,Irvine, Laguna Niguel/Mission Viejo, San Juan Capistrano, San Clemente,Oceanside.91 Line – Riverside Down<strong>to</strong>wn, Riverside La Sierra, West Corona, Fuller<strong>to</strong>n,Norwalk/Santa Fe Springs, Los Angeles.The 55th station opened for service on the Orange County and 91 Lines inSeptember <strong>2007</strong>.Saturday and Sunday service is also operated on the San Bernardino, OrangeCounty and Inland Empire <strong>to</strong> Orange County Lines, and Saturday service is run onthe Antelope Valley Line. In September <strong>2007</strong>, Sunday service will also beprovided on the Antelope Valley Line. Most weekday trains operate during peakcommuting hours before 8:30 a.m. and after 3:30 p.m. Trains run on modifiedschedules on three holidays but are not run on four major holidays. Metrolink has512 route miles in its regional rail system. All Metrolink stations have ticketvending machines. Stations on the Metrolink routes are owned by the cities orregional transportation commissions, and 22,464 parking spaces are provided,most of which are free.144
Chapter IX – Commuter <strong>Rail</strong> ServicesAs of September <strong>2007</strong>, Metrolink expects <strong>to</strong> continue weekday service at145 trains each weekday, and expand weekend service <strong>to</strong> 78 weekend trains onfour of the seven routes. Average weekday ridership is projected <strong>to</strong> average43,000 daily one-way trips for the FY <strong>2007</strong>-<strong>08</strong>.In FY <strong>2007</strong>-<strong>08</strong>, <strong>to</strong>tal rolling s<strong>to</strong>ck available will be 39 locomotives (including oneleased from Sound Transit) and 155 commuter rail cars including 39 cab cars(four leased from Sound Transit and two from Altamont Commuter Express) and116 passenger cars (eight leased from Sound Transit and two from AltamontCommuter Express). In addition <strong>to</strong> operating commuter rail service, SCRRAdispatches and maintains in excess of 60 percent of the terri<strong>to</strong>ry over which i<strong>to</strong>perates. On a daily basis, SCRRA currently dispatches 145 Metrolink trains, up<strong>to</strong> 36 Amtrak intercity trains between Moorpark and San Diego, up <strong>to</strong> 28 NCTDoperatedCoaster trains, and between 70 and 80 freight trains. SCRRA is alsoresponsible for the maintenance of over 337 track-miles of ROW owned bySCRRA member agencies.FARE STRUCTUREMetrolink has a barrier free system (no gates or inspection points before boardingtrains) with ticket vending machines at all stations. Tickets must be purchased inadvance from au<strong>to</strong>mated ticket vending machines located at all station platforms.The machines accept cash, credit card, or debit cards and tickets can also bepurchased at Union Station, through employee transportation coordina<strong>to</strong>rs orthrough the mail. Through June 30, 2005, the system had a multi-zone farestructure and ticket prices were based on the number of zones traveled. BeginningJuly 2005, SCRRA began a ten-year transition <strong>to</strong> distance-based fares. All ticketsare designed <strong>to</strong> include free transfers <strong>to</strong> connecting public transportation.The system has a proof-of-payment system where riders must show proof of theirticket when asked <strong>to</strong> do so during random spot checks by fare enforcementpersonnel. Ticket types available include one-way tickets, round-trip tickets,ten-ride tickets, and monthly passes. Discounts of 50 percent are offered <strong>to</strong>seniors and the disabled. Youth may travel at half the fare for all types of ticketson weekends only.Metrolink participates in the <strong>Rail</strong> 2 <strong>Rail</strong> program, which began in 2002, andallows Metrolink and Amtrak <strong>to</strong> accept certain tickets, issued from each others railservices. Metrolink monthly pass holders for the Orange County and VenturaCounty Lines can use any Amtrak train for any part of their travel within the limitsof their pass at no additional cost. Amtrak ticket holders also enjoy the sameprivilege on Metrolink trains within the limits of their ticket at no additionalcharge.145
<strong>2007</strong>-<strong>08</strong> – <strong>2017</strong>-<strong>18</strong> <strong>California</strong> <strong>State</strong> <strong>Rail</strong> <strong>Plan</strong>CONNECTING SERVICESEach county has a transit plan <strong>to</strong> ensure integration of Metrolink service with othertransit systems and transportation modes. The Metrolink fare is designed <strong>to</strong>provide a free transfer either from feeder bus or <strong>to</strong> local transit at the destinationstation. Metrolink passengers can connect with Amtrak trains at Anaheim,Burbank-Bob Hope Airport, Camarillo, Chatsworth, Fuller<strong>to</strong>n, Glendale, Irvine,Moorpark, Oceanside, Oxnard, San Juan Capistrano, Santa Ana, Simi Valley, andVan Nuys. Metrolink passengers can connect <strong>to</strong> the Metro Red Line subway andthe Metro Gold Line at LAUS, <strong>to</strong> the Metro Green Line at Norwalk, and <strong>to</strong> theMetro Blue Line at the 7th Street/Metro Station at no additional charge.Shuttle service is provided at the Down<strong>to</strong>wn Burbank and Bob Hope BurbankAirport stations <strong>to</strong> the Burbank-Bob Hope Airport. LAUS also provides railconnection <strong>to</strong> Amtrak long distance trains such as the Sunset Limited, SouthwestChief, Coast Starlight, and the San Joaquin Route Amtrak trains via a thruwaybus. Union Station also provides connections with various local and city bus andshuttle services, including service <strong>to</strong> Los Angeles International Airport.<strong>Plan</strong>ned light rail additions that will provide direct connections with Metrolinktrains include the Metro East Side Line, the Metro Exposition Line, and the MetroGold Line Foothill Extension.PERFORMANCEFigure 9DFigure 9D shows Metrolink’sridership data on an annual basisfrom its start in 1992 through 2006.Ridership has grown steadily <strong>to</strong>10.8 million in 2006 as routes wereadded and service expanded.Metrolink RidershipCalendar Years 1992-2006Year Ridership Year Ridership1992 165,164 2000 8,062,5731993 1,889,980 2001 8,522,5551994 4,132,625 2002 8,979,1071995 4,645,561 2003 9,099,9851996 5,688,814 2004 9,786,5311997 6,314,368 2005 10,245,6091998 6,745,282 2006 10,797,5061999 7,229,677CAPITAL IMPROVEMENT PROGRAMPrincipal Metrolink capital improvements, with estimated costs, which are plannedfor the next ten years, include:Rolling S<strong>to</strong>ck Procurement - $217.4 millionThis project would procure up <strong>to</strong> 107 additional rail cars, with options for up <strong>to</strong> 30more. The specifications for the cab cars will include crash energy management <strong>to</strong>minimize the damage from a collision in passenger-occupied spaces.146
Chapter IX – Commuter <strong>Rail</strong> ServicesSealed Corridor Program - $9.9 millionThe Sealed Corridor Program will provide a comprehensive strategy <strong>to</strong> enhancethe safety of trains, passengers, mo<strong>to</strong>rists, pedestrians, and neighboring land useswithin and along Metrolink’s railroad corridors, using appropriate safety measures<strong>to</strong> systematically reduce the opportunity for accidents at grade crossings orelsewhere within the corridor. The first phase of this project will study andimplement safety improvements along the Antelope Valley and Ventura CountyLines including improvements such as quad gates, median islands, longer gatearms, grade crossing closure, and gates <strong>to</strong> limit access <strong>to</strong> the rail ROW.Systemwide <strong>Rail</strong> Line Rehabilitation/Renovation Projects - $60.7 millionThese projects include track, signal and bridgework, tunnels, stations, drainage,engine and rolling s<strong>to</strong>ck overhaul and rehabilitation, and passenger informationthroughout the system.Eastern Maintenance Facility - $34.9 millionThis project consists of the completion of design and engineering, as well as theconstruction of a facility in Col<strong>to</strong>n <strong>to</strong> provide s<strong>to</strong>rage and maintenance on SCRRAequipment.Purchase and Rebuild Used Locomotives - $47.6 millionThis project provides for the purchase of 15 remanufactured passengerlocomotives for expansion of the Metrolink system.Lincoln Avenue Double-track - $26.5 millionThis is a multi-year project <strong>to</strong> install a second main line on the last segment ofsingle main track between Fuller<strong>to</strong>n and Laguna Niguel, a 1.8-mile segmentbetween Santa Ana and Orange.Keller Street (Los Angeles) Rolling S<strong>to</strong>ck S<strong>to</strong>rage Facility - $5 millionThis project includes design and construction of the Keller Street S<strong>to</strong>rage Facilityin Los Angeles needed for Metrolink rolling s<strong>to</strong>ck.Eliminate Mail Dock at LAUS - $3 millionThis project will res<strong>to</strong>re an unused track for passenger services by demolishing amail dock, reconfiguring the skylight, and constructing a new passenger platformand connecting ramps.PROPOSED SERVICE ENHANCEMENTSPerris Valley ExtensionThe Riverside County Transportation Commission (RCTC) plans <strong>to</strong> requestFederal Transit Administration (FTA) New Starts funds <strong>to</strong> extend the Metrolink91 Line <strong>to</strong> South Perris in Riverside County. The Metrolink 91 Line currentlyoperates between down<strong>to</strong>wn Los Angeles and down<strong>to</strong>wn Riverside via Fuller<strong>to</strong>nand Corona. The extension would add approximately 21.3 miles <strong>to</strong> the route of147
<strong>2007</strong>-<strong>08</strong> – <strong>2017</strong>-<strong>18</strong> <strong>California</strong> <strong>State</strong> <strong>Rail</strong> <strong>Plan</strong>the 91 Line and serve the University of <strong>California</strong> at Riverside, Moreno Valley,and the Perris area. The entire length of the line was purchased by RCTC in 1993.<strong>Rail</strong> service in this corridor is expected <strong>to</strong> begin in 20<strong>08</strong> and would operate threetrains from Perris <strong>to</strong> Riverside with continuing service <strong>to</strong> Los Angeles during themorning period. Two mid-day, off-peak trains would operate daily, one in eachdirection. In the afternoon peak period, three trains would operate fromLos Angeles <strong>to</strong> Perris. Travel time would be 40 minutes. Headways would be50-60 minutes during the peak periods. Rolling s<strong>to</strong>ck would be additional bi-levelcommuter coaches acquired for the Metrolink fleet.Daily ridership is estimated at 4,151 by 2010 and up <strong>to</strong> 7,472 by 2025. Capitalcosts are estimated at $<strong>18</strong>6 million and the annual operating and maintenance costis estimated <strong>to</strong> be $6.1 million in 2010 and $8.4 million in 2025.Redlands ExtensionSan Bernardino Associated Governments (SANBAG) purchased the RedlandsSubdivision from the Santa Fe <strong>Rail</strong>way (now BNSF) in 1993. The Redlands railservice is currently being planned by SANBAG and service is anticipated <strong>to</strong> beginby 2015. The proposed Redlands service assumes Metrolink service <strong>to</strong> Rial<strong>to</strong>/E Street and Fixed <strong>Rail</strong> Transit <strong>to</strong> Redlands.Fixed rail vehicles would operate along the railroad ROW from University Streetin Redlands <strong>to</strong> a new station at E Street in down<strong>to</strong>wn San Bernardino. The vehicletype would be compliant passenger vehicle, a Diesel Multiple Unit (DMU),capable of operating with freight rail services and Metrolink type trains. Most ofthe existing track would be constructed <strong>to</strong> be double-tracked <strong>to</strong> allow for15-minute headways all day long. There may be sections that could be singletrackin order <strong>to</strong> reduce initial capital costs but still maintain service quality.Daily ridership is projected at 11,000. The estimated capital cost is $144 million.The annual operating and maintenance cost is estimated <strong>to</strong> be about $71 million.Santa Paula Branch LineVentura County Transportation Commission (VCTC) acquired the Santa PaulaBranch Line from the Southern Pacific <strong>Rail</strong>road in 1995. The 32-mile long railline includes approximately 29 miles of existing track from Montalvo <strong>to</strong> Piru and3 miles of abandoned (removed) track between Piru and Rancho Camulos. At thewestern end of the line, there is a Metrolink layover facility and station atMontalvo in Ventura County, within the Oxnard-Thousand Oaks metro area.At the eastern end of the line, in the City of Santa Clarita is the Saugus Metrolinkrail station, which serves the Santa Clarita Line.The City of Santa Clarita and the Newhall Land & Farming Company haveexpressed interest in reinstituting branch line service <strong>to</strong> connect <strong>to</strong> the Saugusstation and Metrolink service.148
Chapter IX – Commuter <strong>Rail</strong> ServicesCurrently, excursion services are operated between Fillmore and Santa Paula.The UP provides limited freight rail service on this corridor. VCTC recentlyinitiated a study <strong>to</strong> investigate rail options on the Santa Paula Branch Line. Thereare also plans for a recreational trail in the ROW.Fuller<strong>to</strong>n-Laguna Niguel/Mission Viejo Service EnhancementThe Orange County Transportation Authority (OCTA) decided at its Oc<strong>to</strong>ber 14,2005 meeting <strong>to</strong> pursue increased Metrolink service frequencies between Fuller<strong>to</strong>nand Laguna Niguel/Mission Viejo. The expanded service would result in theoperation of daily trains every 30 minutes between 5 a.m. and midnight. CurrentlyMetrolink provides mostly weekday peak-period service.Service ImprovementsAs of September <strong>2007</strong>, Metrolink expects <strong>to</strong> continue weekday service at 145trains each weekday, and expand weekend service <strong>to</strong> 78 weekend trains on four ofthe seven routes.The proposed weekday service levels in the SCRRA Strategic Assessment for thenext 10 years are provided in Figure 9E.Figure 9EMetrolinkWeekday Service Levels for the Strategic AssessmentLines Current 2010 2015Ventura County 20 <strong>18</strong> 28Antelope Valley 24 24 32San Bernardino 34 34 48Riverside 12 12 2291 Line: LA-Riverside 9 0 491 Line: LA-Perris 10 16LAUS-Oceanside 10 10 10LAUS-Laguna Niguel/San Juan Capistrano/Irvine 9 16 16Fuller<strong>to</strong>n-Laguna Niguel 20 20IEOC 16 20 24Burbank Turn 11 12 12Total 145 176 232149
<strong>2007</strong>-<strong>08</strong> – <strong>2017</strong>-<strong>18</strong> <strong>California</strong> <strong>State</strong> <strong>Rail</strong> <strong>Plan</strong>Figure 9F150
Chapter IX – Commuter <strong>Rail</strong> ServicesCALTRAIN COMMUTER RAIL SERVICE(SAN FRANCISCO-SAN JOSE-GILROY)PRINCIPAL <strong>2007</strong>-<strong>08</strong> <strong>to</strong> <strong>2017</strong>-<strong>18</strong> OBJECTIVES• Evaluate the service <strong>to</strong> meet growing demand.• Evaluate an increase in parking at stations impacted by initiation ofBaby Bullet service.• Increase employer bus shuttles as demand grows.• Implement Translink regional ticketing system.• Participate in planning efforts for extensions <strong>to</strong> down<strong>to</strong>wnSan Francisco, across the Dumbar<strong>to</strong>n Bridge, and <strong>to</strong> Salinas.• Complete and commission Centralized Equipment Maintenance andOperations Facility.• Improve operational capacity at targeted stations and other routelocations, including outside boarding platforms and additionalcrossovers.• Complete cus<strong>to</strong>mer service improvements, including improved stationaccess and amenities at selected stations.• Improve ROW by designing grade separations in San Mateo County,and rehabilitate bridges, culverts, tracks, and tunnels.• Prepare design plans, specifications, and estimates <strong>to</strong> electrify the routebetween San Francisco and Gilroy.• Implement Dumbar<strong>to</strong>n rail service extension.• Procure eight bi-level passenger cars.• Define long-term planning and capital improvement efforts related <strong>to</strong>Caltrain 2025.BACKGROUNDThe Caltrain commuter rail service (previously known as the Peninsula CommuteService) operates on one of the oldest railroad lines in <strong>California</strong>. The SP operatedpassenger rail service on the peninsula between San Francisco and San Jose fromthe <strong>18</strong>60s until 1980 when SP decided <strong>to</strong> phase the service out. The Departmentand the counties of San Francisco, San Mateo, and Santa Clara reached a serviceagreement <strong>to</strong> preserve the passenger rail service.Between 1980 and July 1991, the Department’s District 4 administereda purchase-of-service agreement with SP <strong>to</strong> continue operating and partiallyfunding the service in cooperation with local agencies. The Department’s151
<strong>2007</strong>-<strong>08</strong> – <strong>2017</strong>-<strong>18</strong> <strong>California</strong> <strong>State</strong> <strong>Rail</strong> <strong>Plan</strong>responsibilities included planning, marketing, engineering and design, fare andschedule setting, performance moni<strong>to</strong>ring, and cus<strong>to</strong>mer service.In 1987, the commuter rail service was renamed “Caltrain” and the City andCounty of San Francisco, San Mateo County Transit District (SamTrans), and theSanta Clara County Transit Agency (now called VTA) formed the PeninsulaCorridor Joint Powers Board (JPB) and transferred administrative responsibility ofthe Peninsula Commute Service from the <strong>State</strong> <strong>to</strong> the local level.In July 1992, the JPB <strong>to</strong>ok over the management of Caltrain from the <strong>State</strong> andcontracted with Amtrak <strong>to</strong> operate the Caltrain commuter rail service. At the sametime, SamTrans officially assumed the operation and administration of the JPB.Service in 1980 consisted of 22 weekday round-trip trains from San Francisco <strong>to</strong>San Jose. Under JPB management, service has increased <strong>to</strong> 96 weekday trips.An extension <strong>to</strong> Gilroy with two weekday round-trips was added in 1992, withservice later expanded <strong>to</strong> four round-trips. Baby Bullet express service was addedin 2004.ORGANIZATIONAL STRUCTUREThe JPB currently includes representatives from San Francisco, San Mateo, andSanta Clara counties. The JPB consists of nine members and each county hasthree members on the board. The San Francisco members represent the mayor’soffice, the San Francisco County Board of Supervisors and the San FranciscoMunicipal Transportation Agency. The San Mateo members represent SamTransBoard of Direc<strong>to</strong>rs and the Santa Clara members represent the VTA, and the citiesof San Jose and Santa Clara. Staff from the San Mateo County Transit Districtprovides administrative support <strong>to</strong> the JPB.The JPB contracts with Amtrak <strong>to</strong> operate service on the corridor betweenSan Francisco and Gilroy. As part of this agreement, Amtrak is responsible forday-<strong>to</strong>-day operation and maintenance of the trains. The Caltrain commuterservice is awarded on a competitive basis. SamTrans continues <strong>to</strong> operate andadminister the service for the JPB.ROUTE AND SERVICE DESCRIPTIONCaltrain operates seven days a week on 77 miles of track owned by the JPB fromSan Francisco and San Jose and by UP from San Jose <strong>to</strong> Gilroy, and serves19 cities with 32 stations between San Francisco, San Jose, and Gilroy inSan Francisco, San Mateo, and Santa Clara counties. The system has a mixture oflocal, limited, and express trains and serves work centers in San Francisco, thePeninsula, and Silicon Valley including developing residential areas in southernSanta Clara County. Caltrain operates 96 trains on weekdays betweenSan Francisco and San Jose. Of the 96 trains, 22 are Express trains (known as theBaby Bullet) that serve 12 stations. Forty-eight provide limited service <strong>to</strong> morestations than the express service, and 26 operate as local service. Scheduled152
Chapter IX – Commuter <strong>Rail</strong> Servicesweekday trains run on 30-minute headways at major stations and one-hourheadways at minor stations. Also, on weekdays, six trains are extended <strong>to</strong> andfrom Gilroy.The system provides extensive weekend service, which consists of 32 trains onSaturday, and 28 on Sundays. The weekend trains provide local service betweenSan Francisco and San Jose Diridon stations on one-hour headways.Buses provide a connection between Diridon and Tamien stations (see Figure 9G).FARE STRUCTURECaltrain uses a six-zone fare structure based on distance traveled. Tickets,including one-way tickets, one-day passes, ten-ride tickets, and monthly passes,must be purchased in advance at staffed stations, from au<strong>to</strong>mated ticket vendingmachines located at station platforms, by mail, at selected employment sitesthroughout the Bay Area, or over the Internet. Seniors, the disabled, and youthmay travel at half the fare for all types of tickets. Riders must show proof of theirticket when asked <strong>to</strong> do so during random spot checks by fare enforcementpersonnel.Caltrain monthly pass holders receive a local fare credit on SamTrans buses andon VTA buses and light rail vehicles. For SamTrans patrons, the pass must be twozones or greater <strong>to</strong> receive the credit. For VTA passengers, the monthly pass mustbe two zones or greater for adult and senior/disabled riders, three zones or greaterfor youth riders. A two-zone Caltrain monthly pass also is valid for a free transfer<strong>to</strong> the Dumbar<strong>to</strong>n Express bus. Caltrain cus<strong>to</strong>mers connecting with San FranciscoMuni may purchase a discounted Muni Pass along with their Caltrain monthlypass <strong>to</strong> make the connection.Caltrain is currently participating in a program called TransLink, a universal faresmart card (a form of electronic cash card) with a microchip that s<strong>to</strong>res fareinformation. Riders can use the smart card <strong>to</strong> pay for fares on any public transitservice in the Bay Area. When fully operational, it is expected that all Bay Areaopera<strong>to</strong>rs will use TransLink, and is expected <strong>to</strong> be implemented on Caltrainbeginning in December <strong>2007</strong>.CONNECTING SERVICESCaltrain has a direct connection with other major opera<strong>to</strong>rs on its route. Many ofCaltrain’s stations are multimodal and facilitate transfers between other transi<strong>to</strong>pera<strong>to</strong>rs, including Muni, BART, SamTrans, VTA light rail and buses,AC Transit, the Dumbar<strong>to</strong>n Express bus, and ACE that provides commuter servicefrom S<strong>to</strong>ck<strong>to</strong>n <strong>to</strong> San Jose. ACE shares a terminal with Caltrain at San JoseDiridon station.153
<strong>2007</strong>-<strong>08</strong> – <strong>2017</strong>-<strong>18</strong> <strong>California</strong> <strong>State</strong> <strong>Rail</strong> <strong>Plan</strong>Caltrain connects directly with the intercity Capi<strong>to</strong>l Corridor and Amtrak’s longdistanceCoast Starlight, at the San Jose Diridon Station. Amtrak San Joaquin andCapi<strong>to</strong>l Corridor route feeder bus s<strong>to</strong>ps are located at the Caltrain station inSan Francisco.Local transit services link many Caltrain stations <strong>to</strong> local city destinations andemployment centers where they can serve patrons more directly than the fixedroute rail service. For example, the San Jose Diridon station serves eight VTA buslines and Highway 17 Express bus service <strong>to</strong> Santa Cruz.In addition Caltrain operates 32 shuttle routes connecting stations <strong>to</strong> majoremployment sites throughout the San Francisco peninsula. In <strong>2007</strong>, the Caltrainshuttle service carried approximately 5,000 riders per weekday. Caltrain stationsalso are served by locally operated paratransit services.PERFORMANCEFigure 9G shows the annual ridershipdata from 1978 through 2005.Ridership was 10.5 million in 2001but declined in 2002 and 2003 due <strong>to</strong>employment reductions in the SiliconValley as well as the temporarysuspension of weekend service <strong>to</strong>accommodate construction ofadditional track capacity for the BabyBullet services. Caltrain ridershipwas 8.1 million in 2003. But in <strong>2007</strong>,after the addition of the Baby Bulletservice, the return of weekendservice, and the increase in expressservice, ridership was 10.9 million.Figure 9GCaltrain RidershipCalendar Years 1978-2006Year Ridership Year Ridership1978 4,341,011 1993 6,889,9411979 5,699,406 1994 7,021,<strong>18</strong>21980 6,122,890 1995 7,143,0911981 5,895,129 1996 7,765,1151982 5,195,819 1997 8,367,6831983 5,009,130 1998 8,643,1581984 5,232,527 1999 8,990,8641985 5,384,013 2000 10,267,0001986 5,416,303 2001 10,497,6401987 5,540,630 2002 8,978,6751988 5,600,582 2003 8,107,3241989 5,790,712 2004 8,768,1571990 6,970,696 2005 9,867,4981991 7,111,365 2006 10,510,3441992 6,833,290154
Chapter IX – Commuter <strong>Rail</strong> ServicesPLANNED IMPROVEMENTSBaby Bullet has revolutionized service on the peninsula by taking advantage ofunder-utilized resources. Caltrain went from 78 weekday trains <strong>to</strong> 96 within a13-month period. The increased level of service has stressed the signaling,terminal and rolling s<strong>to</strong>ck capacity. Staff sees little room for further improvementuntil the system is electrified. Refer <strong>to</strong> the Capital Improvement Program sectionbelow.Baby Bullet Service – The JPB will continue <strong>to</strong> evaluate the Baby Bullet service.There will be an onboard survey and a special count <strong>to</strong> better understand thesuccess of the new service.Station Access – Baby-Bullet service substantially changed the travel patterns ofexisting and new Caltrain riders. Many cus<strong>to</strong>mers travel further from their homes<strong>to</strong> access an express station, especially the intermediary stations of MountainView, Palo Al<strong>to</strong>, Hillsdale, and Millbrae. Common <strong>to</strong> all of these stations, exceptMillbrae, is the stress placed on parking access. Efforts are underway <strong>to</strong> evaluateparking needs at these stations.Shuttle Service – During the downturn in the economy, several companies pulledout of the employer shuttle program. Prior <strong>to</strong> the “dotcom bust,” there were 48Caltrain shuttles; currently there are 32 shuttle routes. Just recently, there hasbeen moderate interest by former and new companies <strong>to</strong> participate in the shuttleprogram. Over the next few years, attention will be given <strong>to</strong> increase shuttles asdemand grows.Fare Policy and Process – In 2003, the JPB approved massive changes in theCaltrain fare structure and fully implemented proof-of-payment. Proof-ofpaymentallows train conduc<strong>to</strong>rs <strong>to</strong> focus on cus<strong>to</strong>mer service instead of ticketingactivities since all ticket sales are performed before boarding. The next majorimprovement in the fare process is the introduction of TransLink, a universal fareinstrument that will eventually be recognized by all Bay Area opera<strong>to</strong>rs.TransLink is expected <strong>to</strong> be available throughout the Caltrain system in 20<strong>08</strong>.Regional Extensions – Service via extensions <strong>to</strong> down<strong>to</strong>wn San Francisco, acrossthe Dumbar<strong>to</strong>n Bridge, <strong>to</strong> Salinas/Monterey, or via High Speed <strong>Rail</strong> in <strong>California</strong>are not currently included in the operations plan, although planning and design forthese projects continues and is funded by third parties.CAPITAL IMPROVEMENT PROGRAMIn order for Caltrain <strong>to</strong> provide the service levels that will capture future demand,including latent demand, the infrastructure that supports the service must notconstrain expansion of capacity and throughput, which it does <strong>to</strong>day.Our experience over the last two years has shown that providing competitive traveltimes during the peak period is an effective way <strong>to</strong> attract passengers.However, without adding service and investing in only a few major improvements,155
<strong>2007</strong>-<strong>08</strong> – <strong>2017</strong>-<strong>18</strong> <strong>California</strong> <strong>State</strong> <strong>Rail</strong> <strong>Plan</strong>the projected demand for Caltrain service will exceed vehicle capacity in fiveyears. The capital improvement plan, incorporated in<strong>to</strong> Caltrain’s Project 2025,will address the infrastructure requirements necessary <strong>to</strong> accommodate demand,by allowing flexibility and future expansion in service.The goal of the capital program is <strong>to</strong> maintain the infrastructure and <strong>to</strong> provide thecapacity that will allow operating flexibility and future increases in capacity andtrain frequency. Capital improvements support capacity expansion in severalways: by improving throughput <strong>to</strong> support future service levels, reliability <strong>to</strong>maintain on-time performance, safety, or by adding passenger amenities.The major capital improvement program categories are:• <strong>State</strong> of Good Repair• Systems• Facilities• ExpansionThe <strong>State</strong> of Good Repair program consists of replacement and rehabilitationactivities for equipment and infrastructure that have reached the end of their‘useful’ life or requires rehabilitation. It includes the replacement of vehicles atthe end of their lifecycle, but not the addition of new rolling s<strong>to</strong>ck that is acquired<strong>to</strong> increase fleet size. One of the primary goals of the capital improvementprogram is <strong>to</strong> keep the railroad in a constant state of good repair, and appropriatelybalance the investments in replacement and rehabilitation activities withenhancement-type improvements. The <strong>State</strong> of Good Repair program will be acontinuous and integral part of all future capital activities as it is the primarymeans through which large capital projects can be enabled. The priorities forreplacement and rehabilitation may shift every 5 <strong>to</strong> 10 years depending on thecondition or lifecycle of the equipment and infrastructure and the timetable forensuing capital investments.Systems include rolling s<strong>to</strong>ck, signal, and communications improvements, as wellas electrification. The vehicle technology and size of the fleet have a majorimpact on throughput, since they determine how many passengers can be carriedat any given moment. The vehicle selection for electrification is critical becausethe design or need for major capital improvements depends on this decision. It isalso critical in terms of being able <strong>to</strong> add cars <strong>to</strong> the fleet in response <strong>to</strong> near-termmarket demand. The signal system also heavily influences throughput because itcontrols the ‘flow’ of train traffic through the system. Communicationsimprovements will be required <strong>to</strong> manage data and voice communications for allvital and non-vital systems from signals and power provision <strong>to</strong> ticket vendingmachines and passenger information systems at stations.156
Chapter IX – Commuter <strong>Rail</strong> ServicesFacilities include terminals, stations, maintenance and s<strong>to</strong>rage facilities and gradeseparations. Terminals and stations are unique because they are where trains andpassengers interface, and thus, have many opportunities <strong>to</strong> negatively impacttravel time. A long-term goal is <strong>to</strong> provide some form of level-boarding at stations<strong>to</strong> facilitate rapid boarding of trains. Terminals can be designed <strong>to</strong> optimize endof-lineoperations and minimize the number of trainsets required <strong>to</strong> operate peakhourservice. Grade separations generally do not improve throughput andreliability, but provide the most benefit in terms of improving community safetyand reducing impacts on local vehicular traffic and pedestrian access withinstations.Expansion includes any increase in track capacity and physical extensions beyondthe existing Caltrain route. Line and junction capacity improvements directlyinfluence throughput and reliability since they impact the number of trains, andtherefore the number of people, that can travel end-<strong>to</strong>-end during a given timeperiod. Delivery of future increased service levels is dependent on the ability <strong>to</strong>increase or improve line capacity and junction movements. Extension projectsbroaden the geographic area and population that have access <strong>to</strong> Caltrain service.Three proposed extensions that are addressed in this document are Down<strong>to</strong>wnSan Francisco <strong>to</strong> the Transbay Terminal, Dumbar<strong>to</strong>n <strong>Rail</strong> Corridor <strong>to</strong> theEast Bay, and Monterey/Salinas.PROPOSED SERVICE EXTENSIONSDown<strong>to</strong>wn San FranciscoIn 2001, the City and County of San Francisco in collaboration with otherBay Area transportation agencies agreed <strong>to</strong> build a new multimodal transportationterminal in San Francisco. The new center, <strong>to</strong> be located at the existing TransbayTerminal at First and Mission Streets in down<strong>to</strong>wn San Francisco, will be one ofthe largest multimodal transportation centers on the west coast. When completed,the terminal will allow a subsurface extension of Caltrain commuter service fromits current location at Fourth and King Streets <strong>to</strong> Down<strong>to</strong>wn San Francisco.The new center will also serve AC Transit, Golden Gate Transit, SamTrans,Greyhound, Amtrak feeder buses, Muni buses and light rail, and BART.Dumbar<strong>to</strong>n <strong>Rail</strong> CorridorThe former SP discontinued rail freight service in the 1980s on the 20.5-mileDumbar<strong>to</strong>n <strong>Rail</strong> Corridor between Redwood Junction and Newark Junction.A 1991 San Mateo County Transportation Authority (SMCTA) long range study<strong>to</strong> determine the feasibility of operating commuter rail service in the corridorrecommended a rail service option. As a result, the SamTrans purchased theROW in early 1994. Funds were programmed for the Dumbar<strong>to</strong>n <strong>Rail</strong> Corridor inthe MTC’s Regional Transportation <strong>Plan</strong>, and a project study report on the railcorridor was completed in February 2004.157
<strong>2007</strong>-<strong>08</strong> – <strong>2017</strong>-<strong>18</strong> <strong>California</strong> <strong>State</strong> <strong>Rail</strong> <strong>Plan</strong>The Dumbar<strong>to</strong>n Commuter <strong>Rail</strong> service will initiate new cross-bay commuter railservice between the Peninsula and the East Bay. The project will involverehabilitating and reconstructing rail facilities on the existing railroad alignmentand ROW. A phased approach <strong>to</strong> full development is now planned due <strong>to</strong> fundingconstraints. The new service is planned <strong>to</strong> start in 2012, providing three roundtripsbetween Newark and San Francisco and three round-trips betweenNewark and San Jose. Other service variations include trains originating inLivermore and Union City, with higher service levels projected for the future.The new rail corridor will link Caltrain, ACE, the Capi<strong>to</strong>l Corridor, and BART.It will also connect with East Bay bus systems at the multimodal transit center inUnion City. The Union City BART station is planned <strong>to</strong> be reconstructed as amultimodal terminal.Daily ridership is estimated at 4,800 in 2012 and 6,900 by 2025. Capital costs areestimated at $600 million, including new rolling s<strong>to</strong>ck, with annual operating andmaintenance costs of $8 million.ACE COMMUTER RAIL SERVICE(STOCKTON-SAN JOSE)PRINCIPAL <strong>2007</strong>-<strong>08</strong> <strong>to</strong> <strong>2017</strong>-<strong>18</strong> ROUTE OBJECTIVES• Continue service improvements.• Improve on-time performance.• Increase ridership on existing routes.• Pursue the Purchase of an Agency owned rail corridor for the ACEService.• Improve service coordination with other service providers such asBART, Caltrain, Capi<strong>to</strong>l Corridor, and shuttle service providers.• Acquire ROW, perform engineering work, and begin construction of railmaintenance and layover facility in San Joaquin County.• Purchase passenger rail cars and locomotive for fifth and sixth trains.• Upgrade signal system between S<strong>to</strong>ck<strong>to</strong>n and Fremont.• Upgrade passenger cars and locomotives.• Evaluate potential extensions and new services in the Central Valley.BACKGROUNDIn 1989, the San Joaquin Council of Governments, the S<strong>to</strong>ck<strong>to</strong>n Chamber ofCommerce and the Building Industry Association of the Delta began thedevelopment of a 20-year transportation plan for a future sales tax vote inSan Joaquin County. Measure K, the half-cent sales tax for transportation, was158
Chapter IX – Commuter <strong>Rail</strong> Servicesstrongly supported by voters in 1990, and the number one project identified forfunding was Altamont passenger rail service. In 1995, the seven cities andSan Joaquin County formed a joint powers agreement that created the San JoaquinRegional <strong>Rail</strong> Commission (SJRRC) <strong>to</strong> implement the rail plan and <strong>to</strong> exploreagreements with the counties of Santa Clara and Alameda. This created a fivememberboard of direc<strong>to</strong>rs appointed by the San Joaquin Council of Governments.San Joaquin County has contributed over $40 million in Measure K funding forAltamont Commuter Express (ACE) rail service.In May 1997, SJRRC, the Alameda County Congestion Management Agency(ACCMA), and Santa Clara Valley Transportation Authority (SCVTA) executedan agreement <strong>to</strong> create the Altamont Commuter Express Joint Powers Authority(JPA). The ACE JPA was dissolved on June 30th 2003 and a cooperative servicesagreement was executed between SJRRC, ACCMA and SCVTA.The Cooperative services agreement identified the SJRRC as the owner/opera<strong>to</strong>rof the ACE service, overseeing the day-<strong>to</strong>-day management, planning, and supportservices necessary <strong>to</strong> operate the trains. The SJRRC issued a contract foroperations and maintenance of equipment <strong>to</strong> Herzog Transit Services, Inc., andservice began on Oc<strong>to</strong>ber 19, 1998. Initially there were two westbound morningtrains and two eastbound evening trains. In March 2001 a third train wasinaugurated which gave ACE passengers later departure options and easedovercrowding and on August 28th 2006 a fourth midday train was initiated incoordination with Caltrans Division of <strong>Rail</strong> and Caltrans District 10.Funding for the operation and management of the ACE service is provided bypassenger fares, Transportation Development Act (TDA) funds, <strong>State</strong> TransitAssistance (STA), ACCMA funding through Alameda County’s one-half centsales tax Measure B and SCVTA funding. Each agency's annual share is based onthe percentage of <strong>to</strong>tal ACE daily boardings and alightings that occurred in fiscalyear 2002/03 in each county. Cost sharing for capital projects, excluding stations,is determined on a case-by-case basis and approved by each of the agencies.Station improvements are the responsibility of the agency for the county in whichthe station is located.ORGANIZATIONAL STRUCTUREThe SJRRC is a Joint Powers Authority consisting of the County of San Joaquinand the cities of Escalon, Lathrop, Lodi, Manteca, Ripon, S<strong>to</strong>ck<strong>to</strong>n, and Tracy.The commission is governed by a Board of Direc<strong>to</strong>rs which consists of six electedofficials appointed by the San Joaquin Council of Governments from nominationsby local agencies, and is supplemented by two elected officials appointed by theACCMA <strong>to</strong> address rail service issues affecting Alameda County. Ex-officiomembers represent Caltrans District 10, San Joaquin Regional Transit District, andthe San Joaquin Council of Governments.159
<strong>2007</strong>-<strong>08</strong> – <strong>2017</strong>-<strong>18</strong> <strong>California</strong> <strong>State</strong> <strong>Rail</strong> <strong>Plan</strong>In July 2003, the SJRRC became the designated owner, opera<strong>to</strong>r and policymakingbody of the ACE service in accordance with the Cooperative ServiceAgreement between the SJRRC, the ACCMA, and VTA, which superseded andrescinded the prior 1997 agreement. As the designated owner of the ACE service,the SJRRC <strong>to</strong>ok title <strong>to</strong> all of the assets and assumed the liabilities that werepreviously under ownership of the ACE Joint Powers Authority, which wasdissolved.The purpose of the Cooperative Services Agreement is <strong>to</strong> improve and expand theACE service and protect the interests of the three counties along the corridor.As part of this agreement, the SJRRC is required <strong>to</strong> provide a baseline three-trainservice <strong>to</strong> Santa Clara and Alameda Counties in return for a “capped”contribution.ROUTE AND SERVICE DESCRIPTIONACE operates Monday through Friday over 86 miles of track, providing threeround-trips between S<strong>to</strong>ck<strong>to</strong>n and San Jose during morning and evening peakperiods and one midday train operated in coordination with the Intercity Amtrak<strong>California</strong> San Joaquin service between S<strong>to</strong>ck<strong>to</strong>n and San Jose (see Figure 9H).The running time between S<strong>to</strong>ck<strong>to</strong>n and San Jose is approximately2 hours-10 minutes.ACE serves these stations: S<strong>to</strong>ck<strong>to</strong>n, Lathrop/Manteca, Tracy, Vasco, Livermore,Pleasan<strong>to</strong>n, Fremont, Great America, Santa Clara, and San Jose. Free parking isavailable at all stations, except at the Santa Clara and San Jose stations wherethere is a daily fee of $1.50.FARE STRUCTUREThe ACE has five fare zones based on distance traveled. The system has a proofof-paymentsystem where riders must show proof of ticket purchase when asked <strong>to</strong>do so. Ticket types are one-way, round-trip, weekly, 20-ride, and monthly passes.The ACE is working with the CCJPA and the Department on a pilot program <strong>to</strong>integrate service ideas and amenities common <strong>to</strong> both systems <strong>to</strong> control costs andbenefit passengers on both corridors. These efforts include a common globalpositioning system (GPS), joint au<strong>to</strong>mated ticketing, public address (PA)announcements, and electronic fare media at shared stations.CONNECTING SERVICESBus and rail transit connections and dedicated shuttles are an integral part of theACE system, providing a seamless commuting link between stations and riders’workplaces. All stations with the exception of the Tracy station have some formof connecting transit. In addition, three stations have direct connections <strong>to</strong> railservices. The S<strong>to</strong>ck<strong>to</strong>n station has connections <strong>to</strong> the San Joaquin Route trains.The Santa Clara-Great America station connects with Caltrain and the160
Chapter IX – Commuter <strong>Rail</strong> ServicesCapi<strong>to</strong>l Corridor. At San Jose, connections are made with Caltrain, the Capi<strong>to</strong>lCorridor, and the Amtrak long distance Coast Starlight.PERFORMANCEFigure 9HIn 2005 calendar year, ACE ridershipwas over 667,000. ACE is improvingmarketing outreach <strong>to</strong> increaseridership. Passenger fares in 2006approximated $3.9 million. ACE’sOTP in 2006 averaged 75 percent.Figure 9H shows ACE’s annualridership from 1999 through 2006.ACE RidershipCalendar Years 1998-2006Year Ridership Year Ridership1998 67,222 2003 607,0171999 424,988 2004 640,7532000 714,259 2005 667,0292001 922,976 2006 676,0502002 803,522PLANNED IMPROVEMENTSACE service will continue with three round-trip trains in the morning and eveningcommute windows and one midday train. ACE will continue <strong>to</strong> focus onimproving OTP and train speeds, expanding options for communicating trainstatus <strong>to</strong> passengers, providing more opportunities for passengers <strong>to</strong> participate inthe ACE planning process, and implementing new schedules as necessary <strong>to</strong>improve coordination and performance. ACE will invest in infrastructure projectsthat will allow for higher track speeds or improved reliability.CAPITAL IMPROVEMENT PROGRAMThe ACE <strong>2007</strong>/<strong>08</strong> capital improvement program <strong>to</strong>tals $29.9 million. Principalprojects include:<strong>Rail</strong> Maintenance and Layover Facility in San Joaquin County - $6.0 millionThis is a multi-year project with funds for ROW acquisition, and engineering.Signal Upgrade Project (S<strong>to</strong>ck<strong>to</strong>n <strong>to</strong> Fremont) - $3.0 millionThis is a multi-year project, which began in FY 2004-05, <strong>to</strong> upgrade the signalsystem between S<strong>to</strong>ck<strong>to</strong>n and Fremont and improve service reliability. The <strong>to</strong>talestimated project cost is $11.5 million, and funds identified are for work <strong>to</strong> becompleted in FY <strong>2007</strong>/<strong>08</strong>.Cabral Station Neighborhood Revitalization ProjectThis is a multi-year project, with Phase I construction initiation and completion inFY <strong>2007</strong>/<strong>08</strong>. Phase I construction is <strong>to</strong> re-route the existing bus service off theresidential street (Channel street) <strong>to</strong> Aurora Street providing improved transitcirculation at the station.161
<strong>2007</strong>-<strong>08</strong> – <strong>2017</strong>-<strong>18</strong> <strong>California</strong> <strong>State</strong> <strong>Rail</strong> <strong>Plan</strong>Track Upgrade - $0.7 millionThis project includes upgrade of the diamond at Lyoth and replacement of theswitch at Hunter Street.Capital Spares/Upgrades for Passenger Cars and Locomotives - $0.9 millionThis project includes new seat cushions for the original eight passenger cars, twonew air conditioning units and the overhaul of <strong>18</strong> more units, locomotive andpassenger car wheels, and two locomotive traction mo<strong>to</strong>rs.PROPOSED SERVICE EXTENSIONSThe SJRRC is completing a study on potential extensions and new services in theCentral Valley. The final report is expected <strong>to</strong> go before the SJRRC Board inFall <strong>2007</strong> for approval. The study is reviewing extensions <strong>to</strong> the ACE service,which include Merced <strong>to</strong> Sacramen<strong>to</strong> commuter service, commuter service <strong>to</strong> theEast Bay from S<strong>to</strong>ck<strong>to</strong>n <strong>to</strong> Oakland, the Westside line from Los Banos <strong>to</strong> Tracy,and coordination with BART in the Livermore/Amador area.PROPOSED COMMUTER RAIL SERVICESThree potential new commuter rail services are being proposed. They arediscussed below.VENTURA AND SANTA BARBARA COMMUTER RAIL SERVICEThere is interest in expanding commuter rail service in Ventura and Santa BarbaraCounties. Currently, Metrolink operates the Ventura County line betweenLos Angeles and Montalvo and the Pacific Surfliner operates five daily roundtripsfrom Los Angeles <strong>to</strong> Goleta, with two trips continuing <strong>to</strong> San Luis Obispo.Thus, commuter and intercity rail service now serves Ventura County and intercityrail service serves Santa Barbara County.“101 in Motion” and the LOSSAN North Strategic <strong>Plan</strong> are two recent studies ofcommuter transportation patterns in Ventura and Santa Barbara Counties.In addition, Southern <strong>California</strong> Association of Governments (SCAG) has initiateda study that will look at alternatives including additional Amtrak intercity railservice and commuter rail service utilizing existing equipment types or DMUtechnology. For each alternative, the study will develop an operational analysisincluding: service scenarios, equipment needs, as well as estimates for ridership,revenues, operating and maintenance costs, and operating deficit.SONOMA MARIN-AREA RAIL TRANSITThe purpose of the Sonoma Marin Area <strong>Rail</strong> Transit District (SMART) is <strong>to</strong>provide passenger rail passenger service <strong>to</strong> Sonoma and Marin County residentsalong the Northwestern Pacific (NWP) rail corridor. The NWP generally parallelsHighway 101 and is located in Sonoma and Marin counties, north ofSan Francisco. AB 2224 (2002) authorized the creation of the SMART <strong>Rail</strong>162
Chapter IX – Commuter <strong>Rail</strong> ServicesDistrict. The legislation designated SMART as the owner of the NWP corridorfrom Healdsburg <strong>to</strong> Corte Madera, and as the opera<strong>to</strong>r for passenger rail service.Passenger rail service on the line was provided as late as 1958, with service <strong>to</strong>San Rafael. Public acquisition of the line began in the 1970's and was completedin the mid-1990's. Numerous transportation planning studies, dating back <strong>to</strong> the1980's have recommended the utilization of the NWP for passenger rail service.Prior <strong>to</strong> the formation of the SMART <strong>Rail</strong> District, the project was planned by thejoint county SMART Commission, which was replaced by the SMART DistrictBoard of Direc<strong>to</strong>rs in 2003.The SMART Commission sponsored the Sonoma Marin Transportation and LandUse Study, in 1995, which recommended specific station locations and rail linetermini. In 2001, the Commission oversaw the Commuter <strong>Rail</strong> Implementation<strong>Plan</strong>, which recommended 30-minute service along the line. Work <strong>to</strong> refine that<strong>Plan</strong> and produce environmental clearance for the project was initiated in 2001.Consultant contracts <strong>to</strong> develop rail systems planning work (2001), environmentalanalysis (2003), community outreach (2002), and station planning (2003) areon-going. The Draft Environmental Impact Report is expected in fall, 2005.Current implementation plans include service start up in 2009-10 along a 70-milecorridor with service from Cloverdale <strong>to</strong> the existing Larkspur ferry terminal.Fourteen stations are planned: nine in Sonoma County and five in Marin County.Service assumptions include 30-minute peak period headways and twelve trainsper day. Initial ridership is estimated at about 5,000 per day. DMU rail vehiclesare currently being evaluated for use along the corridor.The SMART estimates capital costs (in 2004 dollars) <strong>to</strong> upgrade tracks, buildstations and a maintenance facility, and purchase vehicles at $340 million for thefull 70-mile corridor. Projected operating costs are $10-12 million per year.Approximately $120 million in local, <strong>State</strong> and Federal funding has been set asidefor the project. The remaining funding for the project, including on-goingoperating funds, would come from a district wide one-quarter-cent sales taxmeasure. It is anticipated that measure will be placed on the ballot inNovember 2006.AUBURN-OAKLAND REGIONAL RAIL SERVICESix agencies have partnered <strong>to</strong> develop a service concept plan for a new regionalcommuter rail service in the urban corridor extending from Auburn (Bowman) <strong>to</strong>Oakland. The agencies are: the CCJPA, Contra Costa Transportation Authority,Solano Transportation Authority, Yolo County Transportation District,Sacramen<strong>to</strong> Regional Transit District, and Placer County Transportation <strong>Plan</strong>ningAgency. The UP, the Sacramen<strong>to</strong> Area Council of Governments, and theDepartment also participated in the study that was originated in 2002. The newservice would augment existing Capi<strong>to</strong>l Corridor intercity service by providing163
<strong>2007</strong>-<strong>08</strong> – <strong>2017</strong>-<strong>18</strong> <strong>California</strong> <strong>State</strong> <strong>Rail</strong> <strong>Plan</strong>additional peak period capacity for within the greater Sacramen<strong>to</strong> urban area andbetween Auburn and the Bay Area. The two services would utilize the sameequipment, staff, and fare structure, and thus would appear fully unified <strong>to</strong> theriding public.The Auburn-Oakland Regional <strong>Rail</strong> Service Concept <strong>Plan</strong> (<strong>Plan</strong>) was released inJune 2005. The <strong>Plan</strong> was endorsed by the group’s steering committee inSeptember 2005. This <strong>Plan</strong> contains a near-term and a long-term implementationaction plan. However, at this time the UP will not participate in any furthercapacity modeling for potential new passenger rail services due <strong>to</strong> major freightcongestion problems the railroad is experiencing within this and other corridors.The <strong>Plan</strong> includes three-phases, with a first phase in 2010, planned <strong>to</strong> add fournew Sacramen<strong>to</strong>-Oakland round-trips. The second phase planned for 2015, wouldinclude four new Sacramen<strong>to</strong>-Auburn round-trips and one additional Oakland <strong>to</strong>Sacramen<strong>to</strong> round-trip. When mixed with Capi<strong>to</strong>l Corridor trains, 30-minuteintervals (headways) would be provided during peak periods in both directions.The third phase, planned for 2020 would add new stations, primarily in theSacramen<strong>to</strong> metropolitan area. Daily ridership of 6,900 is projected byimplementation of the third phase. However, it is now expected that these dateswill slip due <strong>to</strong> lack of an identified funding source for equipment and capitalimprovements.Auburn-Oakland Regional <strong>Rail</strong> would initially serve all existing stations along theCapi<strong>to</strong>l Corridor: Auburn, Rocklin, Roseville, Sacramen<strong>to</strong>, Davis,Suisun/Fairfield, Martinez, Richmond, Berkeley, Emeryville, and Oakland.Additional station s<strong>to</strong>ps would be phased in at Bowman (5 miles north of Auburn),Antelope, Swans<strong>to</strong>n, West Sacramen<strong>to</strong>, Dixon, Fairfield/Vacaville, Benicia, andHercules for a <strong>to</strong>tal of 19 stations.The <strong>Plan</strong> projects the <strong>to</strong>tal cost of operating and maintaining the Regional <strong>Rail</strong>service <strong>to</strong> be approximately $15.5 million annually, including fees paid <strong>to</strong> the UPand Amtrak, vehicle and station maintenance, and administrative expenses.The capital requirements, including new rolling s<strong>to</strong>ck, track work and signals,stations and parking, and maintenance facility and other system wideimprovements, are estimated <strong>to</strong> cost $380 million. The <strong>Plan</strong> anticipates that thefunding for Regional <strong>Rail</strong> will come from a mix of sources including Federal NewStarts funds, CMAQ or RSTP, <strong>State</strong> discretionary funds, the Capi<strong>to</strong>l Corridor, andother local funds. The project is authorized in SAFETEA-LU, under the NewStarts Program for Alternatives Analysis/Preliminary Engineering.164
165Chapter IX – Commuter <strong>Rail</strong> Services
<strong>2007</strong>-<strong>08</strong> – <strong>2017</strong>-<strong>18</strong> <strong>California</strong> <strong>State</strong> <strong>Rail</strong> <strong>Plan</strong>Figure 10A166
Chapter X – Potential New ServicesCHAPTER XPOTENTIAL NEW SERVICESThis Chapter contains a discussion on six potential intercity passenger rail routes,three of them proposed by the Department for service in the ten-year period.Figure 10A displays the six potential intercity passenger rail routes. Also, fourhigh-speed rail and magnetic levitation projects in <strong>California</strong> are discussed.Chapter IX discusses proposed extensions of existing commuter rail services aswell as proposed new commuter rail services.PROPOSED INTERCITY RAIL ROUTESThis section includes a description of the three new routes that the Departmentproposes for service in this ten-year plan. The routes are discussed in order ofpotential implementation by year: San Francisco <strong>to</strong> San Luis Obispo (andLos Angeles); Sacramen<strong>to</strong> <strong>to</strong> Reno; and Sacramen<strong>to</strong> <strong>to</strong> Redding. Included foreach route is a summary of current service <strong>to</strong> the area, recent studies of the route,and the Department’s current service proposal. The implementation of all newservice is subject <strong>to</strong> demonstrated ridership demand, approval from Amtrak andthe relevant railroad(s), availability of operating and capital funding andequipment, and completion of necessary capital projects.SAN FRANCISCO TO SAN LUIS OBISPO (AND LOS ANGELES) VIACOAST ROUTE (COAST DAYLIGHT)The extension of the Pacific Surfliners from San Luis Obispo <strong>to</strong> San Franciscowould close a key gap in the <strong>State</strong>-supported intercity rail system by providingdirect train service from San Francisco <strong>to</strong> Los Angeles. Regional transportationplanning agencies have led the planning for this extension and will continue <strong>to</strong>provide an important role in the planning and operation of this extension.Twenty agencies along the corridor have passed “Resolutions of Support” for theextension.BackgroundCurrently only one daily round-trip Coast Starlight train connects Oakland andSan Jose with Los Angeles via the Coast with intermediate s<strong>to</strong>ps includingSalinas, Paso Robles, San Luis Obispo, and Santa Barbara on its route fromSeattle. Also two round trip Amtrak Thruway buses operate from San LuisObispo <strong>to</strong> San Francisco. Also, two buses run from Santa Barbara <strong>to</strong>San Francisco. Ridership on this entire bus route was extremely good with 84,000in 2005-06.167
<strong>2007</strong>-<strong>08</strong> – <strong>2017</strong>-<strong>18</strong> <strong>California</strong> <strong>State</strong> <strong>Rail</strong> <strong>Plan</strong>There has been interest for many years in providing additional Coast Route service<strong>to</strong> better link <strong>California</strong>’s two largest metropolitan areas. In 1992, H.R. 39 waspassed requesting a Coast Corridor intercity rail corridor upgrade study beconducted by the regional transportation planning agencies along the Corridor incooperation with the Department. As a result, concerned local agencies formedthe Coast <strong>Rail</strong> Coordinating Council (CRCC) that is staffed by the San LuisObispo Council of Governments. The Coast <strong>Rail</strong> Improvement Study issued inthe fall of 1994 resulted from H.R. 39. Then in 1996, the Coast RouteInfrastructure Assessment Report was completed. One of the main goals of theCRCC is <strong>to</strong> “close the gap” in <strong>State</strong>-supported train services by connectingdown<strong>to</strong>wn Los Angeles and down<strong>to</strong>wn San Francisco with daily train service.In 2000, the CCRC issued a Coast Daylight Implementation <strong>Plan</strong> that envisionsdaily service operating on Caltrain tracks from San Francisco <strong>to</strong> San Jose, and thenon UP tracks <strong>to</strong> Moorpark, and then on Metrolink tracks <strong>to</strong> Los Angeles. Stationsare planned in San Francisco, Millbrae, Palo Al<strong>to</strong>, Mountain View, Santa Clara,San Jose, Gilroy, Pajaro, Salinas, Soledad, King City, Paso Robles, San LuisObispo, and south <strong>to</strong> Los Angeles s<strong>to</strong>pping at existing Pacific Surfliner stations.The study includes operating costs, and in fall 2004, the CRCC released theCapacity Analysis for this service. The analysis identified several capitalimprovements that would be helpful in order <strong>to</strong> increase train frequencies on theCoast Route. The CRCC is now working with Amtrak, UP, and the Department <strong>to</strong>identify how <strong>to</strong> move forward on Capital Projects. A <strong>to</strong>tal of over $26 million willlikely soon be programmed for capital improvements; The Department hasrecommended $25 million from Proposition 1B funds for new track or sidings forthe Coast Daylight; and both the San Luis Obispo Council of Governments andTransportation Agency for Monterey County have each committed $500,000.Additionally, $<strong>18</strong>.3 million is included in the 2006 <strong>State</strong> TransportationImprovement Program (STIP) augmentation, approved by the <strong>California</strong>Transportation Commission (CTC), for sidings in Santa Barbara and Venturacounties in the portion of the Route south of San Luis ObispoOperating <strong>Plan</strong>The Department’s ten-year operating plan includes one round-trip train betweenSan Francisco and San Luis Obispo, starting in 2010-11, with a second train in2013-14. The first train would be operated from San Luis Obispo <strong>to</strong> Los Angelesas an extension of the new Pacific Surfliner train added in November 2004, andwould provide through train service between San Francisco and Los Angeles.The second train would operate as an extension of the planned third Los Angeles-San Luis Obispo round-trip. Direct train connections <strong>to</strong> San Diego at Los Angeleswould be available on most trips. The Department is working <strong>to</strong> obtain equipment<strong>to</strong> be used for the service.168
Chapter X – Potential New ServicesThe Department believes this extension is a good candidate for rail servicebecause:• It would be the only <strong>State</strong>-supported route <strong>to</strong> provide direct train servicebetween the two major population centers of the <strong>State</strong>, thus closing a key gapin the system.• There is strong ridership on the one daily Coast Starlight round-trip and on thefour daily Amtrak Thruway buses.An existing local organization, the CRCC, is actively planning the service, andimplementation plans have been completed.SACRAMENTO TO RENOThe extension of intercity rail service from Sacramen<strong>to</strong> <strong>to</strong> Reno would bring <strong>State</strong>supportedrail service <strong>to</strong> the Truckee/Tahoe and Reno/Sparks <strong>to</strong>urist areas as wellas provide relief <strong>to</strong> the highly congested I-80 –Bay Area <strong>to</strong> Reno corridor.BackgroundAmtrak’s <strong>California</strong> Zephyr and connecting buses <strong>to</strong> the Capi<strong>to</strong>l Corridor andSan Joaquins serve Reno and intermediate I-80 Corridor points.The <strong>California</strong> Zephyr makes s<strong>to</strong>ps at Reno, Truckee, Colfax, Roseville, andSacramen<strong>to</strong> once daily in each direction on its route <strong>to</strong> Chicago. Also, Amtrakbuses connect <strong>to</strong> two San Joaquins and three Capi<strong>to</strong>l Corridor trains and serveReno/Sparks, Truckee, Soda Springs, Colfax, Auburn, Rocklin, Roseville, andSacramen<strong>to</strong>. Ridership on this bus route was 51,000 in 2005-06.In 2002, the CCJPA and the Placer County Transportation <strong>Plan</strong>ning Agencyinitiated a study <strong>to</strong> extend the Capi<strong>to</strong>l Corridor <strong>to</strong> Reno. The study was intended<strong>to</strong> provide current ridership, revenue, and train operating cost estimates for thetrain extension, and the capital costs for necessary station and track improvements.However, the study was suspended in March 2005 as a result of the UP’s decision<strong>to</strong> not conduct additional network modeling or consider operation of newpassenger train service <strong>to</strong> Reno at this time. The UP has experienced a significantincrease in freight traffic and has made a business decision <strong>to</strong> focus its efforts atthis time on addressing additional freight demand.Operating <strong>Plan</strong>The Department’s ten-year operating plan includes the extension of oneCapi<strong>to</strong>l Corridor round-trip from Sacramen<strong>to</strong> <strong>to</strong> Reno/Sparks in 2014-15, anda second round-trip in 2016-17. This rail service would be supplemented bycontinued operation of existing bus service that runs over the same route as thetrain, but at other times of the day. This service would require an appropriate levelof financial participation from the <strong>State</strong> of Nevada (and potentially Nevadabusiness interests).169
<strong>2007</strong>-<strong>08</strong> – <strong>2017</strong>-<strong>18</strong> <strong>California</strong> <strong>State</strong> <strong>Rail</strong> <strong>Plan</strong>The Department believes this corridor is a good candidate for rail corridor servicebecause:• Amtrak currently operates the <strong>California</strong> Zephyr on the route so that stations atthe major destination points already exist.• I-80 is extremely congested at <strong>to</strong>urist peak periods and there is a very stronggaming, skiing, and general recreation market in the Reno/Truckee area.• Current bus ridership on this route is strong.SACRAMENTO TO REDDINGOperation of intercity rail service from Sacramen<strong>to</strong> <strong>to</strong> Redding would extend<strong>State</strong>-supported intercity rail service <strong>to</strong> a fast growing northern <strong>California</strong> area notpresently served by the <strong>State</strong>-supported intercity passenger rail network.BackgroundConnecting buses <strong>to</strong> the San Joaquin and Capi<strong>to</strong>l Corridor trains currently servethe northern Sacramen<strong>to</strong> Valley. Buses connect <strong>to</strong> four of the San Joaquins inS<strong>to</strong>ck<strong>to</strong>n, and one in Sacramen<strong>to</strong>, and travel north through Sacramen<strong>to</strong>,Marysville, Chico, and Redding. Five Capi<strong>to</strong>l Corridor trains in Sacramen<strong>to</strong> alsohave a bus connection <strong>to</strong> Redding. Ridership on this bus route is the secondhighest of all <strong>California</strong> dedicated bus routes after Los Angeles-Bakersfield, with104,000 riders in 2005-06. Additionally, the single daily round-trip of theCoast Starlight connects Redding and Chico with Sacramen<strong>to</strong>, the Bay Area, andLos Angeles on its route from Seattle.The most recent study on the Sacramen<strong>to</strong>-Redding corridor is the NorthernSacramen<strong>to</strong> Valley Intercity Passenger <strong>Rail</strong> Study, Interim Findings Report,produced in 1995 for the Butte County Association of Governments.The Department had planned a further study on this Route in 2005, which wasdeferred due <strong>to</strong> the UP’s decision not <strong>to</strong> consider operation of new passengertrains at this time.Operating <strong>Plan</strong>The Department’s ten-year operating plan includes one daily round-trip betweenSacramen<strong>to</strong> and Redding in 2015-16. This rail service would be supplemented bybus service that would run over the same route as the train, but at other times ofthe day.170
Chapter X – Potential New ServicesThe Department believes this extension is a good candidate for rail servicebecause:• Amtrak currently operates the Coast Starlight on this Route, with existingstations at Sacramen<strong>to</strong>, Chico, and Redding.• The demographics of the Route are positive: the northern Sacramen<strong>to</strong> Valleyhas a fast growing population; Redding represents the urban hub for thenorthern part of the <strong>State</strong>; and the <strong>California</strong> <strong>State</strong> University at Chico is afocus of activity and population.• Current ridership on this bus route is the second highest of all <strong>California</strong>dedicated bus routes after Los Angeles-Bakersfield.POTENTIAL INTERCITY RAIL ROUTESThis section includes a discussion of three routes where funding is not proposed inthe time period of this plan: Los Angeles <strong>to</strong> Indio (Coachella Valley),San Francisco <strong>to</strong> Monterey, and Los Angeles <strong>to</strong> Las Vegas.LOS ANGELES TO INDIO (COACHELLA VALLEY)<strong>State</strong>-supported intercity passenger rail service from Los Angeles <strong>to</strong> Indio wouldextend rail service <strong>to</strong> a fast growing population center in the southeast of the <strong>State</strong>.BackgroundCurrently Amtrak’s Sunset Limited provides three-times per week service fromLos Angeles <strong>to</strong> Pomona, Ontario, and Palm Springs on its route <strong>to</strong> New Orleans.San Joaquin trains provide once a day connecting buses <strong>to</strong> the Coachella Valley.Ridership on this route was 32,000 in 2005-06.There has been strong local interest in rail service <strong>to</strong> the Coachella Valley since1991 when the Riverside County Transportation Commission published theLos Angeles-Coachella Valley-Imperial County Intercity <strong>Rail</strong> Feasibility Studythat evaluated the feasibility of operating three daily round-trip <strong>State</strong>-supportedintercity trains on the route. In 1995, the Department published the Calexico-Coachella Valley-Los Angeles <strong>Rail</strong> Corridor Study for the <strong>California</strong>Transportation Commission.The most recent study titled the Coachella Valley Passenger <strong>Rail</strong> Feasibility Studywas prepared for the Coachella Valley Association of Governments in 1999.The study included operating and capital cost estimates for the route and proposestwo daily intercity round-trip trains. The study proposed operating fromLos Angeles <strong>to</strong> the Coachella Valley using the BNSF route between Los Angelesand Col<strong>to</strong>n, and the UP route eastward <strong>to</strong> Indio. Stations were proposed atLos Angeles, Fuller<strong>to</strong>n, Riverside, Palm Springs, Palm Desert, and Indio.The study estimated $9.3 million in capital costs, not including rolling s<strong>to</strong>ck.171
<strong>2007</strong>-<strong>08</strong> – <strong>2017</strong>-<strong>18</strong> <strong>California</strong> <strong>State</strong> <strong>Rail</strong> <strong>Plan</strong>The study proposed local funding for the new station at Palm Desert. The City ofIndio received a <strong>State</strong>-matching grant of $1.5 million <strong>to</strong> construct its new station.A serious impediment <strong>to</strong> intercity rail service between Los Angeles and Indio isthe UP’s recent decision not <strong>to</strong> consider operation of new passenger train corridorsat this time. This single track route has very heavy freight traffic that makes theoperation of passenger service difficult.Operating <strong>Plan</strong>The Department proposes one daily round-trip between Los Angeles and Indio.No funding for this service is included in the ten-year operating plan, as the startdate of this Route is uncertain at this time.The Department believes this extension is a good candidate for intercity railservice because:• There is existing Amtrak intercity rail service on a good part of the route, andall but one station already exists.• There is local support and financial commitment.• There is existing moderate bus ridership on the route, with a growingpopulation.SAN FRANCISCO TO MONTEREY<strong>State</strong>-supported intercity rail service from San Francisco <strong>to</strong> Monterey wouldconnect the San Francisco Bay Area <strong>to</strong> an important <strong>to</strong>urist and population centerof the <strong>State</strong> that currently has very inadequate intercity transportation.BackgroundCurrently, the only Amtrak service existing between Monterey and San Franciscois via the Coast Starlight, which provides one daily round-trip from Oakland <strong>to</strong>Salinas, with bus connections <strong>to</strong> San Francisco from Oakland and <strong>to</strong> Montereyfrom Salinas. In June 2005, Caltrans discontinued Capi<strong>to</strong>l Corridor feeder busservice from San Jose <strong>to</strong> Monterey due <strong>to</strong> low ridership.The Transportation Agency for Monterey County (TAMC) has conducted anumber of studies on train service options between San Francisco and Monterey.The San Francisco-Monterey Intercity <strong>Rail</strong> Service Implementation <strong>Plan</strong> wascompleted in 1998. In 2003, TAMC completed the Monterey Intercity <strong>Rail</strong>Project Study, which included conceptual engineering; initial cost estimates, andenvironmental screening for the project.In the near-term, TAMC is planning a new service <strong>to</strong> link Monterey <strong>to</strong>San Francisco through a combination of local service and Caltrain commuter railservice. Starting in 2014, local light rail or bus rapid transit service is planned <strong>to</strong>connect Monterey and Marina, and later extend <strong>to</strong> Castroville and possiblySalinas. TAMC is concurrently working with Caltrain <strong>to</strong> extend commuter rail172
Chapter X – Potential New Servicesservice in 2011 <strong>to</strong> Salinas from its current terminus in Gilroy. The extension ofCaltrain commuter rail service <strong>to</strong> Monterey County would serve new stations inPajaro and Castroville, and end in Salinas. TAMC is working <strong>to</strong> ensure that thelocal service on the Monterey Branch Line would connect with the Caltrainservice via cross-platform transfers in Castroville. Bus connections <strong>to</strong> work andvisi<strong>to</strong>r destinations, as well as transit-oriented developments, are planned at keylocations along the way in Monterey County <strong>to</strong> maximize the usage of bothservices. (See Chapter IX for more detail on this proposed Caltrain extension.)In the longer term, TAMC is planning intercity rail service between Monterey andSan Francisco. The intercity service would have s<strong>to</strong>ps in Monterey, Marina,Castroville, Pajaro, San Jose, San Francisco Airport (at Millbrae), and down<strong>to</strong>wnSan Francisco, with a possible s<strong>to</strong>p in Palo Al<strong>to</strong>. TAMC envisions two roundtripson weekdays and three on weekends for the Monterey <strong>to</strong> San Franciscoservice.The proposed intercity route would use the current Caltrain owned right-of-waybetween San Francisco and San Jose. The route between San Jose and Castrovilleis owned by Union Pacific and used for passenger service by Caltrain <strong>to</strong> Gilroyand by the Coast Starlight <strong>to</strong> Castroville (and beyond <strong>to</strong> Los Angeles).TAMC purchased the Monterey Branch Line between Castroville and the SeasideCity limits from Union Pacific in 2003; the portion from Seaside <strong>to</strong> Monterey isalready owned by Seaside and Monterey. Currently there is no rail passengerservice on this branch line and it requires substantial capital rehabilitation.Approximately $5.0 million remains in Proposition 116 funds that can be used forthe Monterey Branch line rehabilitation construction activities. TAMC haspreviously secured $11.2 million in <strong>State</strong> and Federal funds, and estimates <strong>to</strong>talproject capital costs including capital equipment costs between $143 and$327 million depending on the type of service and equipment chosen.TAMC plans <strong>to</strong> utilize <strong>State</strong> Transportation Improvement Program (STIP) fundingand future transportation sales tax funds <strong>to</strong> match Federal new starts funding <strong>to</strong>pay for the remainder of the capital costs.Operating <strong>Plan</strong>The Department proposes, contingent on the start of local service in 2014,two intercity rail weekday round-trips and three weekend round-trips betweenSan Francisco and Monterey. No funding for this service is included in theten-year operating plan, as the start date of this route is uncertain at this time.173
<strong>2007</strong>-<strong>08</strong> – <strong>2017</strong>-<strong>18</strong> <strong>California</strong> <strong>State</strong> <strong>Rail</strong> <strong>Plan</strong>The Department believes there are several advantages <strong>to</strong> this intercity rail service,including:• Monterey is an important <strong>to</strong>urist destination that currently has very inadequateaccess via intercity mass transportation.• TAMC has strong local support for rail service. It is working <strong>to</strong> secure a localtransportation sales tax <strong>to</strong> help support rail projects and Chapter 103, Statutesof 1999 (SB 886, McPherson) allows TAMC <strong>to</strong> be a party in an operationscontract between the Department and Amtrak.• $14 million in Proposition 116 capital funds were earmarked for intercity railservice on this corridor.LOS ANGELES TO LAS VEGASIn 1997, Amtrak discontinued the tri-weekly Desert Wind that ran fromLos Angeles <strong>to</strong> Chicago via Las Vegas. Currently, San Joaquin trains provideconnecting buses from Bakersfield <strong>to</strong> Las Vegas via Lancaster. Ridership on thisroute was 16,077 in 2005-06.In 1998, Amtrak announced plans <strong>to</strong> start service from Los Angeles <strong>to</strong> Las Vegaswith one daily round-trip. However, due <strong>to</strong> continuing funding shortfalls andincreased capital requirements <strong>to</strong> initiate service, the new service was notimplemented.The Regional Transportation Commission (RTC) of Southern Nevada iscompleting a feasibility study on multi-frequency rail service between Las Vegasand Los Angeles. This study is being funded jointly by the RTC, FRA and the<strong>State</strong> of Nevada. The Department is working with the Commission on the studythat includes ridership, cost and revenue projections; track, station, maintenancefacility and property acquisition needs; equipment recommendations; andschedules for planning purposes. The study concludes that the service is feasibleand improvements can be phased. A final white paper recommending a phasingstrategy is underway.The Department presently includes no operating or capital costs for this service inits ten-year plan because costs and implementation schedules are dependant on theresults of the Nevada study as well as agreement between <strong>California</strong> and Nevadaon cost sharing.174
Chapter X – Potential New ServicesHIGH-SPEED RAILBACKGROUNDHigh-speed rail has been studied in <strong>California</strong> for over a decade.The Department participated in a number of studies in the late 1980s and early1990s. The Department was a member of the Los Angeles-Fresno-Bay Area/Sacramen<strong>to</strong> High-Speed <strong>Rail</strong> Corridor Study Group. The group published itsreport in 1990 as required by Chapter 197, Statutes of 1988 (AB 971 - Costa).Under Chapter 1104, Statutes of 1990 (SB 1307 - Garamendi), the Department in1991, completed a work plan for a feasibility study for the development of anintegrated public, private, or combined public/private high-speed intercity andcommuter rail system. Under Proposition 116, the Department completeda preliminary engineering and feasibility study on high-speed service betweenBakersfield and Los Angeles.Senate Concurrent Resolution 6 (1993) established the <strong>California</strong> IntercityHigh-Speed <strong>Rail</strong> Commission. This Commission, while using some Departmentstaff resources, was not part of the Department. The Final Report of theCommission was sent <strong>to</strong> the Legislature at the end of 1996 and indicated that highspeedrail is technically, environmentally, and economically feasible, and onceconstructed, could be operationally self-sufficient. The Commissionrecommended a San Francisco/San Jose/Sacramen<strong>to</strong>-Central Valley-Los Angeles-San Diego alignment. The commission also recommended using either steelwheel-on-steel-railhigh-speed technology or magnetic levitation (maglev).CALIFORNIA HIGH-SPEED RAIL AUTHORITYThe <strong>California</strong> High-Speed <strong>Rail</strong> Act, enacted by Chapter 796, Statutes of 1996(SB 1420 - Kopp and Costa), established the <strong>California</strong> High-Speed <strong>Rail</strong> Authority(CHSRA) <strong>to</strong> direct the development and implementation of intercity high-speedrail service. The act defined high-speed rail as "intercity passenger rail servicethat utilizes an alignment and technology that make it capable of sustained speedsof 200 miles per hour or greater."Chapter 791, Statutes of 2000 (AB 1703 - Florez), modified the CHSRA’sexclusive authorization and responsibility for planning, construction, andoperation of high-speed passenger train service <strong>to</strong> cover speeds exceeding125 miles per hour. Previously, the CHSRA had such authorization andresponsibility for speeds exceeding 100 miles per hour. AB 1703 also extendedthe tenure of the CHSRA through 2003. Then Chapter 696, Statues of 2002(SB 796 - Costa) repealed the sunset date for the CHSRA, making it a permanentauthority. The CHSRA is composed of nine members. The Governor appointsfive members, the Senate Committee on Rules appoints two members, and theSpeaker of the Assembly appoints two members.175
<strong>2007</strong>-<strong>08</strong> – <strong>2017</strong>-<strong>18</strong> <strong>California</strong> <strong>State</strong> <strong>Rail</strong> <strong>Plan</strong>In 2000, the CHSRA completed its Business <strong>Plan</strong>, Building a High-Speed TrainSystem for <strong>California</strong>. The Business <strong>Plan</strong> found that a high-speed train system is asmart investment in mobility, an evolutionary step for transportation, and a projectin keeping with <strong>California</strong>’s standards for environmental quality and economicgrowth. The Business <strong>Plan</strong> determined that the next project step is <strong>to</strong> initiate aformal environmental clearance process with the development of a <strong>State</strong>-levelprogram EIR.To implement the environmental process, the CHSRA prepared a Draft Program<strong>California</strong> Environmental Quality Act (CEQA) Environmental Impact Report(EIR) and a National Environmental Policy Act (NEPA) Tier 1 EnvironmentalImpact <strong>State</strong>ment (EIS). The CHSRA is the <strong>State</strong> lead agency for CEQA and theFRA is the Federal lead agency for NEPA. The draft program-level EIR/EIS wasreleased on January 27, 2004. After extensive review, the Final EIR/EIS wasposted on the Federal Register on September 23, 2005. On November 2, 2005, theAuthority certified the Final EIR/EIS.Based on the analysis, the CHSRA and the Federal <strong>Rail</strong>road Administration (FRA)have identified the high-speed train system as the preferred system alternative <strong>to</strong>meet <strong>California</strong>’s future intercity travel demand. Service <strong>to</strong> urban centers wouldbe on shared tracks with other passenger rail services at moderate speeds. Stationswould be in close proximity <strong>to</strong> most major airports, and there would be stationconnections with major transit hubs in metropolitan areas. The EIR/EIS identifiespreferred alignments, as follows:• Northern Mountain Crossing – a broad corridor containing a number offeasible route options have been identified for further study. The corridor isbounded by Pacheco Pass (SR-152) <strong>to</strong> the south, Altamont Pass (I-580) <strong>to</strong> thenorth, BNSF corridor <strong>to</strong> the east, and Caltrain <strong>to</strong> the west.• Southern Mountain Crossing – through the Techachapi Mountain Rangebetween Los Angeles and Bakersfield via a crossing through Palmdale and theAntelope Valley.• Bay Area – service on the Peninsula and in the East Bay.• Central Valley – Highway 99 corridor (mostly BNSF alignment).• San Diego – via I-215/ I-15 corridor <strong>to</strong> down<strong>to</strong>wn.• Orange County – Los Angeles <strong>to</strong> Orange County via Pacific Surfliner Route.The 2006-07 enacted state budget provided $14.3 million "<strong>to</strong> begin projectimplementation". The funding supported the preparation of a project financialplan, project management activities, identification of critical rights-of-wayacquisitions and the initiation of detailed project design and related environmentalstudies. However, bond funding for the project must still be authorized by voters.176
Chapter X – Potential New Services(AB 713 enacted in 2006, delayed the $10 billion high-speed rail bond measurefrom November 2006 <strong>to</strong> the November 20<strong>08</strong> ballot).Steps taken during 2006-07 <strong>to</strong> begin the implementation of the high-speed trainproject included the hiring of a project management team and five regional teamsfor the preparation of the preliminary engineering and the project-levelenvironmental work. Also a financial planning team was hired as was agraphics/visual simulation consultant.During 2006-07, the CHSRA and FRA have released two Notices of Preparation(NOP) and Notices of Intent (NOI) for the preparation of project-level EIR/EISdocuments for the Los Angeles <strong>to</strong> Palmdale and Los Angeles <strong>to</strong> Anaheimsegments of the proposed high-speed train system.In June <strong>2007</strong> the Authority and the Federal <strong>Rail</strong>road Administration (FRA)completed a Draft Program EIR/EIS <strong>to</strong> address the choice of a corridor/generalalignment and station locations in the San Francisco Bay Area <strong>to</strong> the CentralValley segment of the high-speed train system. The Draft Bay Area <strong>to</strong> CentralValley HST Program EIR/EIS document is now available <strong>to</strong> the public anduploaded <strong>to</strong> the HSRA website. The public comment period on this Draft EIR/EISis through September 28, <strong>2007</strong>.The next steps for the Authority are <strong>to</strong>:• Complete a project financial plan,• Continue preliminary engineering and design and project-level environmentalstudies,• Identify and preserve right of way.DESERTXPRESSDesertXpress is a proposed completely new high-speed, steel wheel on rail doubletrack interstate passenger rail line running 190 miles between Vic<strong>to</strong>rville,<strong>California</strong> and Las Vegas, Nevada. It would run primarily at-grade; but becompletely grade separated from all streets and highways, and would largelyfollow the I-15 freeway alignment. The estimated capital cost is $3.5 billion inprivate funding for design, construction, rolling s<strong>to</strong>ck, systems, testing andcommissioning, with construction taking up <strong>to</strong> four years following completion ofthe environmental review process. Revenues from fares and advertising areexpected <strong>to</strong> cover the on-going operating costs, including maintenance.The proposed service will make the trip nons<strong>to</strong>p at speeds of up <strong>to</strong> 125 miles perhour, for a one hour and 40 minute trip between Vic<strong>to</strong>rville and Las Vegas.Equipment would be proven European design steel wheel on rail trains, with eachcar self-propelled <strong>to</strong> provide the high power-<strong>to</strong>-weight ratio needed <strong>to</strong> follow theI-15 alignment and climb its relatively steep grades through two desert mountainpasses. Trains would operate as frequently as 20 <strong>to</strong> 30 minutes during peak177
<strong>2007</strong>-<strong>08</strong> – <strong>2017</strong>-<strong>18</strong> <strong>California</strong> <strong>State</strong> <strong>Rail</strong> <strong>Plan</strong>periods, and one <strong>to</strong> two hour intervals at other times. Ridership is projected at5.1 million passenger round-trips in the first year, based on an average $50 onewayfare. This ridership level represents 28 percent of the projected <strong>18</strong>.2 milliontrips between Southern <strong>California</strong> and Las Vegas. Much of the route would useproperty along the I-15 alignment that is owned by the federal Government andadministered by the Bureau of Land Management (BLM). Between Vic<strong>to</strong>rvilleand Bars<strong>to</strong>w, a passenger-exclusive alignment within existing railroad rights ofway is also being evaluated.The station at Vic<strong>to</strong>rville would be located along the west side of I-15 near theS<strong>to</strong>ddard Wells Road interchanges. The 50-acre train maintenance and s<strong>to</strong>ragefacility would be located near the Vic<strong>to</strong>rville station, and would include trains<strong>to</strong>rage tracks, the repair shop, a fueling station, the train washing facility, andparts s<strong>to</strong>rage as well as the operations control center and administrative offices.The Environmental Impact <strong>State</strong>ment (EIS) is evaluating three alternative LasVegas stations: at the south end of the Strip; in the middle of the Strip; anddown<strong>to</strong>wn Las Vegas; all with access <strong>to</strong> shuttles serving the resorts and the centralbusiness district, taxis and rental cars. Also, there is potential for a directconnection <strong>to</strong> the Las Vegas Monorail.In July 2006, DesertXpress petitioned the Federal Surface Transportation Board[Finance Docket No. 34914] <strong>to</strong> issue a Declara<strong>to</strong>ry Order finding that their project,the proposed construction of an interstate high speed passenger rail system, is notsubject <strong>to</strong> state and local environmental review and land use and other permittingrequirements because of the Federal preemption in 49 U.S.C. 10501(b). TheBoard issued the requested Declara<strong>to</strong>ry Order in June <strong>2007</strong>.The Federal <strong>Rail</strong>road Administration, as the lead agency, is currently preparing, ina coordinated, fast-track manner, a draft federal EIS with the CooperatingAgencies: the Surface Transportation Board, the Bureau of Land Management andthe Federal Highway Administration. DesertXpress Enterprises is privatelyfunding the EIS work under the federal third party contracting approach. Scopingmeetings were held in July 2006, <strong>to</strong> receive public input. Interagency workinggroups have been formed <strong>to</strong> receive input and <strong>to</strong> coordinate on design, right-ofwayand environmental elements of the project.In <strong>California</strong>, DesertXpress has reviewed their proposed project with theGovernor’s Office of <strong>Plan</strong>ning and Research, the Business, Transportation andHousing Authority, the <strong>California</strong> Transportation Commission, the <strong>California</strong>Department of Transportation, the San Bernardino Associated Governments,<strong>California</strong> Department of Fish and Game, the <strong>California</strong> High Speed <strong>Rail</strong>Authority, cities along the corridor, and other agencies as appropriate.178
Chapter X – Potential New ServicesFigure 10B179
<strong>2007</strong>-<strong>08</strong> – <strong>2017</strong>-<strong>18</strong> <strong>California</strong> <strong>State</strong> <strong>Rail</strong> <strong>Plan</strong>MAGNETIC LEVITATIONMaglev technology uses magnetic forces <strong>to</strong> lift, propel, and guide a vehicle over aguideway. Electric power and control systems eliminate contact between thevehicle and the guideway. In 1989, a 19.5-mile testing track was put in service inEmsland, Germany. The system is still in operation and carrying visi<strong>to</strong>rs.In 2002, a 19-mile Transrapid Maglev line was put in operations in Shanghai,China. The line connects Pudong International Airport with Shanghai subwaystation in the financial district. The Shanghai line has been operating at amaximum speed of 310 mph.Congress has provided planning grants <strong>to</strong> the Southern <strong>California</strong> and Nevadaprojects in FFYs 2001-2004. Nevada received additional funding in FFY 2005.In 2005, Congress authorized $90 million for Maglev deployment as part of thereauthorization of SAFETEA-LU, with $45 million of these funds authorized forthe pre-construction on the Las Vegas-Anaheim Maglev project, however no fundshave been appropriated <strong>to</strong> date.The two <strong>California</strong> projects that are discussed in more detail below still havesignificant hurdles <strong>to</strong> overcome. Their sponsors will need <strong>to</strong> complete engineeringwork and environmental documentation <strong>to</strong> further the initial concept design plans.A principal funding source remains <strong>to</strong> be identified. Coordination must continuewith the Department, railroad opera<strong>to</strong>rs, and local agencies along the corridor.SOUTHERN CALIFORNIA MAGLEV PROJECTThe initial 92-mile corridor study area of the Southern <strong>California</strong> Association ofGovernments (SCAG) High-Speed Regional Transport (HSRT) extends fromLos Angeles International Airport (LAX) via LAUS, east <strong>to</strong> Ontario InternationalAirport and on <strong>to</strong> March Inland Port in Riverside County. SCAG is the projectsponsor.By 2030, the population of Southern <strong>California</strong> is expected <strong>to</strong> grow from17 million <strong>to</strong> 23 million people. Demand at the region’s airports could increase <strong>to</strong>approximately 170 million annual passengers. Air cargo volume is expected <strong>to</strong>triple <strong>to</strong> nine million annual <strong>to</strong>ns. The prospect of these increases in population,employment and air travel demands led SCAG <strong>to</strong> adopt a high-speed intraregionalMaglev system connecting regional airports as part of a decentralizedAviation System <strong>Plan</strong> and <strong>to</strong> transport daily commuters. This <strong>Plan</strong> was adopted aspart of its Regional Transportation <strong>Plan</strong> in 1998.In 2000, the Southern <strong>California</strong> Maglev Deployment Project sponsors submitted aproject description <strong>to</strong> the Federal <strong>Rail</strong>road Administration (FRA) for funding.The grant application <strong>to</strong> the FRA described an intra-regional Maglev system, ofwhich the first line <strong>to</strong> be considered, was on the LAX <strong>to</strong> March Inland PortCorridor. Highlights of the project description are:<strong>18</strong>0
Chapter X – Potential New Services• The proposed system design was based upon Maglev technology developed bythe German consortium Transrapid. Recently, the choice of Maglev has beenplaced under review. An Alternatives Analysis is currently underway by aconsultant <strong>to</strong> compare steel wheel with Maglev technology on two routes in theInitial Operating Segment (IOS) for ridership, cost, speed, etc. This analysis isdue for completion by December 31, <strong>2007</strong>.• The proposed project serves a very dense corridor defined by the FederalGovernment as a Corridor of National Significance. By 2020, about2.5 million long distance trips would be made in the corridor.• In December 2002, the corridor was shortened by the SCAG Regional Council<strong>to</strong> an IOS that spanned 54-miles from West Los Angeles <strong>to</strong> the OntarioAirport. The IOS would serve approximately 130,000 riders per day. Traveltimesavings from one end of the line <strong>to</strong> the other was estimated <strong>to</strong> be33 minutes.• The IOS was estimated <strong>to</strong> cost about $8 billion (2006 dollars) <strong>to</strong> construct.Approximately 24 percent of this cost was for the system elements: vehicles,communications, propulsion, and operation control. The cost of the guidewaywas about 43 percent of the <strong>to</strong>tal cost. Stations, yards and shops, rights-of-way(ROW), and other civil works comprise the remainder of the project costs.With the FY 2001 Federal funding, SCAG performed additional studies on thisproject, including evaluation of the impacts of the project on use of highway andrailroad ROW, on Los Angeles Union Station (LAUS), and on the Metrolinkcommuter rail system. SCAG also completed further work in the areas oftechnology transfer agreements, cost and revenue projections, financial plan,public/private partnering agreements, environmental studies, and publicparticipation.In FFY 2001, SCAG received $877,000 in FRA funding. In FFY 2002, SCAGreceived $1.0 million in FRA funding for continued corridor planning activities.In FFY 2003, an additional $500,000 in FRA funding was provided <strong>to</strong> supportfurther planning studies. In FFY 2004, SCAG received an additional $1.0 millionin FRA funding.In addition <strong>to</strong> the project described above, SCAG has undertaken three additionalMaglev/high-speed rail feasibility studies along other heavily congested corridors.They are: 1) Los Angeles <strong>to</strong> Palmdale in Antelope Valley, along the SR-14 and I-5or I-405 freeway corridors; 2) LAX <strong>to</strong> south Orange County, along the I-405Freeway; and 3) the Orangeline from down<strong>to</strong>wn Los Angeles <strong>to</strong> central OrangeCounty following the former Pacific Electric <strong>Rail</strong>way corridor. This corridor isnot under the jurisdiction of SCAG but the Orangeline Development Authority(OLDA) Joint Powers Authority (JPA).<strong>18</strong>1
<strong>2007</strong>-<strong>08</strong> – <strong>2017</strong>-<strong>18</strong> <strong>California</strong> <strong>State</strong> <strong>Rail</strong> <strong>Plan</strong>From these studies, SCAG has concluded that the Maglev/high-speed rail projectshave the potential <strong>to</strong> be self-funded through a public-private partnership, where thepublic sec<strong>to</strong>r will donate land and the private sec<strong>to</strong>r will construct and operate thesystem. Additionally, innovative funding strategies, such as FederalTransportation Infrastructure Finance and Innovation Act (TIFIA) loans andprivate investment bonds can be used <strong>to</strong> finance this project.LAS VEGAS-ANAHEIM MAGLEV PROJECTThe <strong>California</strong>-Nevada Super Speed Train Commission (CNSSTC) was formed in1988 <strong>to</strong> promote the development of a 269-mile maglev system connectingLas Vegas with Anaheim. The CNSSTC and its private sec<strong>to</strong>r partner, AmericanMagline Group, for its FRA application in 2000, proposed a 40-mile segment fromLas Vegas <strong>to</strong> Primm, on the <strong>California</strong> border. A short segment of the project waschosen because of the difficulty in raising funds for the entire 269-mile project.The route travels between two fast-growing and heavily populated regions of theU.S. The project would have a <strong>to</strong>tal of five segments: Las Vegas <strong>to</strong> Primm,Primm <strong>to</strong> Bars<strong>to</strong>w, Bars<strong>to</strong>w <strong>to</strong> Vic<strong>to</strong>rville, Vic<strong>to</strong>rville <strong>to</strong> Ontario, and Ontario <strong>to</strong>Anaheim. There would be s<strong>to</strong>ps at each of the endpoints of the segments, for a<strong>to</strong>tal of at least six s<strong>to</strong>ps. A key advantage of the system is the alignment providedby the Interstate Highway 15 ROW. If available, this alignment would minimizethe need for property acquisition and provides the least complicated constructionscenario possible.To date the project has received a <strong>to</strong>tal of $9.0 million in Federal funding fromFY 1999 through FY 2005: $1.4 million in FY 1999; $2.0 million in FY 2000;$900,000 million in FY 2001; $1.2 million in FY 2002; $1.5 million inFY 2003; $1.0 million in FY 2004; and $1.0 million in FY 2005. Also,$45 million is authorized in SAFETEA-LU for the next five years; however, nofunds have been appropriated <strong>to</strong> date.The CNSSTC has done a number of studies <strong>to</strong> date. They prepared and submitted<strong>to</strong> USDOT a Project Description Report on the Las Vegas <strong>to</strong> Primm segment in2000. Next the CNSSTC produced the Las Vegas-Primm/Bars<strong>to</strong>w SupplementalProject Description in August 2002. That report presents projected physicalinfrastructure, ridership, costs, benefits, and related information for the extendedsegment from Las Vegas <strong>to</strong> Bars<strong>to</strong>w via Primm. The report estimated capital costsfor the segment in 2000 dollars <strong>to</strong> be $5.65 billion.In May 2004, the FRA agreed <strong>to</strong> prepare a Programmatic Environmental Impact<strong>State</strong>ment (PEIS) for the project, in cooperation with the Nevada Department ofTransportation. The PEIS will cover the entire corridor between Las Vegas andAnaheim, and will include a site-specific construction level ProgramEnvironmental Impact Report (PEIR) for the Las Vegas <strong>to</strong> Primm, Nevadasegment. As part of the PEIS, five public meetings were held in June 2004 in key<strong>18</strong>2
Chapter X – Potential New Servicescities along the route. The CNSSTC has also prepared a preliminary report thatsummarizes the results of the public meetings, a purpose and needs statement, anda work plan. The PEIS/REIR is expected <strong>to</strong> be completed within three years.The Department will be the lead agency <strong>to</strong> review environmental documents underCEQA. However, the current PEIS does not trigger CEQA review as it is notconsidered a “project” under CEQA definition. Only site-specific environmentalwork on corridor segments in <strong>California</strong> will trigger CEQA.<strong>18</strong>3
<strong>2007</strong>-<strong>08</strong> – <strong>2017</strong>-<strong>18</strong> <strong>California</strong> <strong>State</strong> <strong>Rail</strong> <strong>Plan</strong><strong>18</strong>4
Chapter XI – AmtrakCHAPTER XIAMTRAKThis chapter provides information on: Amtrak’s relationship with the Departmentand with the CCJPA, key Amtrak planning initiatives, and recent Amtrak reformproposals and budget.AMTRAK’S RELATIONSHIP WITH THE DEPARTMENT ANDTHE CAPITOL CORRIDOR JOINT POWERS AUTHORITYThe Department provides operating funding for three intercity rail passengerservices, the Pacific Surfliners, San Joaquins, and the Capi<strong>to</strong>l Corridor.Amtrak operates all three services under the provisions of Section 24101(c)(2) ofthe Federal <strong>Rail</strong> Passenger Service Act. That Section authorizes Amtrak <strong>to</strong>operate intercity rail passenger service beyond its basic system services whenrequested <strong>to</strong> do so by a state, group of states, or a regional or local agency.The Department directly administers the Pacific Surfliners and San Joaquins.(Amtrak funds 30 percent of the Pacific Surfliner service as part of its basicsystem, and the <strong>State</strong> pays for the remaining 70 percent of this service.)The Capi<strong>to</strong>l Corridor Joint Powers Authority (CCJPA) administers theCapi<strong>to</strong>l Corridor service under a 1998 interagency transfer agreement withthe <strong>State</strong>.In the past, Amtrak provided significant fiscal support <strong>to</strong> state-supported routes.Then, over time, the share of service costs (called cost basis) that Amtrak requiredstates <strong>to</strong> pay increased significantly. Between FFY 1992 and FFY 1999, the costbasis increased each year. Starting in FFY 1999, the <strong>State</strong> paid 100 percent of allvariable costs and Amtrak covered all fixed costs. Since then, the cost basis hasremained fairly constant. Starting in FFY 2000, the CCJPA entered in<strong>to</strong> fixedprice-operating contracts with Amtrak for the Capi<strong>to</strong>l Corridor service.In the fall of 2002, Amtrak modified the cost allocation principle slightly <strong>to</strong>recovery of “direct costs” which include all train related costs and a portion ofshared costs, but excludes system overhead, interest and depreciation. Costs onthis basis actually decreased slightly on the Pacific Surfliners for the same level ofservice, primarily because the <strong>State</strong> is no longer charged equipment capital costsfor the use of Amtrak owned equipment. <strong>State</strong> contract costs have been constantfor the five years from 2002-03 through 2006-07. <strong>State</strong> operating costs have neverbeen constant for such a long period of time in the his<strong>to</strong>ry of <strong>State</strong>-supportedservice. However, <strong>State</strong> costs in <strong>2007</strong>-20<strong>08</strong> will increase by $6.6 million.The Department pays the entire net operating loss of the feeder buses that servethe <strong>State</strong>-supported routes. The operating loss consists of the entire bus operatingcosts (as billed by the contract bus opera<strong>to</strong>r) minus the feeder bus revenue credits.<strong>18</strong>5
<strong>2007</strong>-<strong>08</strong> – <strong>2017</strong>-<strong>18</strong> <strong>California</strong> <strong>State</strong> <strong>Rail</strong> <strong>Plan</strong>The bus revenue credits represent a proportional share of the passenger’s entirerail-bus fare assigned <strong>to</strong> the bus portion of the trip.Amtrak, in operating service for the <strong>State</strong> or the CCJPA, performs many functions.Amtrak employees function as train crews and staff stations with ticket offices.The equipment (whether owned by Amtrak or the Department) is maintained byAmtrak staff at Amtrak operated facilities in Oakland and Los Angeles.Amtrak staff at these locations, and <strong>to</strong> a lesser degree in Washing<strong>to</strong>n D.C. andPhiladelphia, also performs administrative and other functions related <strong>to</strong> <strong>California</strong><strong>State</strong>-supported service.Amtrak maintains control over many operational functions related <strong>to</strong><strong>State</strong>-supported service. For example, Amtrak administers fare policy inaccordance with its national goal <strong>to</strong> maximize revenues. However, theDepartment approves or disapproves fare changes, as provided in its contract withAmtrak. In addition, the Department and the CCJPA work with Amtrak <strong>to</strong>develop special <strong>California</strong> or route-specific promotions. Amtrak also has nationalservice requirements and standards that it maintains. The Department has beensuccessful in working with Amtrak <strong>to</strong> adapt some of these policies (such as foodservice) <strong>to</strong> specific <strong>California</strong> conditions.AMTRAK PLANNINGBelow two Amtrak planning documents are discussed. The Amtrak StrategicReform Initiative and FY 06 Grant Request focuses on reform actions andpotential revitalization of the U.S. passenger rail service. The Strategic Business<strong>Plan</strong> focuses on capital investment and operating plans.AMTRAK STRATEGIC REFORM INITIATIVE AND FY 06 GRANTREQUESTIn April 2005, Amtrak released its Amtrak Strategic Reform Initiatives andFY 06 Grant Request. This document included comprehensive reform initiativesthe railroad is undertaking as corporate actions and others it intends <strong>to</strong> pursue inlegislative actions <strong>to</strong> “revitalize U.S. passenger rail service.” The document alsoincluded the FY 06 grant request of $1.82 billion for capital investment programsand operations.Amtrak stated that the initiatives have four fundamental long-term objectives:• Development of passenger rail corridors utilizing a Federal/state matchingapproach common <strong>to</strong> all other modes (generally 80/20). <strong>State</strong>s, notAmtrak, would lead the development of the corridors, a number of whichhave already been federally designated. Ultimately, Amtrak would be oneof the competitive bidders for functions or for entire services.• Return of the Northeast Corridor infrastructure <strong>to</strong> a state-of-good-repair andoperational reliability, with phased-in financial responsibility for capital<strong>18</strong>6
Chapter XI – Amtrakand operating costs assumed on a proportionate basis by all users, includingAmtrak, freight and commuter railroads.• Establishment of phased-in financial performance thresholds for Amtrak’sexisting 15 long-distance trains and any future similar proposed service.Amtrak initiated a series of actions <strong>to</strong> improve the financial performance ofthese trains. Services falling below the thresholds could be continuedthrough support by state or other authorities, reconfigured or eliminated.• Creation of markets for competition, private commercial participation andindustrial reforms in various rail functions. This includes competitionamong opera<strong>to</strong>rs, including Amtrak, for new corridor routes.For <strong>California</strong> there are a number of important initiatives included in thedocument. First, the recommendation for a Federal 80 percent/state 20 percentcapital match program for state rail capital investment is key <strong>to</strong> allowing<strong>California</strong> <strong>to</strong> leverage <strong>State</strong> funds with Federal funds <strong>to</strong> continue <strong>to</strong> makeimprovements <strong>to</strong> the intercity rail system. Second, the reform initiatives call forother opera<strong>to</strong>rs <strong>to</strong> be able <strong>to</strong> compete for elements of service (e.g., food serviceand mechanical services), and ultimately with Amtrak for operation of routes.Qualified competi<strong>to</strong>rs could potentially receive the rights <strong>to</strong> private railroad trackat incremental costs, assuming legislative changes contained in the proposal, andaccess <strong>to</strong> Amtrak rolling s<strong>to</strong>ck. As part of the proposal, Amtrak would phase outany operating support for <strong>State</strong>-supported Routes by FY 2011. This may result inadditional costs <strong>to</strong> <strong>California</strong>.AMTRAK’S 2004 STRATEGIC BUSINESS PLANIn June 2004, Amtrak released its Amtrak Strategic <strong>Plan</strong> FY 2005-2009, which isa strategic capital investment and operating plan that updates the plan released in2003. Amtrak is now updating the Strategic <strong>Plan</strong> and expects <strong>to</strong> release it inMarch, 20<strong>08</strong>.Amtrak’s Strategic <strong>Plan</strong> FY 2005-2009 aims <strong>to</strong> res<strong>to</strong>re Amtrak’s physical plantand train equipment <strong>to</strong> a state-of-good-repair and improve the railroad’soperational reliability. The <strong>Plan</strong> identifies four strategies: (1) maintain the focuson stabilizing the railroad; (2) continue <strong>to</strong> ramp-up the capital program;(3) continue the emphasis on operating efficiencies through improved fleetutilization, better service design, and increased productivity; and (4) encourageinvestment in improved service, including corridor development. The <strong>Plan</strong> isbased on investments in existing infrastructure and equipment, and proposes nonew significant passenger services – focusing instead on improving the reliabilityand cost-efficiency of the passenger railroad’s existing services.The <strong>Plan</strong> outlines the progress made in FFY 2003-04, including establishing atransparent financial reporting system, implementing zero-based budgeting,imposing strict headcount control measures, focusing on day-<strong>to</strong>-day passenger<strong>18</strong>7
<strong>2007</strong>-<strong>08</strong> – <strong>2017</strong>-<strong>18</strong> <strong>California</strong> <strong>State</strong> <strong>Rail</strong> <strong>Plan</strong>operations, and on maintenance of plant and equipment. The <strong>Plan</strong> continues thesemeasures for the next five years. Challenges that Amtrak faced in FFY 2003-04which are likely <strong>to</strong> continue include: 1) continuing deterioration in host railroads’capacity and infrastructure, and 2) failures and delays attributed <strong>to</strong> deferredinvestment in and reconstruction of Amtrak’s plant and equipment.To support the existing system, the five-year Strategic <strong>Plan</strong> calls for Federalfunding averaging about $1.6 billion per year. The plan holds the line on Federalsupport for operating purposes each year at $570 million. The majority of Federalsupport is for capital improvements <strong>to</strong> the existing system and <strong>to</strong> bring facilitiesand equipment up <strong>to</strong> a state-of-good-repair. The <strong>Plan</strong> reiterates current Federalpolicy that Amtrak not initiate new train services unless the state or states servedpays the full operating loss. Amtrak continues <strong>to</strong> seek full state funding for“direct” operating losses on existing state-supported trains.<strong>California</strong> Capital FundingAlthough the <strong>Plan</strong> is primarily directed <strong>to</strong> preserve and improve Amtrak-ownedassets in the Northeast Corridor, it also proposes funding for several projects in<strong>California</strong>. It includes $90.1 million for projects which impact <strong>California</strong>, ofwhich $41.5 million is for projects wholly in <strong>California</strong> and $48.6 million is formulti-state projects that partially impact <strong>California</strong>. Key projects in <strong>California</strong>include: Phase II of the new maintenance facility in Oakland that was completedin September 2004 and fully operational in December 2004; overhauls ofPacific Surfliner equipment; and basic repairs of Amtrak-owned equipmentmaintenance facilities in Los Angeles. The actual level of funding for the projectsis dependent on Congressional appropriations during the period of the <strong>Plan</strong>.Figure 11A lists the <strong>California</strong> related projects included in the AmtrakStrategic <strong>Plan</strong>.<strong>18</strong>8
Chapter XI – AmtrakFigure 11AAmtrak Five-Year Strategic <strong>Plan</strong> - Capital Projects – FFY 2005-09<strong>California</strong> ProjectsSummary of Project ScopeAmtrakFunding(000)Los Angeles Yard – NewEquipmentReplace electric carts and shop equipment $ 50Surfliner Equipment – Replace most parts due for renewal, along with someOverhaulsupgrades and structural repairs10,600Los Angeles Yard Install roof for commissary and material control building,Improvementswheel truing machine, sand <strong>to</strong>wer and industrial waste line2,400Service & Inspection Replace specialty <strong>to</strong>ols, equipment, etc. for LA and OAKFacilities Running Repair S&I Facilities7,500Los Angeles Yard Track Construct tracks <strong>to</strong> connect <strong>to</strong> 9 th Street 250Los Angeles UnionStation ImprovementsInstall tactile warning tiles on Tracks 10,11,12 350Oakland MaintenanceFacility Phase IIConstruction of Commissary and Welfare facilities 14,000Oakland MaintenanceFacility YardDemolish existing infrastructure in UP Yard 300Emeryville StationLease/PurchaseProvide funds for lease/purchase of the station 400Extension of PacificConstruct 1.8 miles of second mainline track, includingSurfliner Double-track –Centralized Traffic Control (CTC)CP Flores <strong>to</strong> CP O’Neal1,250San Diego – NewLayover and LightMaintenance FacilityParticipate in the construction of a multi-s<strong>to</strong>ry building, ofwhich the first floor is <strong>to</strong> be used by Amtrak and Caltrans <strong>to</strong>s<strong>to</strong>re equipment and materials needed for rolling s<strong>to</strong>ckmaintenanceOakland – Station and Construct station track, platform, and control pointPlatform Improvements improvements680Rocklin Station Construct improvements <strong>to</strong> meet ADA Requirements 250Capi<strong>to</strong>l CorridorInstall Closed Circuit Television in 8 stations along Capi<strong>to</strong>lCorridor300San Joaquin RouteInstall Closed Circuit Television in 8 stations along SanJoaquin Route300Salinas Station Reconstruct Salinas Platform 2,525<strong>California</strong> Projects Total $ 41,505Multi-<strong>State</strong> Projects<strong>Rail</strong> Replacement andRehabilitation – Pacificand Southwest DivisionsSuperliner II Equipment –OverhaulsSuperliner I Equipment –OverhaulsF59PHI DieselLocomotive OverhaulsWestern DivisionPollution PreventionReplace and rehabilitate rail, wood ties, and turnouts $ 6,400Replace most parts due for renewal, along with someupgrades and structural repairs35021,200Modify or remanufacture existing equipment 13,600Replace most parts due for renewal, along with someupgrades and structural repairs5,200Construct pollution prevention upgrades and improvements 2,220Multi-<strong>State</strong> Projects Total $ 48,620GRAND TOTAL $ 90,125<strong>18</strong>9
<strong>2007</strong>-<strong>08</strong> – <strong>2017</strong>-<strong>18</strong> <strong>California</strong> <strong>State</strong> <strong>Rail</strong> <strong>Plan</strong><strong>California</strong> Corridors Highlighted in <strong>State</strong> Corridor InitiativesThe Amtrak 2004 Strategic <strong>Plan</strong> also includes an Appendix called the <strong>State</strong>Corridor Initiatives. It focuses on state proposals supported by Amtrak for specificpassenger rail corridor development, and strategies <strong>to</strong> protect and upgrade keyfacilities owned by freight railroads. Amtrak supports use of a 80 percent federal20 percent state grant program for corridors that qualify under the Initiative.Amtrak surveyed all states and identified those corridors that complied withAmtrak’s criteria. The criteria includes a long-term master plan, market revenueand operating expense forecasts, infrastructure and equipment investment plans,host railroad acceptance, agreement <strong>to</strong> fund a 20 percent capital match, andagreement <strong>to</strong> cover any added operating deficit. Amtrak worked with states <strong>to</strong>clearly identify the corridors, the congestion and capacity challenges and capitalinvestment needs. Three of the eight corridors that qualified for the <strong>State</strong> CorridorInitiatives were in <strong>California</strong>. They were the three <strong>State</strong>-supported corridors(Pacific Surfliner, San Joaquin, and Capi<strong>to</strong>l Corridor).However, it should be recognized that major funding for the Corridor Initiativeswould come from a federal grant program, which <strong>to</strong> date has not been established.See the discussion of the FFY 20<strong>08</strong> Budget below for further information on aproposed grant program in S 294.AMTRAK REFORM AND BUDGETFor a number of years Amtrak’s future and budget levels have been hotly debatedin Washing<strong>to</strong>n D.C. According <strong>to</strong> the Congressional Budget Office September2003 study The Past and Future of U.S. Passenger <strong>Rail</strong> Service “more than threedecades after the Congress and the President created the National <strong>Rail</strong>roadPassenger Corporation, Federal policies <strong>to</strong>ward intercity passenger rail serviceremain unsettled. Policymakers have not been able <strong>to</strong> agree about whether thecompany should be a private, for-profit enterprise (like airlines and intercity buscompanies) or a public service (like urban mass transit) that would usegovernment subsidies <strong>to</strong> achieve social objectives.” This discussion continues<strong>to</strong>day with no resolution.FFY 2006 BUDGET AND LEGISLATIVE REFORM PROPOSALIn 2004, Congress was primarily engaged in reauthorizing surface transportationprograms and discussions on the future of Amtrak and intercity rail <strong>to</strong>ok a backseat. Amtrak’s FY 2005-2009 Strategic <strong>Plan</strong> called for an annual Federalappropriations level of $1.6 billion, which would allow Amtrak <strong>to</strong> make progresson its goal <strong>to</strong>ward achieving a state-of-good-repair. Amtrak initially requested$1.8 billion from Congress for FFY 2005, but revised it downward <strong>to</strong> $1.5 billionbased on the ability <strong>to</strong> advance a number of capital projects. In November 2004,Congress appropriated $1.2 billion for FFY 2005 funding, which included a$20 million portion of a five-year repayment for the FFY 2002 loan of190
Chapter XI – Amtrak$100 million. Amtrak was able <strong>to</strong> operate throughout FFY 2005 within thisappropriation level by drawing down on its working capital reserves.FFY 2006 BUDGET AND LEGISLATIVE REFORM PROPOSALSThe Administration opened the FFY 2006 Amtrak budget deliberations in Aprilwith a proposal that was identical <strong>to</strong> the “Passenger <strong>Rail</strong> Investment Reform Ac<strong>to</strong>f 2003” and proposed zero funding for Amtrak unless reforms were instituted.This proposal was introduced as H.R. 1713 in April 2005. Amtrak’s FY 2006proposal was contained in their Amtrak Strategic Reform Initiatives and FY 06Grant Request discussed above. The requested funding level was $1.82 billion.A bi-partisan bill introduced by Sena<strong>to</strong>rs Lautenberg and Lott (S. 1516) wasintroduced in July 2005 that averaged about $1.9 billion in funding over thesix years of the bill’s reauthorization. S.1516 passed the Senate 93-6, althoughcompanion House legislation was not introduced, nor was a funding mechanismidentified.In June, the full House approved an Amtrak appropriations level of $1.2 billion,and in July the Senate Appropriations Committee approved a $1.45 billionappropriations level. In late November, the President signed “The Transportationand Related Agencies Appropriations Bill” for FFY 06. It included $1.315 billionin funding for Amtrak, including $780 million for capital projects with$280 million maximum for debt service, $495 million for operations, and$40 million for efficiency incentive grants.FFY <strong>2007</strong> BUDGET AND LEGISLATIVE REFORM PROPOSALSFor FY07, the Administration proposed $900 million for Amtrak, compared withAmtrak’s requested base appropriation of $1.598 billion ($730 million Capital;$498 million Operating; $295 million Debt Service; $75 million Working Capital).Amtrak also requested was $275 million in “Strategic Investment Options”($100 million debt restructuring; $50 million Network Reliability; $100 million<strong>State</strong> capital matching; $25 million station ADA Compliance). For FY 07, theHouse approved $1.114 billion; the Senate $1.4 billion. Amtrak’s final FY07appropriation was $1.294 billion, with nothing appropriated for any of theStrategic Investment Options. Included in the FY 07 appropriation was theexpectation that Amtrak would undertake several actions <strong>to</strong> reduce operatingcosts, such as altering the delivery of food, beverage, and sleeping car service;explore options for selectively outsourcing certain functions; eliminating heavilydiscounting tickets for riders other than those in the armed forces; and modifyingits procurement processes, among other actions.191
<strong>2007</strong>-<strong>08</strong> – <strong>2017</strong>-<strong>18</strong> <strong>California</strong> <strong>State</strong> <strong>Rail</strong> <strong>Plan</strong>FFY 20<strong>08</strong> BUDGET AND LEGISLATIVE REFORM PROPOSALSFor FY <strong>08</strong>, the fundamentally challenging dynamics of properly funding railremain. Amtrak has requested a base appropriation of $1.53 billion ($498 millionOperations; $760 million capital; $285 million debt service), along with anadditional $150 million in Strategic Investment Needs ($100 million state capitalmatching; $50 million Station ADA compliance). The administration hasproposed $800 million for Amtrak, along with $100 million for state capitalmatching. As of this writing, the House has approved $1.4 billion for Amtrakalong with $50 million for state capital matching. The full Senate has not yetacted, but the Senate Appropriations Subcommittee on Transportation approved$1.37 billion for Amtrak, along with an additional $100 million for state capitalmatching.Earlier this year, Sena<strong>to</strong>rs Lautenberg and Lott introduced the Passenger <strong>Rail</strong>Investment and Improvement Act of <strong>2007</strong> (S.294), which is essentially the samelegislation that was introduced previously as S.1516. Among other items, S.294provides a six-year funding framework for Amtrak’s operating and capital needs.Over the life of the legislation, Amtrak’s operating grants are reduced by 40%, butits capital allocations increase dramatically. Additionally, S.294 provides$1.4 billion in state capital grants at an 80/20 level over a six-year period, alongwith other provisions including changes <strong>to</strong> the composition of Amtrak’s Board ofDirec<strong>to</strong>rs. At this point, companion legislation has not been introduced in theHouse, nor has a funding mechanism been identified.192
Chapter XII – Intercity <strong>Rail</strong> FundingCHAPTER XIIINTERCITY RAIL FUNDINGFunding for intercity rail systems comes primarily from state sources, but alsoincludes local, federal, Amtrak, and railroad funding sources. Below is anoverview of these funding sources.PUBLIC TRANSPORTATION ACCOUNTThe Public Transportation Account (PTA) is the exclusive source of intercity railoperating funds and a potential source of intercity rail capital funds. Proposition116 designated the PTA as a trust fund <strong>to</strong> be used “only for transportationplanning and mass transportation purposes.” (Public Utilities Code Section99310.5)PUBLIC TRANSPORTATION ACCOUNT FUNDING SOURCESThere are five main statu<strong>to</strong>ry sources of funds for the PTA: state sales tax ondiesel fuel, retail sales tax on gasoline from the Transportation Investment Fund(TIF), gasoline spillover (when available), sales tax on nine cents of the gas(excise) tax, and <strong>State</strong> Highway Account (SHA) transfer of non-Article XIXrevenues. In 2005-06, <strong>to</strong>tal PTA revenue from these sources was $571 million.• Sales Tax on Diesel Fuel – The 4.75 percent portion of the 7.25 percentstate sales tax on diesel fuel, which in 2005-06 was $287 million.• Sales Tax on Gasoline – The five percent portion of the 7.25 percent statesales tax on gasoline. In 2005-06, the first year of the TIF transfer <strong>to</strong> thePTA, the amount was $136 million.• Sales Tax on Gasoline (Spillover) – Based on the statu<strong>to</strong>ry formula,gasoline spillover is available when revenues from the gasoline sales tax atthe 4.75 rate exceed revenues from all taxable sales at the 0.25 percent rate,shifting revenues <strong>to</strong> the PTA when gas prices increase faster than overallretail sales. This source was initiated when the sales tax on gasoline wasestablished in 1972. Although in past years spillover transfers occurredrarely there have been spillover transfers for the last five fiscal years. TheLegislature and the Governor have often directed these revenues, in wholeor in part, for purposes other than those usually funded from the PTA <strong>to</strong>meet other state funding priorities. For example, in 2005-06, the spilloverwas $381 million, but the full amount was retained by the General Fund.• Sales Tax on a Portion of the Excise Tax on Gasoline (Proposition 111)A portion equal <strong>to</strong> 4.75 percent on nine cents of the state’s <strong>18</strong> cent pergallon excise tax on gasoline goes <strong>to</strong> PTA. In 2005-06 this source was$67 million.193
<strong>2007</strong>-<strong>08</strong> – <strong>2017</strong>-<strong>18</strong> <strong>California</strong> <strong>State</strong> <strong>Rail</strong> <strong>Plan</strong>• SHA Non-Article XIX Revenues – The TCRP Program (Chapter 91,Statutes of 2000) authorized the annual transfer, starting in 2001-02, of allArticle XIX unrestricted SHA revenues from the SHA <strong>to</strong> the PTA.These revenues are derived from the sale of documents, charges formiscellaneous services <strong>to</strong> the public, rental of state property, etc.In 2005-06 this source was $81 million.• Traffic Congestion Relief Program (TCRP)/Proposition 42 Funding –The TCRP, established by Chapter 91, Statutes of 2000 (AB 2928,Torlakson), was intended <strong>to</strong> provide funding for 141 transportation projectsand <strong>to</strong> the PTA from 2001-02 through 2005-06. These projects were <strong>to</strong>relieve congestion, connect transportation systems, and provide for bettergoods movement. The major new source of funding was the shifting ofgasoline sales tax revenues from the General Fund <strong>to</strong> the newly createdTIF. The first call on TIF distributions was <strong>to</strong> fund annual TrafficCongestion Relief Fund (TCRF) transfers, and then 20 percent of theremaining balance would be transferred <strong>to</strong> the PTA. The state experienceda fiscal crisis soon after the TCRP was enacted. Chapter 112, Statutes of2001 (AB 438) delayed the transfer of sales tax revenues <strong>to</strong> the TIF,beginning in 2003-04 and continuing through <strong>2007</strong>-<strong>08</strong>; however, theseamounts were fully repaid by 2006-<strong>2007</strong>.In March 2002, Proposition 42 added Article XIX B <strong>to</strong> the <strong>California</strong>Constitution that eliminated the original sunset date for the TIF and delayedTCRP funding from 2003-04 through <strong>2007</strong>-<strong>08</strong>. Proposition 42 madepermanent, beginning in 20<strong>08</strong>-09, the transfer of gasoline sales tax revenue<strong>to</strong> the TIF on a formula basis: 20 percent of the transfers will go <strong>to</strong> thePTA, with one-half of this amount for STIP projects and one-half <strong>to</strong> <strong>State</strong>Transit Assistance (STA) for transit; 40 percent <strong>to</strong> the TIF for STIPprojects; and 40 percent for subventions <strong>to</strong> cities and counties for localstreets and roads. Fiscal year <strong>2007</strong>-<strong>08</strong> is the last year of statu<strong>to</strong>ry transfersof Proposition 42 funding <strong>to</strong> the TCRF. Beginning in 20<strong>08</strong>-09, no furtherfunds will go <strong>to</strong> TCRP projects, thus increasing formula funds <strong>to</strong> the PTA,STIP, and local streets and roads. In 2003-04 and 2004-05, the transferswere suspended; however, these were repaid in 2006-07 (per Proposition1A) by the transfer of $1.415 billion <strong>to</strong> the Transportation DeferredInvestment Fund (TDIF) and the commitment <strong>to</strong> pay $83 million per yearfor nine years <strong>to</strong> the TCRP.REPAYMENT OF THE PTAThe statutes (AB 1751, Chapter 224, Statutes of 2003) and (AB 687, Chapter 91,Statutes of 2004) specified that the TIF suspensions in 2003-04 and 2004-05 wereloans that were required <strong>to</strong> be repaid from the General Fund via TransportationDeferred Investment Fund (TDIF) by 20<strong>08</strong>-09. In July 2006, the General Fund194
Chapter XII – Intercity <strong>Rail</strong> Fundingrepaid these previously suspended TIF transfers with $214 million going <strong>to</strong> thePTA.Additionally, a <strong>to</strong>tal of $275 million ($<strong>18</strong>0 million in 2001-02 and $95 million in2002-03) was loaned from the PTA <strong>to</strong> the Traffic Congestion Relief Fund (TCRF)and is scheduled <strong>to</strong> be repaid by June 30, 20<strong>08</strong>. In 2004, the Governor negotiatedTribal-<strong>State</strong> Gaming compacts with five tribes that would secure revenues forbonds <strong>to</strong> repay General Fund debt, including $275 million <strong>to</strong> PTA. Due <strong>to</strong>pending litigation on these bonds, it is uncertain when these bonds will be sold.In June <strong>2007</strong>, the PTA did receive a loan repayment of $10 million from TribalGaming Revenues as a partial TCRF loan repayment.USE OF PTA FUNDSThe Public Utilities Code (Sections 99312 et seq.) governs the uses of PTA funds.Fifty percent of these revenues go <strong>to</strong> the <strong>State</strong> Transit Assistance (STA) Program,which assists local entities in funding transit services. The remaining monies areavailable <strong>to</strong> fund a number of state programs including: intercity rail operations;high-speed rail, mass transportation, planning staff support; and mass transitcapital projects.In the past, PTA funding had not been used for capital projects, but for the firsttime, the 2001-02 Budget included $91 million in PTA funds specified forintercity rail capital projects. Proposition 42 now requires that PTA funds beincluded in the <strong>State</strong> Transportation Improvement Program (STIP). Thus, theSTIP includes PTA funds, subject <strong>to</strong> availability.STATE HIGHWAY ACCOUNTThe bulk of SHA funding supports the state’s highway system, but a portion of theaccount also supports rail projects in the STIP. The SHA receives its funds fromstate gasoline and diesel fuel taxes, state vehicle weight fees and reimbursementsfrom the Federal Trust Fund for Federal-aid projects. Use of the state-generatedportion of the SHA is governed by Article XIX of the <strong>State</strong> Constitution thatallows the funds <strong>to</strong> be used for research, planning, construction, improvement,maintenance, and operation of public streets and highways. Additionally, the SHAcan be used for the research, planning, construction, and improvement of publicmass transit guide ways (which includes intercity, commuter and urban rail, andelectric trolley bus services) and their fixed facilities. The SHA can not be usedfor mass transit vehicle acquisition or maintenance, or mass transit operating costs.The 1989 Blueprint Legislation allowed intercity rail projects <strong>to</strong> compete for SHAfunds in the STIP. Chapter 622, Statutes of 1997 (SB 45 - Kopp), reserved forintercity rail and grade separation projects a minimum of nine percent of theInterregional portion of the STIP as part of the Interregional TransportationImprovement Program (ITIP). SB 45 also allowed intercity rail projects <strong>to</strong> be195
<strong>2007</strong>-<strong>08</strong> – <strong>2017</strong>-<strong>18</strong> <strong>California</strong> <strong>State</strong> <strong>Rail</strong> <strong>Plan</strong>programmed in the Regional Transportation Improvement Program (RTIP).As a result, in the 1996 STIP, 1998 STIP, the 1998 STIP Augmentation, the 2000STIP, the 2002 STIP and the 2006 STIP and STIP Augmentation (due <strong>to</strong> severefunding constraints the 2004 STIP did not program any new funding for intercityrail projects) a <strong>to</strong>tal of $567 million was programmed. Of this amount$402 million has been allocated.TRAFFIC CONGESTION RELIEF FUNDChapter 91, Statutes of 2000 (AB 2928 - Torlakson), established the TrafficCongestion Relief Program (TCRP) <strong>to</strong> be funded from the Traffic CongestionRelief Fund (TCRF). The TCRP specified a list of projects <strong>to</strong> be funded,including over $200 million for specific intercity rail capital projects. To dateabout $150 million in projects have been allocated. Thus the constrained programincludes $50 million in unallocated TCRP funds.PROPOSITION 1B – HIGHWAY SAFETY, TRAFFICREDUCTION, AIR QUALITY AND PORT SECURITY BONDACT OF 2006Proposition 1B, or the Highway Safety, Traffic Reduction, Air Quality and PortSecurity Bond Act, was approved by the voters in November 2006 and authorizedthe issuance of $19.925 billion in the state general obligation bonds for specifiedtransportation purposes, including transit and passenger rail improvements,highway-railroad grade separation and crossing improvement projects.Several sections of Proposition 1B directly impact the Intercity <strong>Rail</strong> Program.They include:• The Public Transportation Modernization, Improvement and ServiceEnhancement Account - This is the only portion of the bonds which arespecifically reserved for intercity rail projects. It makes $400 millionavailable for intercity rail improvements of which $125 is reserved forintercity rail equipment. The Budget Act of <strong>2007</strong>-<strong>08</strong> appropriates $<strong>18</strong>7million of these funds <strong>to</strong> the Department.• Highway-<strong>Rail</strong>road Crossing Safety Account – Proposition 1B includes$250 million for high priority grade separation and railroad crossing safetyimprovements, <strong>to</strong> be funded pursuant <strong>to</strong> the process established in Streetsand Highways Code (S&HC) Section 2450. To the extent these projectsare on intercity rail routes they will benefit the intercity rail system.However, a dollar for dollar match of non-state funds is required for eachproject, and the limitation on maximum project cost in (S&HC) Section2454(g) is not applicable <strong>to</strong> projects funded with these funds.196
Chapter XII – Intercity <strong>Rail</strong> FundingThe Budget Act of <strong>2007</strong>-<strong>08</strong> appropriates $122.5 million of these funds <strong>to</strong>the Department.• Trade Corridor Improvement Program – Proposition 1B includes $2 billionfor infrastructure improvements along federally designated “TradeCorridors of National Significance.” These projects have not beenprogrammed but <strong>to</strong> the extent they are on intercity rail routes they wouldbenefit the intercity rail program.• In addition, Proposition 1B makes available about $2 billion in additionalSTIP funding. Under current law, intercity rail and grade separationprojects are required <strong>to</strong> receive 2.25 percent of the entire STIP (or ninepercent of the ITIP). Intercity rail and grade separations received anadditional $74 million in the STIP Augmentation approved by the<strong>California</strong> Transportation Commission in June <strong>2007</strong>.THE PASSENGER RAIL AND CLEAN AIR BOND ACT OF 1990(PROPOSITION 1<strong>08</strong>)The 1989 Blueprint Legislation authorized three $1 billion rail bond measures <strong>to</strong>be placed on the ballot in 1990, 1992, and 1994. In 1990, voters approved the first$1 billion rail bond measure, The Passenger <strong>Rail</strong> and Clean Air Bond Act of 1990,but did not approve the subsequent two bond measures in 1992 and 1994. To date,almost all bond proceeds have been used <strong>to</strong> fund new rail projects andimprovements <strong>to</strong> existing systems, including $225 million for intercity rail capitalprojects.CLEAN AIR AND TRANSPORTATION IMPROVEMENT ACTOF 1990 (PROPOSITION 116)Proposition 116 provided a $1.99 billion one-time source of funding for rail andtransit projects. Proposition 116 contained about $382 million for intercity railcapital projects, $1.37 billion for urban and commuter rail projects, and$235 million for other transit and transit-related projects. Most of these bondfunds have been allocated.TRIBAL COMPACT BONDSChapter 91, Statutes of 2004 (AB 687, Nunez) ratified amendments <strong>to</strong> the Tribal-<strong>State</strong> Gaming compacts negotiated by the Governor with five tribes havinggaming income. The bill authorized the issuance of bonds, secured by up <strong>to</strong>$1.5 billion in Indian gaming revenue, <strong>to</strong> be dedicated for transportationimprovement purposes. Based on the statute, the PTA would receive$275 million, the SHA would receive $477 million, the TCRP would receive$453 million, and $192 million would go <strong>to</strong> local streets and roads. However, the2005-06 Budget authorized $1 billion in tribal bond income <strong>to</strong> be used <strong>to</strong> pay most197
<strong>2007</strong>-<strong>08</strong> – <strong>2017</strong>-<strong>18</strong> <strong>California</strong> <strong>State</strong> <strong>Rail</strong> <strong>Plan</strong>of a 2005-06 $1.2 billion General Fund loan commitment <strong>to</strong> the TCRF.The remaining $200 million, plus interest, would be repaid from revenuesresulting from future tribal gaming compacts if more compacts were negotiated.If tribal gaming revenues were not sufficient <strong>to</strong> cover any part of the $1.2 billionowed, the remainder would be repaid from the General Fund by July 1, 2021;however, pending litigation makes the timing of the bond sales and resultingrevenue uncertain.GENERAL FUNDThe General Fund can be used for rail projects if there is a specific appropriationin the budget. Since 1975-76, only the 1999-00 and 2000-01 Budgets providedGeneral Fund money for intercity rail capital projects. The 1999-00 Budgetincluded $17.5 million for new intercity rail rolling s<strong>to</strong>ck, and the 2000-01 Budgetalso provided $30 million for this purpose.LOCAL FUNDSAlthough intercity rail passenger services are funded primarily by the state,a substantial amount of local funds have been invested, mainly on thePacific Surfliner Route <strong>to</strong> fund commuter rail development. These funds serve <strong>to</strong>enhance commuter rail service, and <strong>to</strong> improve tracks, signals and stations used byintercity trains. Also, intercity rail stations are often owned by cities and fundedwith local revenue in addition <strong>to</strong> STIP funding. The Department will continue <strong>to</strong>work with local and regional entities that may wish <strong>to</strong> fund higher levels of servicethan state resources are able <strong>to</strong> provide.FEDERAL FUNDSFederal transportation funds from various programs are used for intercity railprojects. In particular, funding has been provided for station projects from theFederal Transit Administration (FTA) Section 5307 and 5309 capital programs;however, federal flexible transportation funds, such as are provided through theSurface Transportation Program, are generally not available for intercity railprojects.In January <strong>2007</strong>, federal legislation was introduced which would affect intercityrail. This was the Passenger <strong>Rail</strong> Investment and Improvement Act of <strong>2007</strong>(S294). This is a six year authorization which would fully fund Amtrak byauthorizing $3.2 billion a year for that period. The bill would provide an operatingsubsidy for Amtrak as well as providing funds for capital grants <strong>to</strong> Amtrak,operating security, state capital grants and repayment of Amtrak debt. Funding<strong>to</strong>tals for the six years are $11.3 billion. An additional amendment <strong>to</strong> the bill,submitted by the authors, would be a bonding amendment for an additional$7.8 billion.198
Chapter XII – Intercity <strong>Rail</strong> FundingAMTRAK FUNDSOn the operating side, Amtrak supports 30 percent of the Pacific Surfliner Route,as this portion is considered <strong>to</strong> be part of their Basic System, and not as a statesupportedservice.On the capital side, Amtrak develops and funds some <strong>California</strong> intercity railcapital projects. The largest investment has been in maintenance facilities androlling s<strong>to</strong>ck. As a result of the Taxpayer Relief Act of 1997, Amtrak wasprovided over $2 billion in capital funds for its nationwide system. In recentyears, Amtrak has increased its investment in <strong>California</strong>, including the purchase of40 new passenger cars and 14 locomotives for the Pacific Surfliner Route at a cos<strong>to</strong>f about $135 million. See Chapter XI for a list of the proposed <strong>California</strong>projects included in Amtrak’s Strategic <strong>Plan</strong> for FFY 2005-09.RAILROAD FUNDS<strong>Rail</strong>roads own the rights-of-way (ROW) on tracks used for intercity passengerroutes. In some instances, the cost of track and signal improvement projects onthese tracks is shared by the railroads and the state. For example, both the BNSFand UP recently completed several major track rehabilitation projects on theSan Joaquin and Capi<strong>to</strong>l Corridor routes.199
<strong>2007</strong>-<strong>08</strong> – <strong>2017</strong>-<strong>18</strong> <strong>California</strong> <strong>State</strong> <strong>Rail</strong> <strong>Plan</strong>200
PART IIFREIGHT RAIL ELEMENT201
<strong>2007</strong>-<strong>08</strong> – <strong>2017</strong>-<strong>18</strong> <strong>California</strong> <strong>State</strong> <strong>Rail</strong> <strong>Plan</strong>202
Chapter XIII – IntroductionCHAPTER XIIIINTRODUCTIONThe purpose of the freight element is <strong>to</strong> illustrate key features of the freight railsystem, current issues facing freight rail including funding, and policy goals for themaintenance, preservation and improvement of the system. <strong>California</strong> faces a hugetask in the movement of people and goods within the <strong>State</strong>. A well maintained andimproved freight rail system can be a potent method for the alleviation some of themajor issues facing the <strong>State</strong>, including traffic congestion, air quality, and prudentuse of fuel resources.The Department’s efforts for the maintenance, preservation and implementation ofthe state’s freight rail system revolve around recommendations and fundingstrategies in the Administration’s Strategic Growth <strong>Plan</strong> (SGP), the utilization offunds from other sources, and the coordination and cooperation with the freight railindustry and local agencies.This draft <strong>2007</strong>-<strong>08</strong> <strong>to</strong> <strong>2017</strong>-<strong>18</strong> <strong>California</strong> <strong>State</strong> <strong>Rail</strong> <strong>Plan</strong> provides a description ofthe freight rail network, issues concerning the freight rail industry, and policyrecommendations and goals for the maintenance, preservation and improvement ofthe freight rail system. It is based in part on preliminary information from<strong>California</strong>’s railroads. The final version will incorporate their full technical andanalysis inputs.203
<strong>2007</strong>-<strong>08</strong> – <strong>2017</strong>-<strong>18</strong> <strong>California</strong> <strong>State</strong> <strong>Rail</strong> <strong>Plan</strong>204
Chapter XIV – Policy <strong>State</strong>ment/RecommendationsCHAPTER XIVPOLICY STATEMENT/RECOMMENDATIONSPOLICY STATEMENT NO. 1: CALIFORNIA STRATEGICINTERESTIn order <strong>to</strong> maintain the position and contributions the freight rail systemmakes <strong>to</strong> <strong>California</strong> and the nation, it is in the strategic interest of the <strong>State</strong> <strong>to</strong>maintain, preserve and improve <strong>California</strong>’s freight rail system.IMPORTANCE OF THE FREIGHT RAIL SYSTEM TO CALIFORNIAThe <strong>State</strong> of <strong>California</strong> occupies a position of economic and strategic importancein the nation. To maintain this position and provide a springboard for expandedeconomic growth at both regional and national levels, the preservation andmaintenance of the freight rail system in the <strong>State</strong> is of crucial importance.<strong>California</strong> faces myriad problems in the movement of goods and people as entersthe 21 st century. With an expanding <strong>State</strong> and national economy, and a growingpopulation, issues of congestion, air quality, land use and natural resource usedirectly impact <strong>California</strong>. The population of the <strong>State</strong> was 34.1 million in 2000,but projections by the <strong>State</strong> Department of Finance foresee a population of over44.1 million by 2020, and 59.5 million by 2050.To meet the challenges of a growing population and expanding economy billionsof dollars in investments will have <strong>to</strong> be made in <strong>California</strong>’s rail networks,highways and port systems <strong>to</strong> add capacity and reduce congestion. Most of thisinvestment will be made in the four major goods movement corridors:Los Angeles-Long Beach/Inland Empire; San Diego/Border; Bay Area, andCentral Valley. Maintaining and expanding capacity along these transportationarteries provide not only a basis for economic growth in the <strong>State</strong>, but they alsoserve as an increasingly important network <strong>to</strong> all sections of the U.S.<strong>California</strong> is in a strategically important geographical position. As well ascontaining approximately 12 percent of the nation’s population, and having theeighth largest economy in the world, it serves as the entryway for huge amounts ofgoods from outside the country, which connect not only <strong>to</strong> <strong>California</strong> but also <strong>to</strong>the rest of the United <strong>State</strong>s. Major freight corridors extend both east-west andnorth-south for the movement of both imports and exports.Of increasing importance are the port complexes associated with internationaltrade. In the Los Angeles area alone, international trade created 45,500 jobs in2005, bringing the annual average employment <strong>to</strong> over 450,000.Investments in goods movement infrastructure can yield numerous benefits.As well as increased employment, traffic congestion and exhaust emissions can be205
<strong>2007</strong>-<strong>08</strong> – <strong>2017</strong>-<strong>18</strong> <strong>California</strong> <strong>State</strong> <strong>Rail</strong> <strong>Plan</strong>reduced; the Alameda Corridor Transportation Authority reported that sinceopening in 2002 and 2005 both Nitrous Oxide (NOx) and diesel particulate matter(DPM) were noticeably reduced, and that in 2005 <strong>to</strong>tal emissions were lowered bymore than 1,400 <strong>to</strong>ns. These emissions reductions are critical <strong>to</strong> improving the airquality and health outcomes for communities adjacent <strong>to</strong> the Alameda Corridor.THE STRATEGIC GROWTH PLANTo address the funding needs required <strong>to</strong> reach its goals the Strategic Growth <strong>Plan</strong>(SGP) calls for an infrastructure improvement program <strong>to</strong> strengthen the state’stransportation system, education, housing and waterways. The transportationelement of the program calls for $107 billion <strong>to</strong> improve mobility and accessibilityfor people and goods. In November 2006 the voters approved Proposition 1Bwhich provides the framework for this funding. The all-embracing vision for theSGP provides a springboard for the “3-E’s” discussed in the SGP. They are:• Prosperous Economy• Quality Environment• Social Equity.In conjunction with the SGP, the <strong>California</strong> Department of Transportation hasproduced the <strong>California</strong> Transportation <strong>Plan</strong> 2025 (CTP), a document whichdiscusses trends and challenges in movement, and serves as a blueprint forcarrying out the goals of the SGP and meeting the <strong>State</strong>’s future transportationneeds.The vision of the SGP is carried over <strong>to</strong> the Department’s plan. To implement the“3-E’ vision, the CTP lists a number of goals. These goals include:• Improvement of Mobility and Accessibility• Preservation of the Transportation System• Support of the Economy, Enhancement of Public Safety and Security• Reflection of Community Values• Enhancement of the EnvironmentAs an outgrowth of the <strong>Plan</strong>, a number of policies have been developed whichdirectly impact freight railroads in the <strong>State</strong>. They include:• Increase system capacity• Preserve and maintain the system• Enhance goods movement• Support research <strong>to</strong> advance mobility and accessibility• Manage and operate an efficient intermodal system• Provide additional and flexible funding• Expand collaboration in planning and decision-making206
Chapter XIV – Policy <strong>State</strong>ment/Recommendations• Provide for system security• Manage growth• Conserve natural resources• Commit <strong>to</strong> a clean and energy efficient systemSteps <strong>to</strong> carry out this goal have recently been inaugurated by the current <strong>State</strong>administration. Initiatives, which have come from the Administration’s StrategicGrowth <strong>Plan</strong>, have a direct bearing on freight rail in the <strong>State</strong>.Funding provided by elements of Proposition 1B will benefit the freight railsystem in the <strong>State</strong>. As well as being a component of the national rail network,railroads in <strong>California</strong> serve as an integral part of the <strong>California</strong> transportationsystem. Although moving large amounts of goods both within and through<strong>California</strong>, they do not benefit from publicly funded infrastructure such ashighways and airports as do competitive modes of transportation.A key transportation element of the SGP is the Goods Movement Action <strong>Plan</strong>(GMAP). The realization that the <strong>State</strong> faces a great number of mobility andenvironmental challenges with the continued growth of both population and theeconomy brought about the initiation of studies focusing on these issues.The GMAP provides a path for the development of projects, which will expeditegoods movement in the <strong>State</strong> and provide a pivot for congestion relief andenvironmental enhancement. It focuses on priority regions and corridors in<strong>California</strong> and the impacts of goods movement along them. Development of theGMAP began in 2004 and a final report was signed by Governor Schwarzeneggerin January <strong>2007</strong>. It reflects the Administration policy for goods movement.Its purpose is <strong>to</strong> present a framework for action and is an initiative <strong>to</strong>:• Generate jobs.• Increase mobility and relieve traffic congestion• Improve air quality and protect public health• Enhance public and port safety.• Improve <strong>California</strong>’s quality of life.The development of the GMAP was a two-phase process. The Phase I elementreleased in September 2005 described the state’s involvement in goods movement.It also compiled an inven<strong>to</strong>ry of existing and proposed goods movementinfrastructure projects. Phase II focused on a set of preliminary candidate actionsfor operational improvements, infrastructure additions, impacts mitigation,workforce development and security and public safety improvement efforts.All these efforts illustrate, by their overviews, analyses, funding recommendationsand implementation plans the vital role played by the freight rail system in theoverall transportation network of the state. They emphasize the continuing207
<strong>2007</strong>-<strong>08</strong> – <strong>2017</strong>-<strong>18</strong> <strong>California</strong> <strong>State</strong> <strong>Rail</strong> <strong>Plan</strong>importance of the system, and the need for its maintenance, preservation andimprovement.POLICY STATEMENT NO. 2: SYSTEM PLANNINGA long range, sustainable, system planning program <strong>to</strong> identify freight railsystem needs and projects which increase mobility and enhance theenvironment should be undertaken.The Department recognizes the importance of developing a comprehensiveunderstanding of the statewide freight rail system, its challenges and opportunities,and the need <strong>to</strong> migrate this understanding in<strong>to</strong> the Department’s existing systemsplanning process. Currently, freight rail issues that may affect the entiretransportation system are considered (if they are considered at all) in a fragmentedmanner. What is known is that the Class 1 railroads are facing increased levels oftraffic along their corridors and are approaching maximum capacity. Recentinputs from both the Burling<strong>to</strong>n Northern Santa Fe (BNSF) and Union Pacific(UP) railroads noted that there are several choke points on the systems that shouldbe addressed <strong>to</strong> provide for the increased volumes of traffic:• Cajon Pass between San Bernardino and Cajon Summit, shared by bothClass 1 roads and serving the Los Angeles Basin <strong>to</strong> the Midwest and East;• Tehachapi Pass between Bakersfield and Mojave, a shared, single-trackroute that connects Northern <strong>California</strong> and the Northwest <strong>to</strong> other regionsof the United <strong>State</strong>s; and• Col<strong>to</strong>n Crossing in San Bernardino County, an intersection between theBNSF and UP and a major transit point for both railroads <strong>to</strong> and from theport areas of Los Angeles and Long Beach as well as regional traffic.Additional congestion is provided by commuter rail services that useCol<strong>to</strong>n Crossing. Remedies <strong>to</strong> this chokepoint problem are exacerbated bythe proximity of a major freeway.In addition <strong>to</strong> these problems, the increase in intermodal traffic at the major<strong>California</strong> ports is making heavy demands on existing railroad capacity.The growing importance of intermodal freight in <strong>California</strong> railroad operations isbased on consumer demand as well as the fact that <strong>California</strong> is the primarygateway for containerized products coming in from the rapidly expanding PacificRim economies. Additional problems are faced by the short line railroads in the<strong>State</strong>. The crucial need for infrastructure upgrades are noted by many of the shortline roads, particularly <strong>to</strong> handle heavier cars that are used by the Class 1 railroads.Short line railroads often serve widely spaced cus<strong>to</strong>mers in rural areas of the state,and are often stretched for funding the upgrades needed <strong>to</strong> maintain service letalone consider expansion.These considerations have impacts beyond the freight rail system itself. Capacityconstraints lead <strong>to</strong> surface congestion at numerous grade crossings, contribute <strong>to</strong>2<strong>08</strong>
Chapter XIV – Policy <strong>State</strong>ment/Recommendationsincreased emissions, and interfere with the logical planning and delivery oftransportation infrastructure. Implementing a long-range, comprehensive planningprogram will be a critical element in developing the most effective solutions.POLICY STATEMENT NO. 3: RAIL PRESERVATIONTo maintain the <strong>State</strong>’s economic health, at a minimum the <strong>State</strong>’s railnetwork, and the system’s freight market share, must be preserved <strong>to</strong> themaximum extent feasible.In order for the <strong>State</strong> <strong>to</strong> continue in its preeminent economic position, thepreservation and maintenance of the current freight rail system is extremelyimportant. As well, corridors not in use but that one-day may return <strong>to</strong> activityshould also be preserved. The following information illustrates current andprojected trends that will impact this system.A recent report by the American Association of <strong>State</strong> Highway TransportationOfficials “Freight <strong>Rail</strong>-Bot<strong>to</strong>m Line Report” focused on the freight rail system inthe United <strong>State</strong>s and analyzed a number of fac<strong>to</strong>rs, which affect it. The reportnoted that freight rail carries 16 percent of the nation’s freight by <strong>to</strong>nnage,28 percent of <strong>to</strong>n-miles, and six percent of freight values. If all freight rail wereshifted <strong>to</strong> truck <strong>to</strong>morrow, it would add 92 billion truck vehicle miles <strong>to</strong> thehighway system and cost federal, state and local transportation agencies anadditional $64 billion for highway improvements over the next 20 years.Economic growth and the concomitant movement of goods will place a huge strainon the transportation framework of the country. Maintenance of the freight railsystem at its current level, or even with minor improvements will see more freightcarried by truck. Projections anticipate a national economic growth of threepercent a year, with domestic <strong>to</strong>nnage growing by 57 percent by 2020 and importexportgrowth 100 percent during the same period Even a one percent increase intruck vehicle miles would add approximately $1.6 billion <strong>to</strong> highway costsbetween 2000 and 2020.The impacts of the freight movement scenarios would be felt especially in<strong>California</strong>, and potential problems with constricted flows should be unders<strong>to</strong>od.As already noted <strong>California</strong> ports have become increasingly important in thenational economic fabric. For example a 10-day lockout and 23-day backlog ofWest Coast ports in 2002 disrupted trade valued at $6.28 billion just in the Ports ofLong Beach and Los Angeles. While this disruption was not caused by anovertaxed freight rail system the potential for negative economic impacts with a.overburdened rail system should not be underestimated. Failure <strong>to</strong> invest in goodsmovement infrastructure could also lead <strong>to</strong> significant losses in future taxrevenues. The Los Angeles County Economic Development Corporation hasestimated that the state could lose over $17 billion in state income and sales taxesthrough 2035. “Growth of <strong>California</strong> Ports: Opportunities and Challenges”209
<strong>2007</strong>-<strong>08</strong> – <strong>2017</strong>-<strong>18</strong> <strong>California</strong> <strong>State</strong> <strong>Rail</strong> <strong>Plan</strong>Interim Report <strong>to</strong> the <strong>California</strong> <strong>State</strong> Legislature” submitted by the <strong>California</strong>Marine and Intermodal Transportation System Advisory Council, (CALMITSAC)in 2006.POLICY STATEMENT NO. 4: ENVIRONMENT<strong>California</strong> must expand and improve its freight rail system and operationsand simultaneously work <strong>to</strong> reduce associated health risks and communityimpacts. Local, state, and federal agencies must work <strong>to</strong>gether as partnerswith private citizens and business concerns <strong>to</strong> provide a clean environmentand a healthy business climate. These goals are fundamental <strong>to</strong> GovernorSchwarzenegger’s Strategic Growth <strong>Plan</strong>.These are twin policy objectives that must be achieved in providing a freight railsystem for <strong>California</strong>’s citizens. This <strong>to</strong>pic is discussed in detail in the Chapter V,Environment.POLICY STATEMENT NO. 5: FUNDINGIn order <strong>to</strong> maintain and strengthen the position and contributions the freightrail system makes <strong>to</strong> <strong>California</strong>, the regions and the nation, the <strong>State</strong> must bean active partner with the private sec<strong>to</strong>r and other government entities in thefunding of major freight rail improvements.Recent Congressional testimony (<strong>State</strong>ment for Surface Transportation BoardHearing on <strong>Rail</strong> Capacity and Infrastructure Requirements by David Ganovski)stressed that freight rail transportation is not keeping pace with the demands of theeconomy and that the freight system overall is in the early stages of a capacitycrisis. Even with moderate growth of three percent a year the U.S. will see adoubling of freight movement by 2035. He also stressed (buttressed by theAASHTO Report) the importance of public-private partnerships <strong>to</strong> meet freighttransportation challenges.<strong>California</strong> currently works with both the Class 1 railroads and short linecompanies. It has also been in partnership with various governmental entities forspecific projects which benefit freight rail. Perhaps the most notable project hasbeen the Alameda Corridor project in Southern <strong>California</strong> where the <strong>State</strong>partnered with the Federal government, private sec<strong>to</strong>r railroads and localgovernment agencies.Although current and past initiatives have played a key role in developing andmaintaining the system, other partnerships of this type must continue if projects,which benefit the <strong>State</strong> by relieving congestion and providing for the reduction ofair pollution, are <strong>to</strong> continue.210
Chapter XIV – Policy <strong>State</strong>ment/RecommendationsPOLICY STATEMENT NO. 6: PARTNERSHIPSTo foster the maintenance, preservation, and improvement of the <strong>State</strong>freight rail system, its planning and development must be undertaken as anongoing partnership between the <strong>State</strong> and other levels of government, andthe freight railroads with other private sec<strong>to</strong>r interests. This partnershipshould seek <strong>to</strong> maximize mutual benefit, including public mobility, safety, andenvironmental objectives, and private sec<strong>to</strong>r business opportunities andreturn on investment.The close cooperation between <strong>California</strong>’s railroads and the public sec<strong>to</strong>r,fostered by the development of the Strategic Growth <strong>Plan</strong>, Proposition 1B and itsTrade Corridor Improvement Fund, and the development of the BTH/CalEPAGoods Movement Action <strong>Plan</strong>, in developing the <strong>State</strong> rail system is a significantdeparture from past practices. This requires a strong, significant partnership bebuilt and maintained on these issues among the parties. How the projects fundedunder the TCIF will be administratively handled is also a concern. The question isthen essentially, how does such a partnership be developed?Fortunately, there are programs in several other states that <strong>California</strong>’s programcan be modeled after. The Pennsylvania Department of Transportation(PennDOT) <strong>Rail</strong> Freight Assistance Program (RFAP) provides financial assistancefor investment in rail freight infrastructure. The intent of the Program is <strong>to</strong>(1) preserve essential rail freight service where economically feasible, and(2) preserve or stimulate economic development through the generation of new orexpanded rail freight service.The PennDOT Bureau of <strong>Rail</strong> Freight is charged with the administration of moniesallocated through the RFAP. Financial assistance is available on a matching grantbasis <strong>to</strong> railroad companies, transportation organizations, municipalities,municipal authorities and users of rail freight infrastructure. The process andorganization of this program might be something that could be used as a templatein <strong>California</strong>.211
<strong>2007</strong>-<strong>08</strong> – <strong>2017</strong>-<strong>18</strong> <strong>California</strong> <strong>State</strong> <strong>Rail</strong> <strong>Plan</strong>212
Chapter XV – System OverviewCHAPTER XVSYSTEM OVERVIEWNETWORK DESCRIPTION<strong>California</strong> is an important ingredient in the national freight rail system. In 2005,<strong>California</strong> railroads operated over 7335 miles of track, carried 7,124,010 carloadsof freight with a weight <strong>to</strong>taling over 173 million <strong>to</strong>ns. They employed more than10,000 workers, who had an average compensation of over $93,000. As well asproviding access points for international imports and exports <strong>California</strong> is a largefreight rail market itself. Freight traffic consisted of a mosaic of goods, andincluded a range of mixed freight, agricultural and food products chemicals metal,building materials and timber.General information about this network, and the commodities that are moved, areshown in the information sheets following.The two Class 1 railroads in <strong>California</strong> (those having revenues of at least$319.3 million) are the BNSF <strong>Rail</strong>way (BNSF) and the Union Pacific (UP). Thesetwo roads have extensive rail networks connecting <strong>California</strong> with the rest of thenation, particularly corridors <strong>to</strong> the Southwest, Midwest and Northwest. Includingtrackage rights, these two railroads operate over a <strong>to</strong>tal of 5,488 miles in the <strong>State</strong>.They are complemented by service on a number of other railroads. These includeone regional railroad, which serves Oregon as well as a small segment in northern<strong>California</strong> (52 miles), 15 short line railroads that operate over a <strong>to</strong>tal of1,285 miles of track, and 11 switching and terminal railroads operating over a <strong>to</strong>talof 510 miles of track.ECONOMIC SIGNIFICANCE TO THE STATE<strong>Rail</strong>roads provide service <strong>to</strong> <strong>California</strong>, but also play an extremely important rolein both the United <strong>State</strong>s. and the global economy. As well as serving the rest ofthe nation with the important corridors of the Class 1 railroads, they serve theimport and export markets for a large number of Pacific Rim countries,particularly the booming economies of East and Southeast Asia. Approximately45 percent of intermodal traffic entering or leaving the U.S. passes through<strong>California</strong> ports, especially the port complexes of Los Angeles/Long Beach andOakland in Northern <strong>California</strong>. Indeed, when considering the container volumethroughput of major international container ports, when combined the containervolume of Los Angeles/Long Beach would rank fifth among internationalcontainer ports and standing alone they rank 10 and 11.213
<strong>2007</strong>-<strong>08</strong> – <strong>2017</strong>-<strong>18</strong> <strong>California</strong> <strong>State</strong> <strong>Rail</strong> <strong>Plan</strong>Figure 15A214
Chapter XV – System OverviewFigure 15B215
<strong>2007</strong>-<strong>08</strong> – <strong>2017</strong>-<strong>18</strong> <strong>California</strong> <strong>State</strong> <strong>Rail</strong> <strong>Plan</strong>216
Chapter XVI – Major Freight IssuesCHAPTER XVIMAJOR FREIGHT ISSUESSIGNIFICANT TRENDSINTERNATIONAL TRADE GROWTHTrade has made <strong>California</strong> a global powerhouse. With a gross state product ofnearly $1.5 trillion, and more than one in 12 <strong>California</strong>ns employed in exportsupported jobs, <strong>California</strong> is an example of free trade at work. Nearly 20 percen<strong>to</strong>f all foreign trade passes through <strong>California</strong>, <strong>to</strong>taling $436 billion in goods for theyear ended 2006. Foreign trade through the Ports of Los Angeles and Long Beachis expected <strong>to</strong> triple by the year 2030. <strong>California</strong> trade and exports support morethan one million jobs in the state, and a half-million are tied directly <strong>to</strong> foreigninvestment.Strategically located astride the Asian Pacific-American trade route and linked <strong>to</strong>Latin America through regional free trade agreements, over the past decade<strong>California</strong> businesses and workers have led the nation in trade-related growth.Whether it be <strong>California</strong> high-tech products, films or agriculture, the statecompetes and wins when free trade provides new markets. Expanding global trademeans economic growth for <strong>California</strong> and America.Freight rail, in partnership with the trucking industry, provides intermodaltransportation connecting <strong>California</strong> seaports with inland producers andconsumers. It serves the <strong>State</strong>’s seaports and facilitates international trade.Freight rail also carries 16 percent of the nation’s cross-border NAFTA trade.Intermodal freight-rail service is crucial <strong>to</strong> the global competitiveness of<strong>California</strong> industries. It provides the long-distance, line-haul component of truckrailintermodal moves. <strong>Rail</strong> is critical <strong>to</strong> the competitiveness of many industriesand the economies of many states, especially in <strong>California</strong>.Total U. S. domestic and international freight <strong>to</strong>nnage will increase by 67 percentby 2020, and <strong>California</strong> will be seriously impacted by this increase. At currentinvestment levels, the railroad industry would have difficulty absorbing its shareof this growth. In the worst case, freight rail would carry the same volume offreight in 2020 as it carries <strong>to</strong>day. This would shift almost 900 million <strong>to</strong>ns offreight and 31 billion truck vehicle-miles-of-travel <strong>to</strong> the highways, costingshippers$326 billion, costing highway users $492 billion, and adding $21 billion <strong>to</strong>highway costs through 2020. In the best case, freight rail would carry a largerpercentage of freight <strong>to</strong>ns in 2020 than it carries <strong>to</strong>day (e.g., 17 percent in 2020compared <strong>to</strong> 16 percent). This would shift 600 million <strong>to</strong>ns of freight and25 billion truck vehicle-miles-of travel off the highway system, saving shippers217
<strong>2007</strong>-<strong>08</strong> – <strong>2017</strong>-<strong>18</strong> <strong>California</strong> <strong>State</strong> <strong>Rail</strong> <strong>Plan</strong>$239 billion, saving highway users $397 billion, and reducing highway costs by$17 billion.With the world’s eighth largest economy and the distinction of being the placewhere one out of eight persons in the United <strong>State</strong>s calls home, <strong>California</strong>’s37.1 million people require a labyrinth of roads, railways, seaports, airports, anddistribution centers <strong>to</strong> deliver the food, the clothing, and the essentials of daily life.By 2020, the net addition of another seven million people, the equivalent ofadding the current population of the state of Virginia, creates additional challenges<strong>to</strong> meet the <strong>State</strong>’s own goods movement needs.The economic benefits <strong>to</strong> <strong>California</strong> and the rest of the nation from Pacific Rimtrade are substantial. In the Los Angeles area alone, international trade created45,500 jobs in 2005, bringing the annual average employment <strong>to</strong> 450,100.Economic benefits in terms of lower prices and higher productivity; equitybenefits for logistics workers who meet growing demand for higher skills andmove up the occupational ladder; and, environmental benefits from improvedefficiency, reduced waste, and bottlenecks in supply chains based on investmentsin transportation and trade infrastructure.If combined the Ports of Los Angeles and Long Beach would be the world’s fifthlargest seaport. Combined with the Port of Oakland, which is the fourth busiestseaport in the Nation, these three seaports handle more than 40% of allInternational, primarily Pacific Rim, containerized cargo shipped <strong>to</strong> the U. S.These seaports rely heavily on freight rail <strong>to</strong> move a significant portion of the16.6 million TEUs, which came <strong>to</strong> these ports in 2006. The Ports of Los Angelesand Long Beach are projecting annual volume growth of 7% per year, whileOakland is expecting 4% per year volume growth.However, there are significant challenges requiring action. <strong>California</strong>’santicipated population increase, and its geographic position as a gateway <strong>to</strong> thePacific Rim, is inevitable drivers of goods movement growth. The expansion oftrade in <strong>California</strong> is not a matter of choice.To meet these challenges, billions of dollars of investment in <strong>California</strong>’s ports,rail networks, and highways will be needed <strong>to</strong> add capacity and reduce congestion.Most of this investment will center on the <strong>State</strong>’s four “port-<strong>to</strong>-border” goodsmovement corridors: Los Angeles-Long Beach/Inland Empire, Bay Area,San Diego/Border, and Central Valley. These corridors have built up over decadesencompassing large complexes that facilitate ship <strong>to</strong> rail, ship <strong>to</strong> truck, and truck<strong>to</strong> rail exchanges <strong>to</strong> move millions of containers per year <strong>to</strong> their ultimatedestinations.The table on the next page illustrates some of the significant proposed freight railprojects that could help overcome the challenges facing <strong>California</strong>’s goods2<strong>18</strong>
Chapter XVI – Major Freight Issuesmovement system, accommodate international trade and also benefit the rest of theNation.THE CHANGING NATURE OF RAIL FREIGHT MOVEMENTS/COMMODITIES<strong>Rail</strong> provides three basic types of freight service: bulk unit train, mixed carload,and intermodal (container, trailer, and au<strong>to</strong>mobile). These services differ in theirmarkets, operations, and contributions <strong>to</strong> <strong>California</strong> and the nation’s freighttransportation system.Bulk Unit TrainsBulk unit trains move very high volumes of a single commodity such as coal,grain, minerals, and waste. In <strong>California</strong>, all of these commodities with theexception of coal are move. (Intermodal containers and specialized au<strong>to</strong>mobilecarrier cars are frequently made up in<strong>to</strong> unit trains; these are addressed in thediscussion of intermodal service.) Commodity flows tend <strong>to</strong> be one-way; cars(usually hopper cars) move loaded from shipper <strong>to</strong> receiver and are returned emptyfrom the receiver <strong>to</strong> the shipper. Commodity flows tend <strong>to</strong> be “door-<strong>to</strong>-door,”moving from shipper <strong>to</strong> receiver entirely by rail. Bulk unit train commodities arehighly sensitive <strong>to</strong> transportation cost because they are heavy but, like coal andgrain, relatively low in value. Unit trains provide the efficiencies needed <strong>to</strong> movethese commodities cost-effectively. This is accomplished through:• Long trains (up <strong>to</strong> one and one-half miles) of rail cars moving alongmainline corridors, which allows economies of scale in operation (lesshandling cost, more efficient utilization of locomotives, greater fuelefficiency, etc.);• Uniform composition (usually a single commodity and railcar type), whichsimplifies the collection and distribution of railcars along feeder lines; and• Cus<strong>to</strong>mers who tend <strong>to</strong> produce or consume large quantities of thesematerials, reducing the number of origins and destinations that need <strong>to</strong> beserved.• Unit train flows tend <strong>to</strong> occur along well-defined, high-density corridors,rather than clustering at major urban rail hubs.219
<strong>2007</strong>-<strong>08</strong> – <strong>2017</strong>-<strong>18</strong> <strong>California</strong> <strong>State</strong> <strong>Rail</strong> <strong>Plan</strong>Figure 16AExamples of Key Required Freight <strong>Rail</strong> Projects in <strong>California</strong>Project TitlePort of Los Angeles/Burling<strong>to</strong>nNorthern Santa Fe, “Southern <strong>California</strong>International Gateway” Near DockFacilityPorts of Los Angeles and Long Beach/Union Pacific, Near Dock IntermodalContainer Transfer Facility CompletionBurling<strong>to</strong>n Northern Santa Fe/UnionPacific, Col<strong>to</strong>n Crossing GradeSeparationProjectCost(Inthousands)CorridorCounty$200,000 I-710 Los Angeles$300,000 I-710 Los Angeles$<strong>18</strong>0,000 I-10 San BernardinoUnion Pacific, Col<strong>to</strong>n Flyover $100,000 I-10 San BernardinoPort of Oakland, Outer HarborIntermodal Terminal$325,000 I-80 AlamedaUnion Pacific, Oakland <strong>to</strong> Richmond,Alameda$78,000 I-80Capacity Improvement ProjectContra CostaBurling<strong>to</strong>n Northern Santa Fe,Tehachapi Pass Double-Track, Tunnel $82,000 SR 58Modification(I-5)KernUnion Pacific, “Central Corridor”Double Track, Tunnels Modification$90,000 I-80 NevadaTotals $3,266,000Mixed CarloadMixed carload trains move a diverse range of commodities, including chemicals,food products, forest products, metals, au<strong>to</strong> parts, waste, and scrap. Again, all ofthese products are either imported or exported <strong>to</strong> <strong>California</strong>, and in largequantities. <strong>Rail</strong> carload equipment includes liquid-bulk tank cars, open flatcars,hopper cars, and traditional boxcars. (Intermodal containers and specializedau<strong>to</strong>mobile carrier cars can also be handled as carload traffic; these are addressedin the discussion of intermodal service.) Like bulk unit trains, carload traffic tends<strong>to</strong> be one-way – loaded <strong>to</strong> the receiver, empty back <strong>to</strong> the shipper.Most carload traffic is door-<strong>to</strong>-door, although smaller cus<strong>to</strong>mers without direct railaccess or those who need less-than-carload quantities can be served by combinedcarload-truck services.220
Chapter XVI – Major Freight Issues“Transload” facilities accommodate the transfer of non-flowing materials(e.g., lumber, sheetrock, etc.) from carload <strong>to</strong> truck using conventional methods(e.g., forklifts, cranes, etc.). Similarly, “transflow” facilities accommodate thetransfer of liquid or “flowing” materials (e.g., oils, plastic pellets, bakery flour,etc.) from carload <strong>to</strong> truck using very specialized pumping equipment. Transloadand transflow commodities are moved from the shipper’s fac<strong>to</strong>ry <strong>to</strong> a rail yard orsiding near the receiver, then moved the final miles by truck for “just-in-time” useby the receiver. Carload generally serves heavy products that are sensitive <strong>to</strong>transportation costs. However, it can be more difficult <strong>to</strong> achieve economies ofscale with carload traffic than with unit-train traffic because carload serviceinvolves a much higher degree of handling and management.Carload trains typically are not uniform in composition. They include a variety ofrailcar types, each of which must be collected from and distributed <strong>to</strong> specificcus<strong>to</strong>mers. On a unit train, one hopper car full of grain or minerals is the same asany other. But on a carload train, each car is an individual shipment. Moreover,many cars are privately owned or in “sequestered” or dedicated service andtherefore not interchangeable and available for use by other cus<strong>to</strong>mers.The variety of car types and commodities increases administrative and physicalhandlingcosts compared <strong>to</strong> unit train service.Carload train lengths vary greatly by intercity corridor and market, reflecting thedifferent mixes and volumes of commodities moving between markets.The railroads collect many different types of cars from many different cus<strong>to</strong>mers,classify and marshal them in<strong>to</strong> long consists for the intercity move, and then breakthem in<strong>to</strong> shorter consists for the final delivery. The railroads depend on acomplex hub and spoke network <strong>to</strong> move consists and individual cars through thesystem. The shorter the intercity corridor and the more complex the mix of carand commodity types, the more difficult it is <strong>to</strong> achieve economies of scale incarload operations.Carload cus<strong>to</strong>mers are more diverse than unit train cus<strong>to</strong>mers. Carload usersrange from large cus<strong>to</strong>mers generating hundreds of carload shipments a week <strong>to</strong>small cus<strong>to</strong>mers receiving a handful of carload deliveries a month. The mix oflarge and small cus<strong>to</strong>mers and the wide geographic distribution of origins anddestinations make it difficult <strong>to</strong> handle all shipments profitably. For example,CSX estimates that it is three times more expensive on a per-car basis <strong>to</strong> serve alow-density cus<strong>to</strong>mer than <strong>to</strong> serve a high-density cus<strong>to</strong>mer. Carload traffic flowsare far more dispersed than unit train flows.The carload network is centered on the nation’s key urban railroad hubs (e.g.,Chicago, St. Louis, Kansas City, Memphis, Hous<strong>to</strong>n, and Dallas) with majorcorridors running north-south and east-west. Traffic densities on the majorcorridors are similar, but the mix of commodities varies (e.g., chemicals fromHous<strong>to</strong>n <strong>to</strong> Chicago; lumber from Portland <strong>to</strong> Chicago; and in <strong>California</strong> food221
<strong>2007</strong>-<strong>08</strong> – <strong>2017</strong>-<strong>18</strong> <strong>California</strong> <strong>State</strong> <strong>Rail</strong> <strong>Plan</strong>products from the San Joaquin Valley <strong>to</strong> Chicago). In 2000, carload trains carried783 million <strong>to</strong>ns over 236 billion <strong>to</strong>n-miles. This is the equivalent of 20.1 billiontruck miles. However, within the commodity groups served by carload, railcaptures just seven percent of the <strong>to</strong>nnage, compared <strong>to</strong> 93 percent for truck andwater. <strong>Rail</strong> continues <strong>to</strong> seek ways <strong>to</strong> grow its share of mixed carload business,but <strong>to</strong> compete more effectively with trucking, it will need <strong>to</strong> increase its door-<strong>to</strong>doorreliability, lower its operating costs, and increase its overall handling speed.Intermodal (Container, Trailer, and Au<strong>to</strong>mobile)Intermodal trains move truck trailers and containerized goods containing finishedconsumer goods, refrigerated foods, parts and <strong>to</strong>ols for manufacturing, rawmaterials, post-consumer scrap – almost anything that can be packed in<strong>to</strong> acontainer or truck trailer. <strong>Rail</strong> shipments of au<strong>to</strong>mobiles are also treated asintermodal traffic since they share many of the characteristics of intermodalmerchandize (e.g., high-value, time-sensitive, etc.) and are handled in a similarmanner. However, the railroads usually market and account for au<strong>to</strong>mobile trafficas a separate service. Unlike unit train and carload traffic, intermodal traffic istypically two-way. Through <strong>California</strong> the BNSF moves more intermodal volumethan any other Class I <strong>Rail</strong>road in North America, the UP also handles a similarlysignificant volume of intermodal traffic through the <strong>State</strong>.Imported international containers may move inland from a seaport, be unloaded,and then reloaded with export cargo (if available) or with purely domestic cargo(taking advantage of discounts offered by the railroads and container owners) forthe “backhaul.” Similarly, au<strong>to</strong> trains may arrive at a port with export vehiclesand depart with import vehicles.Intermodal containers come in a variety of shapes and sizes. They range from20-feet <strong>to</strong> 53-feet long and from 8-feet, 6-inches high <strong>to</strong> 9-feet, 9-inches high.International container volumes are measured in 20-foot equivalent units, orTEUs. A 20-foot container is counted as one TEU, and a 40-foot container iscounted as two TEUs. The 40-foot container is the most common type used inwaterborne transportation. Domestic containers typically are 48- or 53-feet long,and are modifications of standard over-the-road truck trailers. The contents ofthree40-foot containers will fit in<strong>to</strong> two 53-foot containers, thus eliminating costsassociated with transporting an extra 40-foot container. That is, the cost <strong>to</strong> ship a53-foot container is the same as shipping a 40-foot container. So transloadingthree 40-foot containers in<strong>to</strong> two 53-foot containers provide a major economicbenefit <strong>to</strong> shippers. This is also beneficial in terms of fewer truck trips generatedon the highways, which reduces roadway damage, and creates fuel savings, safety,congestion and environmental benefits.Standard truck trailers also appear in intermodal service in sizes ranging from28- <strong>to</strong> 53-feet long. In the year 2000, 51 percent of intermodal traffic was in222
Chapter XVI – Major Freight Issuesinternational containers, 23 percent in domestic containers, and 26 percent in trucktrailers. Truck trailers and containers are handled on railcars in a variety of ways:• Container-on-Flatcar (COFC) Containers are placed directly on standardflatcars. A 90-foot flatcar will accommodate up <strong>to</strong> four TEUs.• Trailer-on-Flatcar (TOFC) Over-the-road trailers or containers mounted ontruck chassis are placed directly on flatcars. Standard flatcarsaccommodate one or two units; specialized spine cars take up <strong>to</strong> five.• Double-Stack Containers are placed two-high, one on <strong>to</strong>p of the other, in aspecial low-profile “well car.” Well cars may accommodate as few as twocontainers, or as many as 10 containers depending on their length (e.g.,45-foot, 48-foot, or 53-foot containers can be stacked on <strong>to</strong>p of two 40-foo<strong>to</strong>r two 20-foot containers). By stacking the containers, railroads can double(or more than double) the number of containers carried on a train,improving productivity and effective capacity, and reducing unit costs.Au<strong>to</strong>mobiles are generally carried in specialized railcars that accommodate eithertwo or three levels of vehicles. The vehicles are driven on<strong>to</strong> and off of therailcars. Both the “bi-level” and “tri-level” au<strong>to</strong> carriers have high verticalprofiles and require overhead clearances similar <strong>to</strong> double-stack container traffic.In one typical movement, au<strong>to</strong>s are loaded at the production plant, taken <strong>to</strong> anunloading ramp where they are driven off and parked, and then are reloaded on<strong>to</strong>au<strong>to</strong>-rack trailers for final highway delivery by truck <strong>to</strong> dealerships. Anothertypical movement is movement between marine terminals and inlandconsolidation/distribution facilities or “mixing centers.”Intermodal service accommodates higher-value, lower-weight commodities thanunit train or carload services. The service offers faster speeds, higher trainfrequency, better schedule reliability, and more visibility en route – albeit at ahigher price – and is competitive with door-<strong>to</strong>-door trucking over longer distances(generally starting at 400 <strong>to</strong> 500 miles, depending on the equipment and corridor).The most efficient and cost-effective intermodal service is the unit train, which isthe preferred method for serving high-volume corridors. Intermodal railcars canalso be handled in combination with carload traffic, as part of mixed merchandisetrains. Although this can be costly, especially on routes that provide overheadclearance for single-stack intermodal cars only, it allows intermodal service <strong>to</strong>reach lower-volume cus<strong>to</strong>mers.More than any other rail service, intermodal depends on partnerships withtrucking companies, seaports, and others in the transportation logistics chain.Each container or trailer or set of au<strong>to</strong>mobiles is an individual shipment, and thereare a vast number of origins and destinations <strong>to</strong> be served. In response, bothrailroads and truckers have recognized that the best approach <strong>to</strong> this market is <strong>to</strong>let each mode do what it does best. <strong>Rail</strong>roads handle the long-haul movement of223
<strong>2007</strong>-<strong>08</strong> – <strong>2017</strong>-<strong>18</strong> <strong>California</strong> <strong>State</strong> <strong>Rail</strong> <strong>Plan</strong>large quantities of containers and trailers between major hubs such as seaports andmajor population centers, while truckers handle the short-haul movement <strong>to</strong>/fromthe cus<strong>to</strong>mer’s “front door.”For example, merchandise manufactured and packed in a container in China maybe imported <strong>to</strong> the United <strong>State</strong>s through the Port of Long Beach, trucked <strong>to</strong> thenearby intermodal container transfer facility, loaded on<strong>to</strong> a double-stack unit train,moved by rail <strong>to</strong> Chicago, transferred across <strong>to</strong>wn by truck from a western railroad<strong>to</strong> an eastern railroad, moved by rail <strong>to</strong> north Jersey, transferred <strong>to</strong> truck, taken <strong>to</strong> anearby distribution center where the contents are transferred <strong>to</strong> smaller trucks, andfinally delivered by van <strong>to</strong> a cus<strong>to</strong>mer in Brooklyn. This type of internationalmove, where rail is used <strong>to</strong> complete a journey begun via water, is loosely called a“landbridge” move.Much of intermodal traffic is in higher-value consumer products and in importexporttraffic. This creates two distinct patterns: high demand for suitable railcarequipment leading up <strong>to</strong> and during seasonal shopping periods; and theconcentration of intermodal rail traffic along a relatively few, high-densitycorridors connecting the nation’s leading container ports and its primary consumermarkets. The most significant flows are from the west coast container ports ofLong Beach, Los Angeles, Oakland, Portland, Tacoma, and Seattle throughChicago <strong>to</strong> New York and northern New Jersey.In the year 2000, intermodal trains carried 199 million <strong>to</strong>ns over 421 billion <strong>to</strong>nmiles.This is the equivalent of 16.2 billion truck miles. While not nearly as highas the figures for unit train and carload, these are significant numbers. Within thecommodity groups served by intermodal, rail handles over 16 percent of the<strong>to</strong>nnage, which is twice the figure for carload, indicating a deeper penetration byrail in<strong>to</strong> this market. Intermodal has been one of the fastest-growing segments ofthe rail industry.LOGISTICS PRACTICESIn the past two decades, passenger and freight movement over the nation’stransportation system have increased dramatically. Vehicle-miles-of-travel bypassenger cars and trucks grew by 72 percent while road-lane-miles grew by onlyone percent. Over the same period, <strong>to</strong>n-miles of freight moving over the nation’srailroads increased by 55 percent while system mileage actually declined.The fac<strong>to</strong>rs that have driven this growth in freight movement in the past twodecades are growth in population, domestic production, international trade, andtransportation-intensive production and distribution logistics.Between 1970 and 2000, the U.S. gross domestic product (GDP) increased from$3.5 trillion <strong>to</strong> almost $9 trillion – an increase of 250 percent. Over the threedecades, growth in GDP averaged 3.2 percent per year. During this same period,international trade in goods and services increased from $350 billion (equivalent224
Chapter XVI – Major Freight Issues<strong>to</strong> 10 percent of GDP) <strong>to</strong> over $2.4 trillion (equivalent <strong>to</strong> 27 percent of GDP) –a sevenfold increase.The three components of <strong>to</strong>tal logistics expenditures are administrative cost(management, insurance, warehousing, etc.), transportation cost (purchase oftransportation services), and inven<strong>to</strong>ry carrying cost. Between 1978 and 1998, thegovernment’s economic regulation of the airline, trucking, railroad, and oceanshipping industries was reduced sharply. As competition increased, transportationfirms were consolidated, merged, and restructured; operating networks wereexpanded; and freight rates were cut. Investments were made in larger trucks,double-stack trains, and mega-containerships; satellite communication and GPSvehicle-location systems were installed in trucks, trains, and ships; and new andbetter coordinated intermodal services were introduced.Shippers <strong>to</strong>ok advantage of the lower freight rates and improved services <strong>to</strong> adoptnew, just-in-time logistics strategies. Just-in-time operations allow businesses <strong>to</strong>substitute lower-cost transportation for high-cost inven<strong>to</strong>ry, achieving hugereductions in inven<strong>to</strong>ry carrying costs, and benefiting shippers, consumers, and theeconomy. Just-in-time logistics involves a shift from push <strong>to</strong> pull logisticssystems — from manufacture-<strong>to</strong>-supply or inven<strong>to</strong>ry-based logistics <strong>to</strong>manufacture-<strong>to</strong>-order or replenishment-based logistics.In a push system, suppliers push materials <strong>to</strong> a manufacturer, who pushes thecompleted product <strong>to</strong> a distribu<strong>to</strong>r, who supplies the retailer, who fills thecus<strong>to</strong>mer’s order. Each maintains an expensive inven<strong>to</strong>ry of parts and products asa buffer against fluctuations in supply and demand.A pull system relies less on expensive inven<strong>to</strong>ry and more on accurateinformation and timely transportation <strong>to</strong> match supply and demand. Inputmaterials are received just prior <strong>to</strong> production, and as little finished product aspossible is maintained in inven<strong>to</strong>ry. Point-of-sale data are used <strong>to</strong> pull productsthrough a system that may involve two or three tiers of suppliers; a manufacturerthat has spun off design and marketing functions <strong>to</strong> other firms; and a third-partylogistics provider who coordinates the movement of parts and products <strong>to</strong>distribu<strong>to</strong>rs or directly <strong>to</strong> cus<strong>to</strong>mers.Where the push model places a premium on fixed assets such as warehousing, thejust-in-time pull model places a premium on the reliability and timeliness of thetransportation system and substitutes time spent in the transportation network(highway, railway, ship, etc.) for time spent in the warehouse. But warehousingand distribution centers still play a major role in pull logistics. Businesses such asWal-Mart, Home Depot, Target, and K-Mart import huge amounts of cargothrough international seaports, move them <strong>to</strong> major regional distribution centers,and then <strong>to</strong> satellite distribution centers and local outlets as needed. <strong>California</strong> hasmany such centers located strategically through the <strong>State</strong>. These centers are225
<strong>2007</strong>-<strong>08</strong> – <strong>2017</strong>-<strong>18</strong> <strong>California</strong> <strong>State</strong> <strong>Rail</strong> <strong>Plan</strong>primarily in the Inland Empire and Greater Los Angeles areas, and also in theCentral Valley and San Francisco Bay Area regions.The big change has been in the efficiency of these warehousing operations, interms of reduced inven<strong>to</strong>ry time, improved management and operations, andimproved connections within the freight transportation network. The past decadehas seen substantial growth in the development of very large warehousing centerson the urban periphery, far enough out that land is less expensive, yet near enoughand well-served enough by highway and rail <strong>to</strong> effectively serve major populationcenters. For example, major warehousing clusters have emerged in central NewJersey (<strong>to</strong> serve the New York/North Jersey market) and in theHarrisburg/Lancaster area (which is well-positioned <strong>to</strong> serve New York,Philadelphia, Wilming<strong>to</strong>n, Baltimore, and Washing<strong>to</strong>n).Similar warehousing clusters have developed in the Greater S<strong>to</strong>ck<strong>to</strong>n/Tracy areaand are serving such facilities as the New United Mo<strong>to</strong>r Manufacturing, Inc(NUMMI). NUMMI is the pioneering joint venture of General Mo<strong>to</strong>rsCorporation and Toyota Mo<strong>to</strong>r Corporation. Established in Fremont, <strong>California</strong>,in 1984, NUMMI helped change the au<strong>to</strong>mobile industry by introducing theToyota Production System and a teamwork-based working environment <strong>to</strong> theUnited <strong>State</strong>s. NUUMI has made a recent business decision <strong>to</strong> have all of theirmanufacturing suppliers move <strong>to</strong> the S<strong>to</strong>ck<strong>to</strong>n/Tracy are so that they may be betterserved. This includes partners from the U. S. Midwest and also from Japan.Talks are currently underway <strong>to</strong> create rail served facilities in the S<strong>to</strong>ck<strong>to</strong>n/Tracyareas for NUUMI and its partners. Warehousing clusters have occurred and willcontinue <strong>to</strong> occur throughout various strategic locations in the <strong>State</strong> and will needfreight rail servicesE-commerce benefits pull systems because it allows cus<strong>to</strong>mer orders <strong>to</strong> becommunicated directly <strong>to</strong> distribu<strong>to</strong>rs, manufacturers, and suppliers. Fulfillmen<strong>to</strong>f e-commerce and mail orders depends on door-<strong>to</strong>-door transportation of parceland express packages directly <strong>to</strong> the cus<strong>to</strong>mer, increasing demand for smallshipments that would otherwise get picked up at a s<strong>to</strong>re by the cus<strong>to</strong>mer. Businessuse of express delivery services such as Federal Express and UPS, which place apremium on reliability, speed and visibility, has also contributed <strong>to</strong> the explosivegrowth of package and parcel traffic. Federal Express and UPS maintain vastwarehouse and distribution centers supporting their operations. They rely heavilyon air and truck, although UPS also uses intermodal rail.Pull systems are tremendously efficient. They can produce what the cus<strong>to</strong>merwants and deliver it when the cus<strong>to</strong>mer wants. By reducing the time betweenmanufacture and sale, businesses can be more certain about how much they shouldproduce and the cost of carrying extra inven<strong>to</strong>ry of expensive parts and products.However, pull logistics systems place tremendous demands on the transportationsystem. Shippers operating manufacture-<strong>to</strong>-order and time-definite-delivery226
Chapter XVI – Major Freight Issuessystems must have reliable, timely, and visible door-<strong>to</strong>-door freight transportation.Shippers increasingly send frequent, smaller shipments rather than fewer largerones, multiplying the opportunity for something <strong>to</strong> go wrong. An accident,congestion, labor disputes, s<strong>to</strong>rms – even unanticipated spikes in supply anddemand – can unravel these tightly strung systems. Overall logistics systemscapabilities are growing simultaneously more robust and more fragile.The armed forces also are adopting pull logistics techniques and integrating theirlogistics systems with commercial freight systems <strong>to</strong> reduce deployment time andcost. Under peacetime conditions, the military is just another very large shipper.But with its new doctrine of rapid response, future wartime military deploymentswill likely occur as short, sharp surges. Large-scale deployments will stress thefreight transportation system and could disrupt the tightly strung logisticsnetworks of civil commerce and defense industry production.Shippers and the economy have benefited from these changes, but they are farmore reliant on timely, reliable freight service than they were 20 or 30 years ago.The consequences of service failure <strong>to</strong>day matter far more than they did in thepast. Service failures <strong>to</strong>day mean: depletion of critical materials and s<strong>to</strong>cks;degraded product quality – from rapid (days) <strong>to</strong> immediate (hours); idled workers,equipment, and cus<strong>to</strong>mers; loss of market share and profits; and an increasing riskthat failures in one part of the chain will ripple through more than one firm andmore than one business sec<strong>to</strong>r.Therefore, it is not surprising that the freight transportation modes offering thehighest levels of service are also growing the fastest. Air cargo has grown by17.9 percent annually; truck by 6.9 percent annually; and rail intermodal by4.6 percent. <strong>Rail</strong> carload and bulk grew just 1.4 percent annually, while domesticwaterborne trade declined by 0.5 percent annually.However, the productivity returns from deregulation, the capacity investmentsmade in the 1970s and 1980s, and the introduction of just-in-time logistics arediminishing. There are relatively few opportunities for further economicderegulation. Congestion is increasing; the impact is most noticeable inmetropolitan areas where peak-period travel times have risen significantly andtravel-time predictability has dropped. After two decades of improvement, <strong>to</strong>tallogistics costs appear <strong>to</strong> have stalled at 10 percent of GDP, and there are someindications that costs – especially wages, insurance, and fuel costs – are beginning<strong>to</strong> rise again. These trends are expected <strong>to</strong> continue in<strong>to</strong> the coming decades,suggesting that it is time <strong>to</strong> think about new strategies <strong>to</strong> meet the nation’s freighttransportation needs in the 21st century.227
<strong>2007</strong>-<strong>08</strong> – <strong>2017</strong>-<strong>18</strong> <strong>California</strong> <strong>State</strong> <strong>Rail</strong> <strong>Plan</strong>OPERATIONAL CONFLICTS: PASSENGER/FREIGHT;FREIGHT/FREIGHTSHARED USE OF RIGHTS-OF-WAYIn many areas of the <strong>State</strong>, passenger services share rail rights-of-way (ROW)with freight railroads. For both passenger and freight railroads sharing a ROW,a primary issue is the capacity of the route <strong>to</strong> accommodate all train movements.Before a freight railroad grants a passenger opera<strong>to</strong>r use of its facilities, therailroad will require various capacity improvements <strong>to</strong> ensure the reliability ofboth freight and passenger services. The cost of these improvements may beborne by the passenger opera<strong>to</strong>r or can be shared.Freight railroads and various public agencies have entered in<strong>to</strong> negotiations for theuse of freight rail lines for commuter and intercity passenger services. Some ofthe freight railroads sold their lines <strong>to</strong> the passenger opera<strong>to</strong>rs but retained therights <strong>to</strong> provide freight services on them. In <strong>California</strong>, shared use of ROWincludes:• <strong>State</strong>-sponsored Amtrak intercity service routes: Pacific Surfliner,San Joaquin, and Capi<strong>to</strong>l Corridor.• The Southern <strong>California</strong> Metrolink commuter rail system.• The San Diego County Coaster commuter rail system.• The Caltrain commuter rail system in the San Francisco Bay Area.• The Altamont Commuter Express (ACE) rail system.In recent years, ridership and train service has increased on all commuter andintercity rail lines in <strong>California</strong>. Passenger opera<strong>to</strong>rs have plans for adding moretrains over the next several years. In some cases, capacity has proven insufficient<strong>to</strong> handle existing levels of both freight and passenger service, particularly inmetropolitan areas with substantial freight and passenger traffic. For example, in2004, Metrolink trains operated on time 95 percent of the time on Metrolinkcontrolled trackage. On the tracks owned by UP and BNSF, Metrolink trainsoperated on time 70 <strong>to</strong> 85 percent of the time.Freight interference causes major operating problems for Metrolink especially onUP's Los Angeles Subdivision between Riverside and Los Angeles. Heavy UPport rail traffic results in Metrolink trains operating late almost on a daily basis.Heavy BNSF port rail traffic on their San Bernardino Subdivision between LosAngeles and San Bernardino also causes delays for Metrolink trains.JOINT DISPATCHING OF FREIGHT OPERATIONSThere are operational conflicts between the Class I railroads themselves. Theseconflicts, when combined with those arising from shared use of the right of way,create additional capacity constraints for both the passenger and the freight rail228
Chapter XVI – Major Freight Issuessystems. For example, five Class I rail segments have joint freight trainoperations.Three segments are owned and dispatched by the UP:• The UP Sacramen<strong>to</strong> and Canyon Subdivisions between S<strong>to</strong>ck<strong>to</strong>n and theNevada <strong>State</strong> Line via Sacramen<strong>to</strong> and the Feather River Canyon.• The UP Martinez and Roseville Subdivisions between Oakland and theNevada <strong>State</strong> Line via Donner Summit.• The UP Mojave Subdivision between Bakersfield and Mojave.Two segments are owned and dispatched by the BNSF:• The Mojave Subdivision between Mojave and Bars<strong>to</strong>w.• The Cajon and Needles Subdivisions between San Bernardino and Daggett.As priority will typically be given <strong>to</strong> the actual owner of the right of way, tenantrail opera<strong>to</strong>rs (passenger or freight) will be delayed, leading <strong>to</strong> system bottlenecks.Geography can also lead <strong>to</strong> delays, such as those experienced by train setsnavigating the Tehachapi Pass in Southern <strong>California</strong>.FRESNO RAIL CONSOLIDATIONCurrently, both UP and BNSF operate freight service through the City of Fresno.There is considerable public support <strong>to</strong> consolidate both rail lines on<strong>to</strong> the UP railcorridor <strong>to</strong> the west of down<strong>to</strong>wn Fresno. Many important issues need <strong>to</strong> beresolved including how <strong>to</strong> service existing freight cus<strong>to</strong>mers, operational questionsand optimal track structure required <strong>to</strong> accommodate the increased traffic on theUP. A study by the Fresno Council of Governments determined that consolidationof the two lines is technically and operationally feasible but at a very high cost.MAJOR ISSUES FOR CALIFORNIA RAIL SHIPPERSThe Department participated in a study entitled the Western Transportation TradeNetwork (WTTN) in the 1990s, which surveyed 53 shippers in 13 western statesfor their perspectives on Class I railroad performance. Two issues of primaryconcern <strong>to</strong> the shippers were (1) reliable transit times and (2) car availability andcondition. Interestingly, the cost of rail service and effective cus<strong>to</strong>mer servicewere of substantially less interest <strong>to</strong> shippers than those two issues.Given the importance of intermodal traffic <strong>to</strong> railroads in <strong>California</strong>, the focus ofthis effort was on intermodal shippers. One company studied was a <strong>California</strong>intermodal marketing company (IMC), which leases trailers and containers fromboth railroads and “stack train opera<strong>to</strong>rs” and solicits loads for this equipmentfrom shippers for transport in rail intermodal service <strong>to</strong> points throughout NorthAmerica. The other was a container train opera<strong>to</strong>r who owns containers and paysthe railroads <strong>to</strong> deliver their containers <strong>to</strong> points throughout North America.Of particular concern <strong>to</strong> both of these parties were the following issues:229
<strong>2007</strong>-<strong>08</strong> – <strong>2017</strong>-<strong>18</strong> <strong>California</strong> <strong>State</strong> <strong>Rail</strong> <strong>Plan</strong>• Congested intermodal terminals that delay shipments.• Lack of containers and rolling s<strong>to</strong>ck <strong>to</strong> handle traffic in and out of Southern<strong>California</strong>.• Congestion on main lines and in terminals of eastern railroads that delaysshipments <strong>to</strong> and from <strong>California</strong>.• Information technology problems causing lost rail cars.• Delays <strong>to</strong> rail shipments related <strong>to</strong> increasing shared use of main lines bycommuter and intercity passenger operations.Although the report is some years old its basic findings are still relevant.An updated study is warranted <strong>to</strong> ensure that the most current information isavailable for use by the public and its decision-makers.Freight transportation is the foundation of economic development and regional,national, and global trade. As the freight rail system is improved, the commuterand passenger rail systems also are improved and help relieve congestion on thehighway system.SHORT LINE RAILROAD ISSUESShort line railroads play an important role in moving goods <strong>to</strong> and from <strong>California</strong>regions and local communities. The commodities moved tend <strong>to</strong> have a lowtransportation cost <strong>to</strong> weight/volume ratio, which contributes <strong>to</strong> their attraction <strong>to</strong>short lines, instead of trucks.There are 27 short line and regional railroads in <strong>California</strong> <strong>to</strong>day. Most of themare privately owned and employ between ten and 50 employees. Revenues for themajority of the short lines are less than $5 million annually.None of the short lines have revenues exceeding $40 million per year. Operatingcosts were not cited. However, in <strong>California</strong>, operating costs range from about75 percent <strong>to</strong> 110 percent of revenues. The latter figure would suggest that shortlines with operating costs higher than revenue have other income sources such asincome from rental property or lease income from placement of utilities in theirrights of way.INTERFACE WITH CLASS I RAILROADSThe short-lines are formed from competitive bids for track spun off by largerrailroads, and the relatively high purchase prices that result can bring with themsignificant capital costs. In addition, the lines contend for traffic in maturemarkets against other rail as well as trucking alternatives. The central issues forthe short-lines are two forms of dependence: on Class I connections for theirmarket viability, and on carload traffic for their baseload volume. As Class Isystems demarket the carload freight – or simply as its market share continues <strong>to</strong>decline – short-line roads are threatened with marginalization. Although creative230
Chapter XVI – Major Freight Issuesmarketing, efficient operation and financial support can help, the crucialrequirement will be the profitable handling of carload traffic for the Class I roads.Short line interface with the Class I <strong>Rail</strong>roads in <strong>California</strong>, the Union Pacific<strong>Rail</strong>road (UPRR) and Burling<strong>to</strong>n Northern Santa Fe <strong>Rail</strong>way (BNSF), is at timesproblematic. Interface in this case meaning pick up and delivery of mostly mixedcarload commodities. In conversations with the <strong>California</strong> Short Line <strong>Rail</strong>roadAssociation (CSLRRA) they state that the Class Is for the most part providerelatively good service and that <strong>to</strong> say there’s a larger problem in <strong>California</strong> is notquite accurate. The Class Is are generally not geared <strong>to</strong>wards providing the sameservice level <strong>to</strong> all cus<strong>to</strong>mers, so generally speaking the smallest cus<strong>to</strong>mers don’tget quite the same level of service as larger cus<strong>to</strong>mers who provide regular,predictable, larger volumes.TRACK INFRASTRUCTURE CAPABILITYA major trend in the railroad industry is the use of heavier rail cars as a means ofmaximizing load potential, thereby generating cost savings. The upper limit ofthese new car weights has been increased <strong>to</strong> 286,000 pounds and in some cases <strong>to</strong>315,000 pounds. To handle these heavier cars, short lines must have track,roadbed, and bridges capable of handling the increased loads. This means asubstantial investment that many short lines cannot afford given the limitedrevenues that they earn moving cars between shippers and the Class I railroads.Without the necessary infrastructure, many of the commodities moving by rail<strong>to</strong>day have <strong>to</strong> be hauled by trucks <strong>to</strong> and from transload facilities located at majorrailroads. This shift from short line rail <strong>to</strong> trucks will further congest the <strong>State</strong>’shighway system, create more traffic delays, and increase air pollution and highwaymaintenance costs. The loss of revenue <strong>to</strong> short line railroads could force some <strong>to</strong>go out of business leaving some <strong>California</strong> rail shippers without rail services.The additional truck transportation costs will have <strong>to</strong> be passed on <strong>to</strong> consumers,making goods more costly <strong>to</strong> purchase.CAPITAL AVAILABILITYSecuring adequate funding for infrastructure upgrades and other capitalinvestments is the most pressing issue for independently owned and operated shortlines. Some short line railroads were spin-offs from the Class I railroads and werealready suffering from years of deferred maintenance when created. Maintenanceof-wayprocedures on these railroads typically are highly labor intensive andexpensive. Because short line railroads operate on low profit margins they areunable <strong>to</strong> take on major infrastructure improvement projects. The major freightrailroads are pursuing such strategies as legislation <strong>to</strong> allow them <strong>to</strong> claim taxcredits for infrastructure and equipment investments. They believe that the currentsystem, which limits or prohibits this, places them in an unfair competitiveadvantage compared <strong>to</strong> others in the goods movement sec<strong>to</strong>r.231
<strong>2007</strong>-<strong>08</strong> – <strong>2017</strong>-<strong>18</strong> <strong>California</strong> <strong>State</strong> <strong>Rail</strong> <strong>Plan</strong>The <strong>California</strong> Short Line <strong>Rail</strong>road survey is being compiled at present and theresults will be available for the Oc<strong>to</strong>ber <strong>2007</strong> Final <strong>Rail</strong> <strong>Plan</strong>. (See Appendix )RAIL SYSTEM PRESERVATIONConstruction of the nation’s rail network started in <strong>18</strong>28. The system expandedrapidly in the late <strong>18</strong>00s and early 1900s. System mileage peaked in the 1920s, atapproximately 380,000 miles of track. Since that time, the rail network has beenmodernized, rationalized, and downsized <strong>to</strong> a core network whose route system isdescended directly from its 19th century design. The Class I railroad system <strong>to</strong>dayhas 172,000 miles of track, less than half the number of miles it had in the 1920s.The reduced size of the <strong>California</strong> and nation’s freight-rail network is the result oftwo fac<strong>to</strong>rs: competition with the trucking industry and deregulation. As privatebusinesses face stiff rate competition from trucks and shareholder pressure <strong>to</strong>generate profits, the nation’s major railroads have disinvested in lines and serviceswith insufficient traffic density <strong>to</strong> adequately cover operating and maintenancecosts.<strong>California</strong>’s two Class I railroads have some 5,488 miles of track. Total activetrack miles (including short line railroads) are 7,335 miles. To improveproductivity and profitability and maximize available capacity the railroads haveinvested in double-stack cars, larger hopper and tank cars, and higher boxcars andau<strong>to</strong>-rack cars, which in turn require investment in high-clearance tunnels, higherweight-capacitytrack, and stronger bridges. The high cost of these improvementshas limited railroads <strong>to</strong> upgrading only the highest volume and most profitablelines. Other lines have been downgraded or abandoned.Many states believe that freight-rail service is vital <strong>to</strong> their economies and havemade freight-rail service, especially the preservation and retention of lowerdensitybranch lines, a significant part of their economic development andtransportation programs. <strong>Rail</strong> service also can act as a catalyst for redevelopingurban corridors and underutilized rail-served brownfields as “integrated logisticscenters” – concentrations of rail-served warehousing, distribution, andmanufacturing – with efficient rail and truck service.Therefore, it is critical <strong>to</strong> keep an inven<strong>to</strong>ry of inactive, underutilized, andabandoned rail segments and rail corridors for possible increased and or futureusages. While rail rights of way can be rail banked and saved for the futuretheoretically, in practice this almost never occurs. Rather, often rail is removedand the rights of way are then used for recreational purposes such as bike, horse orpedestrian trails, or are sought for purchase by real estate developers. Typicallythe rail will be removed and salvaged by the previous or new owners, for profit.One consequence of rail removal is that the right of way renewal for rail is subject<strong>to</strong> the public hearing and environmental review processes. Often public raisesobjections <strong>to</strong> res<strong>to</strong>ring any type of rail service, the rail corridor is never again232
Chapter XVI – Major Freight Issuesres<strong>to</strong>red, and is lost forever. If rail is not removed the public hearing andenvironmental review processes are not required.TRUCK DIVERSION TO RAIL, SHORT-HAUL RAILSHUTTLESInterstate-5 is one of our nation’s most heavily used routes for both au<strong>to</strong>mobileand truck traffic. Absent improvements, the Highway Performance Moni<strong>to</strong>ringSystem (HPMS) projections of the year 2020 highway traffic for I-5 indicate levelof service E and F for virtually the entire distance between San Diego and the SanFrancisco Bay Area, as well as for metropolitan Portland and Seattle/Tacoma.The deteriorating condition of I-5 makes it even more imperative <strong>to</strong> considerstrategies <strong>to</strong> improve the ability of the rail system <strong>to</strong> absorb freight traffic.The share of potential intermodal (containerized freight) rail traffic actuallycaptured by intermodal rail is 17 percent. While this is better than many corridors,the fact that the average length of a truck haul in the corridor is 936 miles –a distance at which rail intermodal is highly competitive with truck – suggeststhere is room <strong>to</strong> improve on this share.Failing <strong>to</strong> achieve the base case forecast would reduce rail <strong>to</strong>nnage by up <strong>to</strong>43 percent and increase truck <strong>to</strong>nnage by up <strong>to</strong> 19 percent between the selectedorigin-destination pairs. Truck traffic in the corridor would increase up <strong>to</strong>6.3 billion <strong>to</strong>n-miles, or 451 million truck miles traveled, in the year 2020.An approximately conversion of rail <strong>to</strong> truck is 2.2 truck trips are required <strong>to</strong> moveone intermodal container (FEU), and 3.3 truck trips are required <strong>to</strong> move one carload of bulk freight.ELEMENTS NEEDED TO SUPPORT SHORT HAUL INTERMODALRAIL SERVICEForeign trade is a corners<strong>to</strong>ne of <strong>California</strong>’s prosperity. Transportation ofinternational containers is <strong>California</strong>’s lifeline <strong>to</strong> foreign markets, but that lifelineis threatened. If importers and exporters must rely on increasingly congestedfreeways <strong>to</strong> move their goods, both their ability <strong>to</strong> compete and the state’s ability<strong>to</strong> grow will be jeopardized. If that occurs these shippers will locate elsewhere.Short haul intermodal rail service can provide a solution that benefits the goodsmovement industry, and provides public benefits such as congestion mitigation,safety, fuel savings, reduced emissions and roadway preservation.The Class I railroads are reluctant <strong>to</strong> use scarce capacity for low-revenue, shorthaulintermodal moves if those moves displace higher-yielding long-haul business.In order <strong>to</strong> make the economics work for short-haul intermodal rail service thefollowing elements must be present.• To be attractive <strong>to</strong> the railroads, the service must either offer a comparableprofit margin, arrange <strong>to</strong> augment capacity, or achieve some balance233
<strong>2007</strong>-<strong>08</strong> – <strong>2017</strong>-<strong>18</strong> <strong>California</strong> <strong>State</strong> <strong>Rail</strong> <strong>Plan</strong>between profit and capacity. An ongoing subsidy may be necessary <strong>to</strong>manage, market and operate the service.• There must be inland intermodal freight and transload facilities that can beeasily accessed and served by rail and trucks, close <strong>to</strong> where shippers haveexisting operations.• Operation of night trains for shippers is crucial; it would allow for extendedcu<strong>to</strong>ff times and make it easier <strong>to</strong> load trains.EXAMPLES OF SUCCESSFUL SHORT HAUL INTERMODAL RAILSERVICEQuincy, Washing<strong>to</strong>n <strong>Rail</strong> Transload FacilityThis project created a transload facility where trucks and containers can be loadedon and off railcars. A 400-acre staging area for trains and trucks <strong>to</strong> transload theircargos was constructed, including double-stack train staging tracks, paving,fencing, lighting, and security. Construction was completed in April 2005 andwas funded with $2 million in new and used vehicle sales tax monies and$3 million in federal funds.Virginia Inland Port (VIP)The VIP offers all services one would expect at a well-run port terminal; domesticand international train service six days a week provided by Class I railroadNorfolk Southern (NS), handling and warehousing, U.S. Cus<strong>to</strong>ms, flexibleoperating hours and a chassis pool. The VIP provides an interface between truckand rail for the transport of ocean-going containers <strong>to</strong> and from The Port ofVirginia. Containers arriving from Hamp<strong>to</strong>n Roads seaport terminals are railed <strong>to</strong>the VIP and then dispatched by truck <strong>to</strong> inland destinations. The current facilityhas some 40 acres of pavement, 17,820 feet of rail track and is located 220 milesinland from the Port of Virginia, which is comprised of the Ports of NewportNews, Norfolk International and Portsmouth Marine Terminals.Short haul rail shuttle service between the San Francisco Bay Area andSan Joaquin Valley would greatly reduce truck trips over the Altamont Pass.Truck trips would also be reduced in the I5 and Highway 99 corridor betweenS<strong>to</strong>ck<strong>to</strong>n and Bakersfield. The two Class I railroads have been approached atdifferent times with short haul proposals but as of yet have not offered <strong>to</strong>participate in any service. Similar short haul rail shuttle service has also beendiscussed with regard <strong>to</strong> the Inland Empire of Southern <strong>California</strong> but as of yetthere is no service.The primary issue is length of haul. The distance at which the economics becomefavorable for the large railroads is approximately 500 miles. Without a subsidy,short haul freight is not economically feasible for Class I railroads. Withincreasing congestion occurring in <strong>California</strong> the economics of short haul rail inthe <strong>State</strong> may be on the horizon.234
Chapter XVI – Major Freight IssuesPUBLIC/PRIVATE SECTOR COORDINATIONCoordination between Caltrans, various Metropolitan <strong>Plan</strong>ning Organizations(MPO), Regional Transportation <strong>Plan</strong>ning Agencies (RTPA), TransportationCommissions, Tribal organizations, environmental organizations, private shippers,logistics firms, trucking firms, warehousing and distribution centers, the railroads,intercity rail organizations, and all stakeholders is critical <strong>to</strong> achieving a trulyintegrated and optimal freight rail system in <strong>California</strong>.In Southern <strong>California</strong>, SCAG, SANDAG, SANBAG, RCTC, Gateway CitiesCOG, other various cities, counties, the Ports of Los Angles, Long Beach,San Diego, Hueneme, the BNSF and UP <strong>Rail</strong>roads, various short line railroads,shippers, community groups and others all influence freight rail in that region.In the <strong>California</strong> Central Valley, KernCOG, Fresno COG, StanCOG, SJCOG,Central Valley cities, counties, RTPAs, the BNSF, UP, and short line railroads, theagriculture industry, the Port of Oakland, SACOG and other similar stakeholdersinfluence this region.In the San Francisco Bay Area and Northern <strong>California</strong>, MTC, SACOG, the Por<strong>to</strong>f Oakland, shippers, trucking firms, railroads, environmental organizations andsimilar stakeholders influence this region.As one can readily see with regard <strong>to</strong> <strong>California</strong>, coordination between freight railand goods movement stakeholders both public and private is extremely complexand dynamic. As a result of this coordination awareness of freight rail and goodsmovement issues has reached an apex.Many projects and studies (appendix item) have come from this coordination butfreight rail generally only gets funding if it is part of a passenger rail project,currently through the Caltrans Division of <strong>Rail</strong>. With the passing of theProposition 1B Transportation Bond package, freight rail projects could be fundedseparately, but might also include a lesser passenger benefit.235
<strong>2007</strong>-<strong>08</strong> – <strong>2017</strong>-<strong>18</strong> <strong>California</strong> <strong>State</strong> <strong>Rail</strong> <strong>Plan</strong>236
Chapter XVII – Environmental ConsiderationsCHAPTER XVIIENVIRONMENTAL CONSIDERATIONSOVERVIEW<strong>California</strong>’s goods movement system performance depends upon a robust freightrail network. In addition <strong>to</strong> imports, railroads haul freight generated in <strong>California</strong>that is either exported or consumed within the state. <strong>Rail</strong>roads provide benefits inthe form of access <strong>to</strong> jobs and a variety of products. But these benefits can beoffset by serious health impacts related <strong>to</strong> goods movement. In communitiesadjacent <strong>to</strong> railroad and other freight facilities, cancer risk from nearby dieselsources is often significant and can, in some cases, exceed the regionalbackground levels..The transportation component of the Strategic Growth <strong>Plan</strong> is key <strong>to</strong> theGovernor’s vision <strong>to</strong> implement critical infrastructure improvements. <strong>California</strong>approved Proposition 1B <strong>to</strong> help fund, in part, improvements <strong>to</strong> both tradeinfrastructure and air quality. This includes $1 billion <strong>to</strong> reduce emissions fromfreight transportation activities statewide, for allocation by the <strong>California</strong> AirResources Board (CARB) subject <strong>to</strong> conditions and criteria enacted in SB 88.SB 88 created the Goods Movement Emission Reduction Program (GMERP) withthe intent of the Legislature <strong>to</strong> reduce health risks associated with goodsmovement along <strong>California</strong>’s trade corridors as early as possible. CARB isdirected <strong>to</strong> prioritize funding for projects that reduce emissions in <strong>California</strong>’smost heavily impacted communities in close proximity <strong>to</strong> freight transportationfacilities where localized health risks are highest.Projects eligible for GMERP funding include the replacement, repower, or retrofi<strong>to</strong>f diesel locomotive engines, with priority given <strong>to</strong> switcher locomotive engines.The Legislature also passed AB 201 <strong>to</strong> amend SB 88 and ensure that emissionreductions funded by the GMERP are not required under any existing agreements.<strong>California</strong>’s Goods Movement Action <strong>Plan</strong> (GMAP) is based on the Governor’svision of achieving “a Prosperous Economy, a Quality Environment, and SocialEquity” while addressing the state’s many infrastructure and environmental needs.CARB’s Emission Reduction <strong>Plan</strong> for Ports and Goods Movement in <strong>California</strong> iskey <strong>to</strong> specifically identifying and implementing the air quality goals outlined inthe GMAP.No one agency can independently achieve <strong>California</strong>’s goods movement goals.By working <strong>to</strong>gether as partners, decision-makers at all levels of government andin the private sec<strong>to</strong>r can create a world-class freight transportation system thatenhances our economy, supports our communities, safeguards our environment,237
<strong>2007</strong>-<strong>08</strong> – <strong>2017</strong>-<strong>18</strong> <strong>California</strong> <strong>State</strong> <strong>Rail</strong> <strong>Plan</strong>and positions <strong>California</strong> <strong>to</strong> remain competitive as a trading partner in the globaleconomy.AIR QUALITYEfforts <strong>to</strong> clean up <strong>California</strong>’s air are working. This is due <strong>to</strong> decades of hardwork and investments by citizens, government, and private business <strong>to</strong> identifyand develop new data, regulations, and technologies <strong>to</strong> reduce engine exhaustemissions. In spite of important gains, however, <strong>California</strong>ns continue <strong>to</strong> sufferfrom significant exposure <strong>to</strong> <strong>to</strong>xic air pollutants. Air pollution from internationaland domestic goods movement activities is still a major public health concern atcommunity and regional levels.The United <strong>State</strong>s Environmental Protection Agency (EPA) and <strong>California</strong> AirResources Board (CARB) have adopted regulations that impose increasinglystringent fuel and emissions standards over the next 10 years. Both agencies haveconducted extensive research and moni<strong>to</strong>ring of emissions in the most heavilyimpacted communities and concluded that <strong>to</strong>xic air pollutants can and should bereduced even further. The Federal Highway Administration (FHWA) and<strong>California</strong>’s Department of Transportation (Caltrans) have funded millions ofdollars of academic research through the University of <strong>California</strong> and <strong>California</strong><strong>State</strong> University systems <strong>to</strong> improve goods movement operations and reduce itsimpacts.Community based organizations (CBOs) have become more active andknowledgeable over the years. Through a process of public participation, CBOsand individual citizens have access <strong>to</strong> scientific data that document the harmfuleffects of diesel emissions and describe the cost <strong>to</strong> society. In spite ofimprovements, communities adjacent <strong>to</strong> freight facilities such as ports, rail yards,and warehouse distributions centers, still suffer health impacts disproportionate <strong>to</strong>the benefits they receive from increased trade and improved transportationfacilities. These organizations were actively involved in the development of theGoods Movement Action <strong>Plan</strong> (GMAP) and the Emission Reduction <strong>Plan</strong> for Portsand Goods Movement. Their input is reflected in both documents.In the Goods Movement Action <strong>Plan</strong>, the Schwarzenegger Administration hasmade <strong>California</strong>’s commitment clear that infrastructure improvements andenvironmental mitigation will be made simultaneously and continuously. CARBhas worked <strong>to</strong> develop innovative ways <strong>to</strong> accelerate the results of EPA standards.Union Pacific <strong>Rail</strong>road (UP) and Burling<strong>to</strong>n Northern Santa Fe <strong>Rail</strong>road (BNSF)have responded by entering in<strong>to</strong> voluntary agreements with CARB <strong>to</strong> reduceidling and emissions at 17 major rail yards throughout <strong>California</strong>.The GMAP establishes four specific goals for reducing goods movement airpollution impacts and mitigating localized health risks in affected communities <strong>to</strong>by2010, reduce emissions back <strong>to</strong> 2001 levels; by 2020, reduce diesel-related238
Chapter XVII – Environmental Considerationshealth risks 85 percent; cut emissions <strong>to</strong> attain federal air quality standards; andrapidly reduce localized health risks near goods movement facilities.Through its Emission Reduction <strong>Plan</strong> for Ports and Goods Movement, CARBidentified and is initiating specific actions necessary <strong>to</strong> achieve these goals ofreducing emissions and protecting public health. The <strong>Plan</strong> is <strong>California</strong>’sframework for coordinating community health risk assessments and plans, EPA airquality standards attainment and <strong>State</strong>wide Implementation <strong>Plan</strong>s, CARB’s DieselRisk Reduction <strong>Plan</strong> (2000), and the Goods Movement Action <strong>Plan</strong>.EMISSION INVENTORY/CHARACTERISTICSThe emission inven<strong>to</strong>ry is the foundation of the Air Resources Board’s EmissionReduction <strong>Plan</strong>. The inven<strong>to</strong>ry identifies the types and quantities of variouspollutants being emitted as well as where and when exposures are occurring.The inven<strong>to</strong>ry is a “snapshot in time”; though determined scientifically, itnecessarily includes emission estimates based on what is known at the time ofmeasurement and analysis. The <strong>Plan</strong> identifies 2001 emission levels for theinven<strong>to</strong>ry baseline and forecasts expected changes for 2020.There is a continual process at all levels of government, academia, and privateindustry <strong>to</strong> improve understanding of emissions, their effect on human health, andtechnologies <strong>to</strong> reduce their impact. Forecasts of future conditions in the emissioninven<strong>to</strong>ry include the benefits that will result from existing state and federal rulesand assumed growth rates for trade and population. As industry responds <strong>to</strong>existing rules, emissions from locomotive engines and heavy-duty trucks willdecrease from current levels. However, these emissions – primarily dieselparticulate matter (dPM), oxides of nitrogen (NOx) and oxides of sulfur (SOx) –cannot be reduced at a rate fast enough <strong>to</strong> achieve public health goals.Mobile sources of diesel emissions related <strong>to</strong> goods movement include harborcraft, cargo handling equipment (used at ports and rail yards), ocean-going vessels,heavy-duty trucks, and locomotive engines. ARB expects the most significantemission changes will be for trucks and locomotives. In the Draft <strong>Plan</strong>, ARBconsidered international trade movements in and through <strong>California</strong>. The final<strong>Plan</strong> includes all rail trips associated with domestic and international trademovements which increased identified locomotive emissions by a fac<strong>to</strong>r of two <strong>to</strong>three.ARB first began <strong>to</strong> develop a baseline inven<strong>to</strong>ry of locomotive emissions in 1987.The results were published in the Locomotive Emission Study (Booz-Allen &Hamil<strong>to</strong>n, 1991) and revised in the Report on Locomotive Emission Inven<strong>to</strong>ry:Locomotive Emissions by County (Booz-Allen & Hamil<strong>to</strong>n, 1992). The 1991report included an estimate of the emission inven<strong>to</strong>ry from locomotive operationsin the six non-attainment air basins with the highest levels of rail activity in<strong>California</strong> at that time. The 1992 revision provided additional information and239
<strong>2007</strong>-<strong>08</strong> – <strong>2017</strong>-<strong>18</strong> <strong>California</strong> <strong>State</strong> <strong>Rail</strong> <strong>Plan</strong>estimates, including individual inven<strong>to</strong>ries by county for the six air basinsidentified in the 1991 report, inven<strong>to</strong>ries for all other counties in the state with railactivities, and information on seasonal and daily variation in rail activity.The baseline inven<strong>to</strong>ry established and revised in these 1991 and 1992 reports wasbased on actual data by train type and air basin provided by the Class I railroads.Data were provided for specific segments of the rail system, including direction oftravel; number of trains; averages for miles, <strong>to</strong>ns, horsepower, and number oflocomotives; and time (in minutes) for brake and individual notches from onethrough eight. For its 2003 Almanac on Air Quality and Emissions, ARB updatedthe locomotive emission inven<strong>to</strong>ry using revised growth assumptions.Most recently, ARB made certain revisions <strong>to</strong> the inven<strong>to</strong>ry as part of its update <strong>to</strong>the “Off-Road <strong>2007</strong>” emissions model. ARB is currently working with UC Davisand the railroads <strong>to</strong> further refine the locomotive emission inven<strong>to</strong>ry, <strong>to</strong> becompleted in September 20<strong>08</strong>.AIR QUALITY AND EMISSION REGULATIONIn <strong>California</strong>, the EPA, ARB, and local air districts primarily regulate air quality.Air pollution control districts and air quality management districts are responsiblefor controlling air pollution for all sources other than mobile sources (althoughSouth Coast AQMD does have limited authority under state law over certain fleetsof 15 or more vehicles). CARB has responsibility for control of emissions frommobile sources. However, federal law preempts state and local control ofemissions from certain mobile sources, including new locomotives or locomotiveengines.The Federal Clean Air Act protects railroads and the interstate commerce theyrepresent from state interference and only allows states limited police powers <strong>to</strong>address nuisances, traffic disruption, or public safety. <strong>State</strong> air quality controls arerestricted <strong>to</strong> measures that do not affect the locomotive engines themselves.EPA has sole authority <strong>to</strong> adopt and enforce locomotive emission standards forboth new and remanufactured locomotives.In 1997, EPA adopted the first emission regulation for diesel locomotives, whichbecame effective from 2000 [63 FR <strong>18</strong>997-19804, 16 April 1998]. This 1997 ruleestablished Tier 0 through 2 emission standards for NOx, HC, CO, PM, and smokefrom new and remanufactured locomotives and locomotive engines.EPA classifies locomotives built before 1973 as “pre-controlled”. Locomotivesbuilt from 1973 <strong>to</strong> 2001 are in Tier O, Tier 1 describes those built in 2002 <strong>to</strong> 2004,and Tier 2 are 2005 and newer locomotives. Tiers 0 through 2 standards are metwithout the use of exhaust gas after treatment.In March <strong>2007</strong>, EPA proposed Tier 3 standards in a three-part program <strong>to</strong> cutemissions of PM by 90 percent and of NOx by 80 percent from all line-haul,passenger, and switch locomotives manufactured after 1972 except for existing240
Chapter XVII – Environmental Considerationsfleets owned by very small railroads. First, under the new program, emissionstandards would be tightened for existing locomotives when they areremanufactured (by 2013 for Tier 2 engines but by 2010 for Tiers 0 and 1.)Second, Tier 3 engine-out standards for newly built locomotive engines wouldphase in beginning in 2009. Third, EPA is proposing Tier 4 emission standardsbased on catalytic after treatment and the use of diesel fuel with sulfur contentcapped at 15 parts per million. Tier 4 standards for locomotives would phase inbeginning in 2015 with 95 percent control of PM and 90 percent control of NOxby <strong>2017</strong>.The Air Resources Board works <strong>to</strong> reduce emissions from locomotives and railyard equipment statewide through a combination of regulations, voluntaryagreements, and funding programs <strong>to</strong> ensure the use of cleaner fuel, reduce idling,accelerate EPA timelines for reduced emissions, and <strong>to</strong> encourage the use of newtechnology. Beginning January 1, <strong>2007</strong>, CARB regulations require intrastatelocomotives that operate 90 percent of the time in the state <strong>to</strong> use <strong>California</strong> ultralow sulfur diesel fuel (15 parts per million). Other regulations require emissioncontrols for mobile cargo handling equipment that operate at intermodal rail yards.EMISSION REDUCTION STRATEGIESTo accelerate the effects of EPA rules, CARB, UP, and BNSF signed the SouthCoast Locomotive NOx Fleet Average Agreement (1998) <strong>to</strong> require locomotivefleets in the South Coast Air Quality Management District <strong>to</strong> meet, on average,EPA Tier 2 standards by 2010. Locomotives generally stay in service for 40 or50 years and are complete rebuilt periodically. EPA does not require railroads <strong>to</strong>replace existing fleets; only that newly purchased or rebuilt locomotives meet thestandards. Tier 2 engines were not commercially available until 2005, so underthe accelerated measures southern <strong>California</strong> is projected <strong>to</strong> realize Tier 2 benefits20 years earlier than the rest of the U.S.In 2005, CARB, UP, and BNSF signed a voluntary statewide agreement <strong>to</strong> reduceidling, use cleaner fuel, and <strong>to</strong> work with communities <strong>to</strong> assess and reduce railyard-related health risks. The Particulate Emissions Reduction Program at<strong>California</strong> <strong>Rail</strong> Yards (Agreement) is expected <strong>to</strong> result in a 20 percent reductionof diesel PM emissions from locomotives in and around rail yards and does notchange or preempt any federal, state, or local authorities <strong>to</strong> regulate railroads.Measures in the 2005 Agreement include:• Phase-out of non-essential idling on locomotives without idle reductiondevices (60-minute limit).• Install idling devices on <strong>California</strong>-based locomotives by June 30, 20<strong>08</strong>(15 minute limit).241
<strong>2007</strong>-<strong>08</strong> – <strong>2017</strong>-<strong>18</strong> <strong>California</strong> <strong>State</strong> <strong>Rail</strong> <strong>Plan</strong>• Identify and repair locomotives with excessive smoke, agree <strong>to</strong> smokeinspections by CARB, and ensure a 99 percent pass rate.• With community and air district involvement, prepare health riskassessments (HRA) for 16 major rail yards, based on the UP Roseville <strong>Rail</strong>Yard HRA (2004) and Office of Environmental Health Hazard Assessmentguidelines and,• Identify and implement future feasible mitigation measures based on theresults of the rail yard health risk assessments<strong>Rail</strong>roads and manufacturers have been working <strong>to</strong> develop and test newtechnologies <strong>to</strong> reduce harmful emissions from locomotive engines. Among theseare the use of oxidation catalysts (Oxicat) in line-haul engines and dieselparticulate filters (DPF) attached <strong>to</strong> switching locomotives. With each of thesedevices, the diesel exhaust is heated and PM is converted <strong>to</strong> water and carbondioxide.<strong>Rail</strong>roads are also reducing emissions by replacing conventional diesel switchinglocomotives with new locomotives powered by hybrid diesel-battery engines(the “Green Goat”) or genera<strong>to</strong>r-sets (Genset) which use three low-horsepowerTier 3 diesel engines <strong>to</strong> power on-board genera<strong>to</strong>rs.ENVIRONMENTAL JUSTICEFreight transportation systems play an essential role in advancing the economy,safety, and quality of life in <strong>California</strong>. Investments in transportation systemsprovide clear public benefits but may also generate unintended negative impacts,such as air pollution, visual blight, and excessive noise and vibration. Strained <strong>to</strong>capacity, the system also contributes significantly <strong>to</strong> congestion on the state’sstreets and highways, which increases idling and delay times for both passengervehicles and trucks. This in turn reduces mobility, air quality, and safety.New and expanded freight facilities may also disrupt or displace establishedcommunities.<strong>California</strong>’s goals for environmental justice are <strong>to</strong> promote the fair treatment andmeaningful involvement of all people in the transportation decision-makingprocess. The <strong>State</strong> works <strong>to</strong> ensure that low-income and minority communitiesreceive an equitable distribution of transportation system benefits withoutsuffering disproportionate adverse impacts. This requires the full and fairparticipation of all potentially affected communities and incorporating early publicinvolvement of a wide range of socio-economic groups. Ensuring environmentaljustice is considered results in improved transportation planning and projectdevelopment.As part of their commitments <strong>to</strong> prepare health risk assessments (HRA) under the2005 <strong>State</strong>wide <strong>Rail</strong> Yard Agreement with CARB, UP and BNSF completedemission inven<strong>to</strong>ries and exposure modeling pursuant <strong>to</strong> CARB guidelines, which242
Chapter XVII – Environmental Considerationswere developed with input from interested stakeholders and <strong>State</strong> health experts.CARB and the railroads then held public meetings <strong>to</strong> present the draft HRAs,explain what was learned, discuss emission reduction strategies and answerquestions. After a public comment period, a second set of meetings – one for eachrail yard and surrounding communities – was held <strong>to</strong> allow another opportunity forquestions, comments, and suggestions. CARB will finalize the HRAs and workwith the railroads <strong>to</strong> implement the mitigation measures identified.Each transportation project is unique. Although the freight rail system must beconsidered as a whole in the planning process, the site, circumstances, users, andstakeholder value systems of one project are different than others, in spite ofsimilarities. Like the planning and design process, which should meet uniqueproject characteristics, land use planning and decisions can either impede orpromote context sensitive design and environmental justice issues.Local decisions about sighting of freight facilities (sources of air pollution) andschools or housing (recep<strong>to</strong>rs) have their nexus in city and county zoningordinances, which can have regional and statewide consequences.Local government has responsibility for land use decisions and has a role inpreventing avoidable air pollution exposures that pose a health risk. For example,recent studies show public exposure <strong>to</strong> air pollution can be substantially elevatednear some sources of pollution, but health risks are greatly reduced proportionate<strong>to</strong> increased distance of separation. The <strong>State</strong> should support policies whichencourage compatible land uses adjacent <strong>to</strong> goods movement activity centers andwhich also preserve land for such facilities.HIGHWAY-RAIL CROSSINGS<strong>California</strong>’s trade corridors consist of federal interstate freeways, state highways,local streets and roads, and railroad rights of way which connect freight genera<strong>to</strong>rsites such as land, air, and seaports, warehouse and distribution centers,agricultural and manufacturing centers, and retail outlets. The 7,719 at-gradehighway-rail crossings in <strong>California</strong> impact the entire transportation system,not just the freight transportation system.At-grade vehicle conflicts reduce system reliability, increase liability exposure forrailroads and the public, and are some of most noticeable of railroad-relatedimpacts within communities. These conflicts interrupt vehicle, pedestrian, andbicycle traffic and can critically increase emergency response times. <strong>Rail</strong>roadsmust limit the number of cars in trains operated through at-grade crossings and arerequired <strong>to</strong> sound locomotive horns as an advance warning (which althoughrequired, also creates noise impacts <strong>to</strong> surrounding communities).The Public Utilities Commission (PUC) has jurisdiction over the safety ofhighway-rail crossings in <strong>California</strong>. The PUC, among other duties, conductsdesign safety reviews of crossing projects and makes recommendations for243
<strong>2007</strong>-<strong>08</strong> – <strong>2017</strong>-<strong>18</strong> <strong>California</strong> <strong>State</strong> <strong>Rail</strong> <strong>Plan</strong>mitigation measures. Grade crossings can be improved with safety upgrades,traffic signal control measures, and road widening but several safety concernspotentially remain such as, vehicles queuing across tracks or driving around gates,false or inconsistent gate and warning system activation, and poor grade crossingand pedestrian conditions.The optimal safety improvement for an at-grade crossing is <strong>to</strong> build structures thatcompletely separate railroad tracks from the roadway. This will eliminatecollisions, reduce noise from train horns and au<strong>to</strong>matic warning devices, and canimprove emergency response times. Because gate blocking is eliminated, idlingand vehicle hours of delay are significantly reduced, which improves rail andhighway operations and can provide air quality benefits through emissionreductions. Nevertheless, these structures are expensive <strong>to</strong> build and maintain.There are several funding sources commonly used for grade-separation projects.Caltrans distributes $15 million per year from the Section 190 Grade SeparationFund for grade crossing separation or alteration projects, according <strong>to</strong> a prioritylist generated by the PUC. Proposition 1B created the Highway-<strong>Rail</strong> CrossingSafety Account, with $250,000,000 available for completion of high-priority gradeseparation and crossing safety improvements (a one <strong>to</strong> one match is required).Federal programs include Projects of National and Regional Significance, theTransportation & Community & System Preservation Program (TCSP) and, attimes, Congressional earmarks. Other Federal programs that have the potential forfuture grade-separation project funding include the Surface TransportationProgram, the Congestion Mitigation & Air Quality Improvement and the Section130 <strong>Rail</strong>way-Highway Crossing Program.244
Chapter XVIII – FundingCHAPTER XVIIIFUNDINGSYSTEM CAPITAL NEEDS<strong>Rail</strong>roads are extremely capital intensive. In general, they spend about five timesmore <strong>to</strong> maintain their systems and equipment than the average U.S. manufacturerspends on plants and equipment. In 2000 for example, Class 1 railroads spent17.8 percent of revenues on capital improvements compared <strong>to</strong> 3.7 percent for allmanufacturing industries in the nation. With such an expenditure required forcapital improvements, inves<strong>to</strong>rs have been prudent in putting monies in<strong>to</strong>railroads. Consequently, the amount of funds for maintenance and expansion hasnot been as great as for many other industries. Nevertheless, railroads continue <strong>to</strong>fund the expansion of their systems.BNSF <strong>Rail</strong>way for example, will expend $2.75 billion in capital expenditures in<strong>2007</strong>. A <strong>to</strong>tal of $750 million will be for track and facility expansion while$1.6 billion will go <strong>to</strong>wards refreshing track, signal systems and structures.One recent project particularly relevant <strong>to</strong> <strong>California</strong> is the expansion of the2,200-mile Chicago-Los Angeles corridor; as of 2006 all but 51 miles has beendouble tracked. This capacity expansion will enable the railroad <strong>to</strong> increase trafficform 60 trains a day in 2000 <strong>to</strong> 100 trains a day in 2006 along this corridor.The Union Pacific <strong>Rail</strong>road will spend approximately $3.2 billion in <strong>2007</strong>on capital improvements network wide. This includes double tracking of their760 mile Sunset Route from L.A. <strong>to</strong> El Paso, Texas. In <strong>California</strong> a <strong>to</strong>tal of$55 million will be spent on commercial facilities such as terminals and yards, and$222 million on track, and signal systems for this route.Stable and long term funding is critical <strong>to</strong> the preservation, maintenance andexpansion of <strong>California</strong>’s freight rail system.. The AASHTO Freight <strong>Rail</strong> Bot<strong>to</strong>mLine Report provides scenarios for funding needs at several levels. These include:• No Growth – where, with minimal investment the railroads could carryapproximately the same amount of traffic in 2020 that they carry <strong>to</strong>day,thereby shifting large amounts of freight <strong>to</strong>nnage on<strong>to</strong> trucks.• Constrained Investment – under this scenario, railroads could affordimprovements paid for by revenues and borrowing – the railroads couldhandle additional traffic but not keep pace with increasing freight traffic.• Base Case - where, with a higher level of investment, the freight systemcould keep its current share of traffic and accommodate a greater share offorecasted increases. Funding would come from a combination of railroadinvestment and public sec<strong>to</strong>r participation.245
<strong>2007</strong>-<strong>08</strong> – <strong>2017</strong>-<strong>18</strong> <strong>California</strong> <strong>State</strong> <strong>Rail</strong> <strong>Plan</strong>• Aggressive Investment – where, with even a higher level of investmentrailroads could capture an even larger share of freight traffic than under theBase Case scenario. Funding at this level would be instrumental inrelieving highway and truck traffic congestion.To give some idea of funding needs for the freight rail system, an outline is givenusing the Base Case scenario. While needs cannot be exactly determined, a generalestimate shows the following costs.• <strong>Rail</strong> Safety Needs - $13.8 billion – This estimate includes needs foradditional warning systems, highway-rail grade crossing needs, gradeseparations and track relocation.• Class 1 Infrastructure Repair and Maintenance - $4-$5 billion annually, or$80 <strong>to</strong> $100 billion over 20 years• Class 1 Infrastructure Improvements, above and beyond Repair andMaintenance - $3.5 billion annually or $70 billion over 20 years.• Short Line Improvements - $11.8 billion – This includes funding forimprovements such as upgrading track <strong>to</strong> handle heavier railcars, safety andspeed improvements and need for deferred maintenance.The <strong>to</strong>tal estimated cost for the base case scenario is estimated at $175 <strong>to</strong>$195 billion over 20 years. According <strong>to</strong> a more recent AASHTO report,“Transportation--Invest in Our Future” February <strong>2007</strong>, the “cost <strong>to</strong> maintainfreight rail’s current market share,” in <strong>2007</strong> is estimated at $12 billion-$2.75billion annually in public support and $9.25 billion annually in railroad privatecapital investment. These figures are believed <strong>to</strong> be very conservative.PUBLIC INVESTMENT IN PRIVATE INFRASTRUCTUREPartnerships in rail are appropriate, realistic, and increasingly valuable for both thepublic and private sec<strong>to</strong>r. <strong>Rail</strong> will not s<strong>to</strong>p road congestion, but it can blunt it.<strong>Rail</strong> is not always a remedy for freight capacity, but in fitting conditions it iscompetitive and effective. Public money is not the entire answer for railroadgrowth, but it is part of the answer in an era when needs and opportunities are ripe.Relatively small public investments in the nation’s freight railroads can beleveraged in<strong>to</strong>relatively large benefits for the nation’s highway infrastructure,highway users, and freightshippers. When public funds moderate the capitalintensity of railroading, new services become possible at a lower cost.246
Chapter XVIII – FundingRAIL INVESTMENT DRIVERS• Tremendous Growth in Demand; Scarce Resources• Greatest Return on Investment for Passengers and Freight• Reducing Growth in Truck Demand and Impacts (e.g., congestions, roadwaydeterioration, safety, emissions, energy consumption)• Support Economy – greater export opportunities; regional and <strong>State</strong>There are different ways of approaching the maintenance and improvement of thefreight rail system. One is by means of “market driven evolution” where theemphasis on system funding is primarily carried out by the railroads themselves.Under this scenario the system would be maintained and moderately improved butwould do little <strong>to</strong> relieve highway congestion.An alternative method of funding freight rail is through public policy drivenexpansion. Public-private partnerships, which are an outgrowth of this method,can provide funds for projects which would not otherwise be undertaken by therailroads themselves, and which can serve public needs such as relief ofcongestion, upgrading environmental quality, and economic expansion.Generally, in the past public-private partnerships associated with freight railfocused on basic local programs such as grade crossing improvements and branchline preservation. With a greater degree of public sec<strong>to</strong>r participation, andexpanded funding sources and amounts, larger scale projects such as corridor andterminal improvements of regional and national significance can be undertaken.If improvements are not made in the freight-rail system, the <strong>State</strong>’s freighttransportation system will weaken and shippers, highway users, and communitieswill pay the social, economic, and environmental costs. The rail industry requirescontinuing investment in order <strong>to</strong> handle the projected growth in freight traffic.Public investment can help <strong>to</strong> stimulate such growth by providing better returnsfor the railroads and interest in rail from capital markets.FUNDING ALTERNATIVESMany states have also developed programs that have benefited and promotedfreight rail. According <strong>to</strong> the AASHTO report 30 states have freight andpassenger rail staff dedicated <strong>to</strong> rail programs, while 20 of them have staffdedicated specifically <strong>to</strong> freight rail. Twenty-two states have used state money <strong>to</strong>fund rail projects, and 10 have freight rail budgets exceeding one million dollarsannually.Often the projects resulting from these programs are carried out as public-privateprojects or public projects that are collaborative efforts between different levels ofgovernment.247
<strong>2007</strong>-<strong>08</strong> – <strong>2017</strong>-<strong>18</strong> <strong>California</strong> <strong>State</strong> <strong>Rail</strong> <strong>Plan</strong>As well, many of the passenger rail projects improved the infrastructure andincreased capacity on two major freight railroads in the state. In addition, statefunding for grade crossing improvements is provided by the Section 130 gradecrossing program and short line preservation program.STATE GENERAL FUND PROGRAMSRecognizing the need for increased public investment in freight rail infrastructure,other states have implemented programs paid through general state revenues. Forexample, Washing<strong>to</strong>n <strong>State</strong> created “The Essential <strong>Rail</strong> Assistance Account” adedicated rail account in the state treasury <strong>to</strong> be used acquisition or rehabilitationof rail lines, equipment, mitigation of port or mainline congestion and corridorpreservation. An additional statute spells out the benefits, roles, andresponsibilities of public-private partnerships as a means of developinginnovatively financed transportation infrastructure projects. An interestinginnovation is the purchase and maintenance of specialized freight cars <strong>to</strong> ensureadequate equipment for agricultural uses. Recent monies used for freight railprojects have <strong>to</strong>taled $31.5 million between 1990 and 2005, with most of thesefunds allocated between 2003 and 2005.Florida provides the Strategic Intermodal System (SIS) program, which offers asteady stream of funding. Currently the SIS provides about $9 million annually;when matched with private funds the <strong>to</strong>tal rises <strong>to</strong> about $16 million. It isestimated that about $81 million in combined public and private funds will beavailable between 2006 and 2010 <strong>to</strong> upgrade Florida’s rail network, but that willfund only about 10% of the identified needs.Virginia uses the <strong>Rail</strong> Preservation and Development Program <strong>to</strong> assist short linerailroads operating in Virginia. It has grown steadily from $500,000 in 1991 <strong>to</strong>nearly $3 million in 2004. This program focuses on rail line preservation.An additional program is the <strong>Rail</strong> Industrial Access Program that identifiesopportunities for constructing or refurbishing track <strong>to</strong> allow new rail service in<strong>to</strong>industrial locations. Funds are not exclusive <strong>to</strong> rail but must compete with roadand airport projects. It is estimated that nearly 20,000 new jobs have beengenerated with this program as well as four billion dollars in planned capitalimprovements.The <strong>Rail</strong> Freight Program (RFP) is an Illinois Department of Transportationsponsoredprogram that provides capital assistance <strong>to</strong> communities, railroads andshippers <strong>to</strong> preserve and improve rail freight service in the state. The RFP’sprimary goal is <strong>to</strong> facilitate investments in rail service and infrastructure byserving as a link between interested parties and channeling government funds <strong>to</strong>projects that achieve statewide economic development. Capital funding isprovided in the form of low interest loans and/or grants. In 2006 the RFPprovided seven million dollars in state and federal funding for the construction ofnew infrastructure and rehabilitation of existing track. <strong>California</strong> should248
Chapter XVIII – Fundinginvestigate “best practices” from other states as part of a comprehensive approach<strong>to</strong> developing its own model-funding template.Currently, Article 19 of the <strong>California</strong> Constitution identifies authorized uses ofthe states mo<strong>to</strong>r fuel tax revenues. However, it restricts the <strong>State</strong>’s ability <strong>to</strong> use<strong>State</strong> Highway Account funds for purposes other than highway, roadway, andsome passenger mass transit guideway purposes. Therefore, if the highest publicinvestment need is a rail freight project, it is not fundable from the <strong>State</strong> HighwayAccount. A legislative solution <strong>to</strong> this restriction might be <strong>to</strong> create a separateGoods Movement Investment Fund, fiscally separate from the <strong>State</strong> TransportationFund.A Goods Movement Investment Fund would be created in the <strong>State</strong> Treasury.The statu<strong>to</strong>ry language would specify the purpose of the fund as two-fold. First, itwould be <strong>to</strong> receive non-Article 19 restricted <strong>State</strong> revenues (such as those fromthe General Fund), and federal funds authorized for goods movement projectpurposes. Second, it would be for the purpose of allocation of such funds <strong>to</strong> keygoods movement transportation projects, such as investments in public and privatefreight rail system improvements. Expenditure of available funds would be basedon an annual discretionary program, prepared and recommended by theDepartment, and approved by the <strong>California</strong> Transportation Commission.BOND FUNDINGTrade Corridors Improvement Fund (TCIF)Public participation and interest in rail projects has been relatively well advancedin <strong>California</strong>, particularly in the passenger sec<strong>to</strong>r. In November 2006, the votersof <strong>California</strong> broadened its traditional support for bond-funded passenger railprograms <strong>to</strong> include freight rail infrastructure by passing Proposition 1B. One ofthe key elements of the legislation is the $2 billion dedicated <strong>to</strong> the TradeCorridors Improvement Fund (TCIF). The TCIF specifically acknowledges theimportance of freight rail <strong>to</strong> the overall goods movement system, and allows thefreight rail industry <strong>to</strong> partner with the public sec<strong>to</strong>r in funding freight railinfrastructure. Other rail-related funds identified in the legislation included $250million for highway-rail grade separation projects.The <strong>California</strong> Transportation Commission (CTC) will develop the guidelines andselect the projects <strong>to</strong> be funded from the TCIF. As of September <strong>2007</strong>,the Administration has requested the CTC <strong>to</strong> adopt guidelines and approve aprogram of infrastructure projects by December 31, <strong>2007</strong>. In addition,the <strong>California</strong> <strong>State</strong> Legislature is considering criteria for implementingProposition 1B, contained in Senate Bill 9. As of September <strong>2007</strong>, this bill has notyet been passed by the Legislature, although it has been amended several times.As currently written, this bill could limit the use of TCIF funds for freight railprojects, so a dialogue with the bill’s sponsor is ongoing.249
<strong>2007</strong>-<strong>08</strong> – <strong>2017</strong>-<strong>18</strong> <strong>California</strong> <strong>State</strong> <strong>Rail</strong> <strong>Plan</strong>Bond-Funded Freight <strong>Rail</strong> Projects Outside <strong>California</strong>.The Sheffield Flyover/Kansas City, Missouri elevates a three-mile section of theeast-west BNSF mainline and Kansas City Terminal <strong>Rail</strong>road (KCT) throughdown<strong>to</strong>wn Kansas City. The flyover eliminates conflicts with the UP andKansas City Southern (KCS) and benefited up <strong>to</strong> 250 train movements per day.The project cost $75 million and was funded by the BNSF, KCT, and the <strong>State</strong> ofMissouri, which formed a Joint Transportation Corporation <strong>to</strong> issue IndustrialDevelopment Bonds. The 20-year bonds are <strong>to</strong> be repaid through railroadrevenues.The Argentine Connection, also in Kansas City will elevate the east-west BNSFmainline at Santa Fe junction between the KCT mainline in Missouri and theBNSF Argentine Yard in Kansas. The project would eliminate a number of railcrossings and at-grade rail-highway crossings. The project, with an estimated cos<strong>to</strong>f $60 million, will have a similar public-private partnership as the SheffieldCrossing project using Industrial Development Bonds.FEDERAL PROGRAMSOne of the most significant programs coming out of the Safe, Accountable,Flexible, Efficient Transportation Equity Act—A Legacy for Users (SAFETEA-LU) was the Projects of National and Regional Significance (PNRS) program.This program is designed <strong>to</strong> fund major freight-oriented transportation projects ofnational and regional importance. It is in some ways modeled after thedevelopment of the very successful Alameda Corridor, which opened in 2002.The Alameda Corridor is a 20-mile triple-tracked fully grade-separated railcorridor linking the Ports of Los Angeles and Long Beach <strong>to</strong> major intermodal railyards located near down<strong>to</strong>wn Los Angeles.The project consolidated three rail lines and eliminated more than 200 at-gradecrossings. It reduces great amounts of vehicle congestion, reduces both vehicleand locomotive emissions, provides modern access <strong>to</strong> the international Ports ofLong Beach and Los Angeles, reduces the volume of trucking activity, andstimulates economic development.The project cost $2.4 billion and was funded through a multi-level public-privatepartnership. Funding was provided by $1.16 billion in revenue bonds;$400 million in federal loans which were supported by surcharges on loadedcontainers; $394 million from port authorities; $347 million from the Los AngelesMetropolitan Transportation Authority; $130 million from state and federal grants;and $400 million from federal highway funds for street and highway overpasses.The federal loan aspect of the project was also the basis of the TransportationInfrastructure Finance and Innovation Act, which has used <strong>to</strong> support several railprojects in the nation.250
Chapter XVIII – FundingUnder the PNRS, three projects are notable in this discussion. A continuation ofthe Alameda Corridor project, the Alameda Corridor East (ACE) provides for131 grade separations and other grade crossing improvements over the three mainUP and BNSF rail lines radiating east of Los Angeles through the counties ofLos Angeles, Orange, San Bernardino and Riverside. The project will facilitatethe movement of international traffic from the Ports of Los Angeles and LongBeach as well as domestic traffic <strong>to</strong> and from Southern <strong>California</strong>. Theapproximate cost of the project for the grade separation portion alone is currentlyestimated at $4.6 billion. $125 million in PNRS funds were earmarked for thegrade separations. If you count all federal bill earmarks, a <strong>to</strong>tal of $210.5 millionwas earmarked in that legislation for ACE grade separation projects.The Heartland Corridor Project focuses on the upgrade of the Norfolk Southernline between Norfolk, Virginia and Columbus, Ohio through West Virginia <strong>to</strong>provide double-stack clearance capability with tunnel improvements and otherprojects. The benefit would be the increase in intermodal freight rail traffic andthe reduction of highway congestion on a multi-state highway corridor.The federal contribution will be slightly less than $100 million in <strong>to</strong>tal.The <strong>State</strong> of Illinois and City of Chicago have joined with passenger and freightrailroads serving the Chicago region <strong>to</strong> establish the Chicago RegionEnvironmental and Transportation Efficiency Program (CREATE).The major goals are <strong>to</strong> improve efficiency of the railroads, improve safety, provideair quality benefits and reduce highway and rail traffic congestion. In <strong>to</strong>tal, theprogram is a $1.5 billion public-private partnership effort. Although not fullyfunded, $100 million in PRNS funding is earmarked for the project. To date thefive Class I railroads involved have committed $100 million, while Chicago hascommitted $30 million and the <strong>State</strong> of Illinois $100 million pending legislativeapproval.Other <strong>Rail</strong> Investment Programs<strong>Rail</strong> funding through the federal government has also been provided under bothSAFETEA-LU and its predecessor, the Transportation Equity Act for the21 st Century (TEA-21). Under Section 9003 of SAFETEA-LU, Rehabilitation andImprovement Funding, priority will be given <strong>to</strong> projects that enhance service andcapacity for shippers in the national rail system. Quite often these funds arecomplemented by funds from other levels of government.Among other programs, which have funding and could benefit freight rail, are:• Section 130 <strong>Rail</strong>-Highway Grade Crossing Program. Under this program,the entire cost of construction of projects for the elimination of hazards ofrail-highway crossings can be funded.• Congestion Management and Air Quality Improvement Program (CMAQ).This program provides funding for projects <strong>to</strong> improve air quality in non-251
<strong>2007</strong>-<strong>08</strong> – <strong>2017</strong>-<strong>18</strong> <strong>California</strong> <strong>State</strong> <strong>Rail</strong> <strong>Plan</strong>attainment areas as long as measurable emission reductions can be shown.The program has been used for many rail projects nationwide, includingtwo small projects in Southern <strong>California</strong>.• Freight Intermodal Distribution Pilot Grant Program. This program hasprovided the Ports of Los Angeles and Long Beach with capital funding <strong>to</strong>address infrastructure and freight distribution needs at inland ports andintermodal facilities.• Transportation Infrastructure Finance and Innovation (TIFTA).This program provides three types of credit financing for nationally orregionally significant projects. Eligible projects include public or privaterail facilities that demonstrate public benefit.• <strong>Rail</strong> Line Relocation Grants. This program provides states with funding <strong>to</strong>mitigate the adverse effects of rail traffic on safety, vehicle traffic flow,quality of life or economic development by relocating rail lines away fromdown<strong>to</strong>wn areas. Fifty percent of the funds are dedicated <strong>to</strong> projects of$20 million or less; states or non-Federal entities must pay at leastten percent of project costs.• Rehabilitation and Improvement Financing. This program provides directloans and loan guarantees <strong>to</strong> various public and private entities includingrailroads for the purpose of constructing a rail connection between a plan<strong>to</strong>r facility and a second rail carrier.• Study of <strong>Rail</strong> Rehabilitation and Regulation. This is a program <strong>to</strong> evaluatethe status of the national rail system since the passage of the Staggers Actin 1980.While the above programs have provided funding that has benefited freight railprograms in the U.S., approaches have been promulgated by other sec<strong>to</strong>rs of thetransportation industry. One current action is concerned with investment taxcredits for railroads.Tax CreditsIn comparison with other modes of transportation, including trucks, airlines, andbarges, freight railroads have received scant financial assistance from the federalgovernment. The Congressional Budget Office in a January 2006 “Freight <strong>Rail</strong>Transportation: Long Term Issues” report pointed out that large trucks pay only50 <strong>to</strong> 80 percent of costs attributed them while barge opera<strong>to</strong>rs pay taxes thatcover only about 20 percent of the amount the Corps of Engineers spends onnavigation projects.As already noted, railroads normally finance infrastructure improvements andequipment purchases through their own resources and private investment.From 1980 through 2006 for example, Class 1 railroads themselves invested morethan $370 billion <strong>to</strong> maintain and improve their infrastructure and equipment.In 2006 the rail industry spent approximately $8.5 billion on capital investments,252
Chapter XVIII – Fundingincluding expansion in an effort <strong>to</strong> keep up with growth. In order <strong>to</strong> encourage therailroads <strong>to</strong> spend more money, they believe investment tax credits that supportcapital spending make sense.Two recently introduced bills, S. 1125 and H.R. 2116 call for a 25 percent taxcredit for investments in new track, intermodal facilities, yards, locomotives andother infrastructure projects <strong>to</strong> expand rail capacity. All businesses, includingrailroads, ports, shippers, and trucking companies would be eligible for the credit.Among the points rail proponents of the bills make are fuel efficiency over thetrucking industry, less highway congestion, reduced pollution with increasedfreight rail transport, and safety issues – fatality rates associated with intercitytrucking are four times greater than those for freight rail.Shifting millions of truck moves per year <strong>to</strong> rail is good public policy. It reduceshighway congestion and air pollution, and increases safety. Federal tax creditssuch as the 25% investment tax credit for Class Is, and the 50% investment taxcredit for short line railroads (HR 1584, due <strong>to</strong> expire at the end of <strong>2007</strong>) wouldhelp railroads expand capacity faster than they would otherwise.PUBLIC/PRIVATE PARTNERSHIP (P3) AND LOCAL INITIATIVESThere are also other regional and multi-state freight rail projects in addition <strong>to</strong>those listed above. These projects are often supplemented with federal funding,for the improvement of specific corridors that are either planned or underway.These include:Mid-Atlantic <strong>Rail</strong> Operations Study – New Jersey, Pennsylvania, Delaware,Maryland and Virginia. This is a five state project, with the states working inconcert with Amtrak, the I-95 Coalition, Norfolk Southern <strong>Rail</strong>road, and CSX.The project would include infrastructure reconstruction, capacity enhancements,height and weight clearances, and terminals. The projected cost is $6.2 billionover 20 years.A specific regional project, which combines state, regional and local initiatives isthe Washing<strong>to</strong>n <strong>State</strong> “FAST” corridor – This “Freight Action Strategy”program encompasses 15 priority freight projects between Everett and Tacoma.It includes rail-highway grade separations, rail yard improvements, port access,and regional highway improvements. The <strong>to</strong>tal cost is unknown. The projectincludes participants from the state, regional governments, three ports, 12 cities,and two counties, the BNSF and UP railroads and the Washing<strong>to</strong>n TruckingAssociation.The Delaware Department of Transportation (DelDOT), Norfolk SouthernCorporation, and the Port of Wilming<strong>to</strong>n completed a $13.9 million rehabilitationof the venerable Shellpot <strong>Rail</strong>road Bridge. Under the terms of the uniqueconstruction agreement, DelDOT agreed <strong>to</strong> fund the cost of res<strong>to</strong>ring the bridge253
<strong>2007</strong>-<strong>08</strong> – <strong>2017</strong>-<strong>18</strong> <strong>California</strong> <strong>State</strong> <strong>Rail</strong> <strong>Plan</strong>for train service, and Norfolk Southern agreed <strong>to</strong> compensate the state over a 20-year period based on its use of the bridge.The Shellpot Bridge will be the first <strong>to</strong>ll bridge for railroad cars in the country.Through a <strong>to</strong>ll system, Norfolk Southern will repay DelDOT over the next20 years. An electronic scanner will count the number of rail cars that cross thebridge by reading a magnetic placard that is mounted on every railcar. This typeof "bar scanning technology" (similar <strong>to</strong> a grocery s<strong>to</strong>re checkout line) is currentlyused by rail companies <strong>to</strong> keep tabs on cars along many thousands of miles oftrack across North America. Shellpot will become the first facility <strong>to</strong> takeadvantage of this <strong>to</strong> charge, and collect a <strong>to</strong>ll. Norfolk Southern will pay DelDOTan annual minimum, regardless of traffic. The sliding scale adopted has the <strong>to</strong>llranging from $35 per car for the first 5,000 that cross the bridge annually, <strong>to</strong> only$5 per car after 50,000 crossings.These examples could provide insights in<strong>to</strong> additional funding strategies forconsideration in <strong>California</strong>.USER FEESThe <strong>California</strong> Legislature—concerned about the impacts of goods movementactivities on adjacent communities, and the lack of resources directed <strong>to</strong>addressing these impacts—advanced several bills during the <strong>2007</strong> legislativesession.On of them, Senate Bill 974, would require the Ports of Los Angeles, Long Beach,and Oakland <strong>to</strong> collect a user fee on the owner of container cargo moving throughthe Port of Los Angeles, the Port of Long Beach, or the Port of Oakland at a rateof $30 per twenty-foot equivalent unit (TEU) or $60 per forty-foot equivalent unit(FEU). The bill would require the fees be used <strong>to</strong> fund projects for all modes thatimprove the flow and efficiency of container cargo <strong>to</strong> and from those ports.It is estimated that $500 million would be generated annually for these projects,including freight rail. This revenue stream could be a potential source of freightrail project funding, and might include the short line railroad industry, whichserves these ports. SB 974 is currently on the “inactive” file. Whether or not it isultimately adopted and signed by the Governor, this bill and its companionlegislation highlight the intent of the legislature <strong>to</strong> attempt <strong>to</strong> find solutions <strong>to</strong>funding environmental mitigation for goods movement projects that does notdepend solely on existing transportation or emissions reduction funding sources.254
Chapter XIX – Freight <strong>Rail</strong> Research and StudiesCHAPTER XIXFREIGHT RAIL RESEARCH AND STUDIESINVESTMENT MODELSPublic investments in the transportation system <strong>to</strong>day are often used as a stimulusfor economic growth, congestion mitigation, and other quality of lifeimprovements. For freight rail specifically, many of the public motivations arecentered on capacity: whether an investment can relieve the highway system, slowthe growth in highway demand, or prevent traditional rail traffic from changingmodes. The latter has become especially important recently and points up thecapacity question in rail as well as highway: as Class I carriers have begun <strong>to</strong>allocate capacity by shedding some traffic for better paying freight, it is thetraditional, heavy loading, hard-on-pavement carload business that is most at riskof being shifted from rail <strong>to</strong> highway.The United <strong>State</strong>s Department of Transportation (USDOT) has published a Guide<strong>to</strong> Quantifying the Economic Impacts of Investments in Large-Scale FreightTransportation Projects. The purpose of this guide is <strong>to</strong> provide a thorougheconomic analysis framework <strong>to</strong> assess the benefits and costs of potential freightinvestments. Application of this guide, and the analytical steps recommended, isintended <strong>to</strong> ensure that freight projects are appropriately considered in national,regional, and state decisions about the future of transportation system investments.In addition, the high costs of these projects emphasize the need for public/privatepartnerships <strong>to</strong> amass the funds necessary for their successful completion.Although this guide recognizes the importance of other social and environmentaleffects, the focus is on economic effects and the secondary passenger benefits tha<strong>to</strong>ften accrue due <strong>to</strong> freight projects. Given this emphasis, the guide covers <strong>to</strong>picssuch as:• National scale of benefits – economic benefits from freight projects impactindustry shippers and receivers across the country (and internationally), notjust the location of a freight project;• Public versus private benefits – when considering the potential forpublic/private partnerships, it is imperative <strong>to</strong> maintain a careful accountingof public and private benefits, which are particularly relevant <strong>to</strong> freighttransportation; and• Logistics and supply chain effects – measuring the economic impact offreight investments requires the analysis of benefits <strong>to</strong> shippers andreceivers of freight in terms of both “first order” direct transportationeffects, and “second order” logistics, distribution, supply chain, and broadereconomy-wide implications.255
<strong>2007</strong>-<strong>08</strong> – <strong>2017</strong>-<strong>18</strong> <strong>California</strong> <strong>State</strong> <strong>Rail</strong> <strong>Plan</strong>The core of the economic analysis framework for evaluating large-scale freightprojects is a Five-Step Analysis process:5. Identify the nature and transportation purpose of the project in terms of itsintended impact on improving freight and nonfreight travel conditions.This is needed <strong>to</strong> ensure that those transportation effects and theirconsequences are properly evaluated.6. Identify the nature of expected economic impacts in terms of the elementsof the economy that feel they have a stake in seeing the project occur.This is needed <strong>to</strong> ensure that those economic effects and their consequencesare also properly evaluated.7. Apply transportation impact evaluation <strong>to</strong>ols <strong>to</strong> assess the magnitude andnature of transportation system performance effects actually projected <strong>to</strong>impact shippers and carriers.8. Apply economic impact evaluation <strong>to</strong>ols <strong>to</strong> assess the magnitude andnature of economic effects actually projected <strong>to</strong> occur for elements of theeconomy that are either directly or indirectly affected by freight systemcosts and performance.9. Apply decision support methods <strong>to</strong> identify the substantial positive andnegative impacts of the project for the economy (at the local/state ornational level).The remainder of the guide provides extensive detail on all five of these steps,models and data <strong>to</strong> support economic and transportation analysis, and case studiesthat highlight the application of the five steps. Two examples of such investmentmodels are given below:Washing<strong>to</strong>n Department of Transportation (WSDOT) Freight <strong>Rail</strong>Investment ModelCambridge Systematics Consulting has recently completed a <strong>State</strong> <strong>Rail</strong> Capacityand Systems Needs Study for WSDOT. As part of this study a rationale for publicinvestment in private freight rail was examined. The objectives of the task were <strong>to</strong>define the rationale for public participation in rail improvements and develop amethodology for estimating the benefits, costs, risks, and appropriate level ofinvestment and public participation.A sample framework suggested includes the following:• Transportation and Economic Inputs - Investments in transportationinfrastructure are expected <strong>to</strong> generate system improvements and spureconomic development. Estimates of these impacts become the inputs in<strong>to</strong>the benefits calculations. This may include evaluation of existing publicinvestments in competing non-rail freight modes.256
Chapter XIX – Freight <strong>Rail</strong> Research and Studies• Transportation Impacts - Determines the transportation-related benefitsfrom the proposed improvements. These include reduced highwaymaintenance costs and reduced shipper costs.• External Impacts - Includes non-transportation benefits attributable <strong>to</strong>transportation improvements. These include safety, security, health, andenvironmental impacts.• Economic Impacts - Converts the various impact measures in<strong>to</strong> direct andindirect economic benefits. These include job creation, income taxes, andreductions in passenger delays.• Decision Support - Combines the above benefits and generates output used<strong>to</strong> evaluate and help determine the best allocation of public investments.A nine-step procedure for evaluating public participation in rail projects has alsobeen developed by Global Insight Consulting for the National CooperativeHighway Research Program (NCHRP) 8-42 study, and will be adapted forapplication in Washing<strong>to</strong>n <strong>State</strong>.Florida Department of Transportation Freight <strong>Rail</strong> Investment Calcula<strong>to</strong>rThe question that always arises when contemplating public sec<strong>to</strong>r investments inthe privately owned freight railroads are “what does the public gain?”One framework for establishing the public value of investment in the rail system isdepicted below. This figure provides a convenient framework for describing howfreight rail investments can be converted in<strong>to</strong> public benefits, and how a portfolioof projects can be selected for public investments.Figure 19AFramework for Evaluating Transportation Investments257
<strong>2007</strong>-<strong>08</strong> – <strong>2017</strong>-<strong>18</strong> <strong>California</strong> <strong>State</strong> <strong>Rail</strong> <strong>Plan</strong>• Transportation and Economic Inputs – Investments in transportationinfrastructure are expected <strong>to</strong> generate system improvements and/or spureconomic development. Estimates of these impacts become the inputs in<strong>to</strong>the benefits calculations.• Transportation Impacts – Determines the transportation-related benefitsfrom the proposed improvements. This includes reduced highwaymaintenance costs and reduced shipper costs.• External Impacts – Includes non-transportation benefits attributable <strong>to</strong>transportation improvements. These include safety, security, andenvironmental impacts.• Economic Impacts – Converts the various impact measures in<strong>to</strong> direct andindirect economic benefits. This includes job creation, income taxes, andreductions in passenger delays.• Decision Support – Combines the above benefits and generates outputused <strong>to</strong> evaluate and help determine the best allocation of publicinvestments.This framework is consistent with Florida’s Strategic Intermodal System (SIS)goals:1. Safety and Security – A component of external impacts;2. System Preservation – Not explicitly modeled, but can be considered anexternal impact and a future transportation impact;3. Intermodal Mobility – A component of transportation impacts;4. Economic Enhancement – The same as economic impacts; and5. Quality of Life – A component of transportation impacts (congestionmitigation), external impacts (environmental and safety), and economicimpacts (jobs and economic growth).Cambridge Systematics adapted the evaluation framework in<strong>to</strong> a Microsoft ExcelbasedCapital Budget Model Decision Support System for the FDOT. Specificallythe software quantifies the public benefits accruing from:Transportation Impacts:• Avoided Highway Maintenance Costs• Shipper Logistics Costs• Highway Delay at <strong>Rail</strong>-Highway Grade CrossingsEconomic Impacts:• New or Retained Jobs• Tax Increases from Industrial DevelopmentExternal Impacts:• Highway Safety Improvements• Environmental Quality Improvements258
Chapter XIX – Freight <strong>Rail</strong> Research and StudiesThe software calculates the benefit/cost ratio for each project, considering thefac<strong>to</strong>rs listed above and the time-value of money. A Capital Budget Model is thenrun <strong>to</strong> select the combination of projects that maximizes the public benefitsresulting from every dollar invested in the rail system.The Freight <strong>Rail</strong> Investment Calcula<strong>to</strong>r is one part of the overall decision processof how public funds should best be invested <strong>to</strong> spur economic growth and enhancefreight and passenger mobility in Florida. This calcula<strong>to</strong>r could be adapted <strong>to</strong>evaluate freight rail projects in <strong>California</strong>, something the CTC, which willprogram the TCIF bonds for freight rail projects, is currently investigating.PERFORMANCE OUTCOMES, CRITERIA ANDMONITORINGTypical performance measures tracked by AAR include: number of cars on line,train speed and terminal dwell time. These all affect railroad velocity and arailroad’s ability <strong>to</strong> be profitable. In <strong>California</strong> where freight rail volumes areincreasing, and the rail network and capacity are becoming constrained, this isespecially true.Despite the use of a common methodology, one railroad’s performance metricscannot meaningfully be compared <strong>to</strong> another railroad’s, due <strong>to</strong> differencesincluding, but not limited <strong>to</strong>, those associated with network terrain and designcharacteristics, traffic mix, traffic volume, length of haul, extent of passengeroperations, and operational practices – as well as external fac<strong>to</strong>rs such as weatherand port operations which can impact carriers differently.Some of the more general measures and definitions are shown below:Cars On LineCars On Line is the average of the daily on-line inven<strong>to</strong>ry of freight cars.Articulated cars are counted as a single unit. Cars on private tracks (e.g., at acus<strong>to</strong>mer's facility) are counted on the last railroad on which they were located.Maintenance of way cars are excluded. Cars on Line figures are reported by cartype for the following car types:259
<strong>2007</strong>-<strong>08</strong> – <strong>2017</strong>-<strong>18</strong> <strong>California</strong> <strong>State</strong> <strong>Rail</strong> <strong>Plan</strong>Figure 19BCar TypeBoxCovered HopperGondolaIntermodalMultilevelOpen HopperTankOtherAAR MechanicalDesignationA, B or RCE or GP, Q or SVH, J or KTL or FFigure 19COwner TypeSystem CarForeign RRPrivateCar OwnershipDescriptionOwned by the railroad on which it islocatedOwned by a railroad other than theone on which it is locatedOwned by a non-railroad (i.e., has acar initial that ends in “X”) and notleased <strong>to</strong> a railroadTrain SpeedTrain Speed measures the line-haul movement between terminals. The averagespeed is calculated by dividing train-miles by <strong>to</strong>tal hours operated, excluding yardand local trains, passenger trains, maintenance of way trains, and terminal time.System-wide average train speeds are given for the following train types:• Intermodal• Manifest• Multilevel• Coal Unit• Grain Unit• All trains260
Chapter XIX – Freight <strong>Rail</strong> Research and StudiesTerminal Dwell (Hours)Terminal Dwell is the average time a car resides at the specified terminal locationexpressed in hours. The measurement begins with a cus<strong>to</strong>mer release, receivedinterchange, or train arrival event and ends with a cus<strong>to</strong>mer placement (actual orconstructive), delivered or offered in interchange, or train departure event.Cars that move through a terminal on a run-through train are excluded, as ares<strong>to</strong>red, bad ordered, and maintenance of way cars.261
<strong>2007</strong>-<strong>08</strong> – <strong>2017</strong>-<strong>18</strong> <strong>California</strong> <strong>State</strong> <strong>Rail</strong> <strong>Plan</strong>262
Freight <strong>Rail</strong> Element AcknowledgementsFREIGHT RAIL ELEMENTACKNOWLEDGEMENTSThe Freight <strong>Rail</strong> Portion of this report was excerpted, or material obtained all or inpart, from the following sources.American Association of <strong>State</strong> Highway and Transportation Officials (AASHTO),Freight <strong>Rail</strong> Bot<strong>to</strong>m ReportAmerican Short Line & Regional <strong>Rail</strong>road Association (ASLRRA)Association of American <strong>Rail</strong>roads (AAR)Burling<strong>to</strong>n Northern Santa Fe <strong>Rail</strong>way Company (BNSF)<strong>California</strong> Air Resources Board (CARB)<strong>California</strong> Department of Finance<strong>California</strong> Goods Movement Action <strong>Plan</strong> (GMAP), March <strong>2007</strong><strong>California</strong> Marine and Intermodal Transportation System Advisory Council<strong>California</strong> Short Line <strong>Rail</strong>road Association (CSLRA), <strong>2007</strong> Survey<strong>California</strong> <strong>State</strong> <strong>Rail</strong> <strong>Plan</strong>, December 2005Federal Highway Administration (FHWA)Florida Department of TransportationFlorida <strong>State</strong> <strong>Rail</strong> <strong>Plan</strong>, 2004, 2006Governor of <strong>California</strong>’s International Trade WebsiteIllinois Department of TransportationJournal of CommerceKern Council of Governments (KernCOG)Los Angeles County Economic Development Corporation (LAEDC)Metropolitan Transportation Commission (MTC)National Cooperative Highway Research Program (NCHRP)New United Mo<strong>to</strong>r Manufacturing Incorporated, (NUMMI)Pennsylvania Department of Transportation (PennDOT)<strong>Rail</strong>road Performance MeasuresSan Joaquin Council of Governments (SJCOG)San Joaquin PartnershipSouth Coast Air Quality Management District (SCAQMD)Southern <strong>California</strong> Association of Governments (SCAG)Traffic WorldTransportation Research Board (TRB)Union Pacific <strong>Rail</strong>road (UPRR)263
<strong>2007</strong>-<strong>08</strong> – <strong>2017</strong>-<strong>18</strong> <strong>California</strong> <strong>State</strong> <strong>Rail</strong> <strong>Plan</strong>Acknowledgments(continued)United <strong>State</strong>s Department of Transportation (USDOT)Virginia Department of Transportation (VDOT)Washing<strong>to</strong>n Department of Transportation (WSDOT)Washing<strong>to</strong>n <strong>State</strong> Freight <strong>Rail</strong> System Needs and Capacity Study, January <strong>2007</strong>Western Association of <strong>State</strong> Highway and Transportation Officials (WASHTO)264
AppendixAPPENDIXAcronyms4R Act Federal <strong>Rail</strong>road Revitalization and Regula<strong>to</strong>ry Reform Act of 1976AAR Association of American <strong>Rail</strong>roadsAB Assembly BillAC Alternating CurrentAC Transit Alameda-Contra Costa Transit DistrictACCMA Alameda County Congestion Management AgencyACE Altamont Commuter ExpressACR Assembly Concurrent ResolutionADA Americans with Disabilities ActARB <strong>California</strong> Air Resources BoardASLRRA American Short Line and Regional <strong>Rail</strong>road AssociationASSHTO American Association of <strong>State</strong> Highway and Transportation OfficialsATSF Atchison Topeka and Santa Fe <strong>Rail</strong>way CompanyBART Bay Area Rapid Transit DistrictBN Burling<strong>to</strong>n Northern <strong>Rail</strong>road CompanyBNSF Burling<strong>to</strong>n Northern Santa Fe <strong>Rail</strong>way CompanyBTH Business, Transportation and Housing AgencyCCJPA Capi<strong>to</strong>l Corridor Joint Powers AuthorityCEQA <strong>California</strong> Environmental Quality ActCHSRA <strong>California</strong> High Speed <strong>Rail</strong> AuthorityCMAQ Congestion Mitigation and Air Quality Improvement ProgramCNSSTC <strong>California</strong>-Nevada Super Speed Train CommissionCOFC Container on Flat CarCORP Central Oregon and Pacific <strong>Rail</strong>road CompanyCP Control PointCPUC <strong>California</strong> Public Utilities CommissionCRCC Coast <strong>Rail</strong> Coordinating CouncilCSLRRA <strong>California</strong> Short Line <strong>Rail</strong>road AssociationCTC Centralized Traffic ControlDC Direct CurrentDMU Diesel Multiple Unit <strong>Rail</strong>carEIR Environmental Impact ReportEIS Environmental Impact <strong>State</strong>mentEUKA Eureka Southern <strong>Rail</strong>road CompanyFFY Federal Fiscal YearFHWA Federal Highway AdministrationFRA Federal <strong>Rail</strong>road AdministrationFTA Federal Transit AdministrationGF General Fund265
<strong>2007</strong>-<strong>08</strong> – <strong>2017</strong>-<strong>18</strong> <strong>California</strong> <strong>State</strong> <strong>Rail</strong> <strong>Plan</strong>AcronymsContinuedGGBD Golden Gate Bridge, Highway and Transportation DistrictGMAP Goods Movement Action <strong>Plan</strong>GPS Global Positioning SystemICC Interstate Commerce CommissionICRP <strong>California</strong> Intercity <strong>Rail</strong> Capital ProgramIMC Intermodal Marketing CompanyIOS Initial Operating SegmentISTEA Intermodal Surface Transportation Efficiency ActIT Information TechnologyITA Interagency Transfer AgreementITIP Interregional Transportation Improvement ProgramITSP Interregional Transportation Strategic <strong>Plan</strong>JPA Joint Powers AuthorityJPB Peninsula Corridor Joint Powers BoardLACMTA Los Angeles County Metropolitan Transportation AuthorityLAUS Los Angeles Union StationLAX Los Angeles International AirportLNG Liquefied Natural GasLRFA Local <strong>Rail</strong> Freight AssistanceLRSA Local <strong>Rail</strong> Service Assistance Act of 1978Maglev Magnetic LevitationMTC Metropolitan Transportation CommissionMTDB Metropolitan Transit Development BoardNCRA North Coast <strong>Rail</strong> AuthorityNCTD North County Transit DistrictNEPA National Environmental Policy ActNWP Northwestern Pacific <strong>Rail</strong>roadNWPRA Northwestern Pacific <strong>Rail</strong>road AuthorityOCTA Orange County Transportation AuthorityOTP On-Time PerformancePA Public Address SystemPEIR Programmatic Environmental Impact ReportPEIS Programmatic Environmental Impact <strong>State</strong>mentPTA Public Transportation AccountPTC Positive Train Control SystemRCTC Riverside County Transportation CommissionRFP Request for ProposalROW Right-of-Way or Rights-of-WayRPSA Federal <strong>Rail</strong> Passenger Service ActRTIP Regional Transportation Improvement Program266
AppendixSAFETEA-LUSamTransSANBAGSBSCAGSCRRASDNRSHASJRRCSLO TransitSMARTSMCTASPSTASTBSTIPTAMCTCITCRFTCRPTDATDIFTEA-21TIFTIFIATIPTOFCUPUSDOTVCTCVRUVTAWPWTTNAcronymsContinuedSafe, Accountable, Flexible, Efficient Transportation Equity Act: a Legacyfor UsersSan Mateo County Transit DistrictSan Bernardino Associated GovernmentsSenate BillSouthern <strong>California</strong> Association of GovernmentsSouthern <strong>California</strong> Regional <strong>Rail</strong> AuthoritySan Diego Northern <strong>Rail</strong>way<strong>State</strong> Highway AccountSan Joaquin Regional <strong>Rail</strong> CommissionSan Luis Obispo Regional TransitSonoma Marin Area <strong>Rail</strong> Transit DistrictSan Mateo County Transportation AuthoritySouthern Pacific Transportation Company<strong>State</strong> Transportation Assistance ProgramSurface Transportation Board<strong>State</strong> Transportation Improvement ProgramTransportation Agency for Monterey CountyTransit Capital Improvement ProgramTraffic Congestion Relief FundTraffic Congestion Relief ProgramTransportation Development ActTransportation Deferred Investment FundTransportation Equity Act for the 21 st CenturyTransportation Investment FundFederal Transportation Infrastructure Finance and Innovation ActTransportation Improvement <strong>Plan</strong>Trailer on Flat CarUnion Pacific <strong>Rail</strong>road CompanyUnited <strong>State</strong>s Department of TransportationVentura County Transportation CommissionVoice Response UnitValley Transit AgencyWestern Pacific <strong>Rail</strong>road CompanyWestern Transportation Trade Network267
<strong>2007</strong>-<strong>08</strong> – <strong>2017</strong>-<strong>18</strong> <strong>California</strong> <strong>State</strong> <strong>Rail</strong> <strong>Plan</strong>268