- Page 2 and 3:
Copyright © Macmillan/McGraw-Hill,
- Page 4 and 5:
Table of Contents Copyright © Macm
- Page 6:
Chapter 14 Decimals 14-1 Tenths and
- Page 9 and 10:
1-1 Name Date Skills Practice Place
- Page 11 and 12:
1-2 Name Skills Practice Date 4NS1.
- Page 13 and 14:
1-3 Name Reteach (continued) Date 4
- Page 16 and 17:
1-4 Name Reteach Compare Whole Numb
- Page 18 and 19:
1-5 Name Reteach Order Whole Number
- Page 20 and 21:
1-6 Name Reteach Round Whole Number
- Page 22 and 23:
1-7 Name Reteach Problem-Solving In
- Page 24: 1-7 Name Skills Practice Problem-So
- Page 27 and 28: 2-1 Name Date Skills Practice 4AF1.
- Page 29 and 30: 2-2 Name Skills Practice Date 4NS2.
- Page 31 and 32: 2-3 Name Reteach (continued) Date 4
- Page 34 and 35: 2-4 Name Reteach Add Numbers Date T
- Page 36 and 37: 2-5 Name Reteach Subtract Numbers D
- Page 38 and 39: 2-6 Name Reteach Problem-Solving In
- Page 40: 2-6 Name Skills Practice Problem-So
- Page 43 and 44: 2-7 Name Skills Practice Date 4NS3.
- Page 45 and 46: 3-1 Name Date Skills Practice Addit
- Page 47 and 48: 3-2 Name Skills Practice Date 4AF1.
- Page 49 and 50: 3-3 Name Reteach (continued) Date 4
- Page 52 and 53: 3-4 Name Reteach Algebra: Find a Ru
- Page 54 and 55: 3-5 Name Reteach Date 4MR2.3, 4NS3.
- Page 56: 3-5 Name Date Skills Practice Probl
- Page 59 and 60: 3-6 Name Skills Practice Date 4AF2.
- Page 61 and 62: 4-1 Name Skills Practice Date 4SDAP
- Page 63 and 64: 4-2 Name Skills Practice Date 4SDAP
- Page 65 and 66: 4-3 Name Reteach (continued) Date 4
- Page 68 and 69: 4-4 Name Reteach Line Plots Date A
- Page 70 and 71: 4-5 Name Reteach Bar and Double Bar
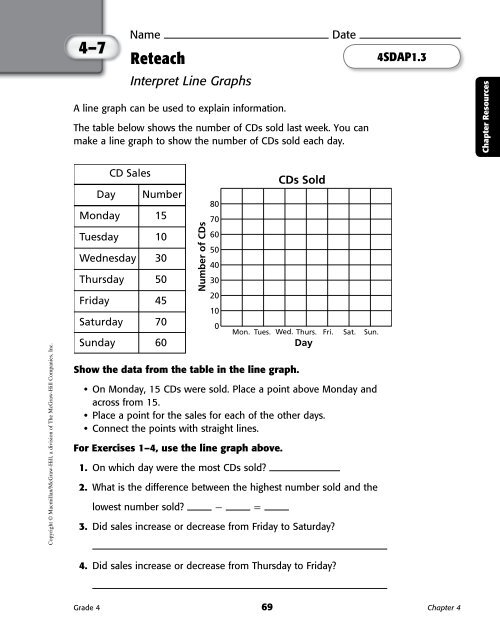
- Page 72 and 73: 4-6 Name Reteach Date 4MR2.3, 4NS2.
- Page 74: 4-6 Name Date Use any strategy show
- Page 79 and 80: 4-8 Name Skills Practice Analyze Gr
- Page 81 and 82: 5-1 Name Skills Practice Date 4MR2.
- Page 83 and 84: 5-2 Name Date Skills Practice Algeb
- Page 85 and 86: 5-3 Name Date Skills Practice Multi
- Page 87 and 88: 5-4 Name Reteach (continued) Date 4
- Page 90 and 91: 5-5 Name Date Reteach Multiply and
- Page 92 and 93: 5-6 Name Reteach Multiply with 11 a
- Page 94 and 95: 5-7 Name Reteach Problem-Solving In
- Page 96: 5-7 Name Skills Practice Problem-So
- Page 99 and 100: 5-8 Name Skills Practice Date 4AF1.
- Page 101 and 102: 5-9 Name Skills Practice Date 4MR2.
- Page 103 and 104: 5-10 Name Skills Practice Date 4NS4
- Page 105 and 106: 6-1 Name Date Skills Practice Multi
- Page 107 and 108: 6-2 Name Reteach (continued) Date 4
- Page 110 and 111: 6-3 Name Reteach Order of Operation
- Page 112 and 113: 6-4 Name Reteach Solve Equations Me
- Page 114 and 115: 6-5 Name Reteach Choose a Strategy
- Page 116: 6-5 Name Skills Practice Problem-So
- Page 119 and 120: 6-6 Name Skills Practice Date 4AF1.
- Page 121 and 122: 6-7 Name Skills Practice Date 4AF2.
- Page 123 and 124: 7-1 Name Skills Practice Date 4NS3.
- Page 125 and 126:
7-2 Name Date Reteach (continued) 4
- Page 128 and 129:
7-3 Name Date To estimate products,
- Page 130 and 131:
7-4 Name Reteach Multiply Two-Digit
- Page 132 and 133:
7-5 Name Date Reteach Problem-Solvi
- Page 134:
7-5 Name Problem-Solving Strategies
- Page 137 and 138:
7-6 Name Skills Practice Date 4NS3.
- Page 139 and 140:
7-7 Name Skills Practice Date 4NS3.
- Page 141 and 142:
8-1 Name Skills Practice Date 4NS3.
- Page 143 and 144:
8-2 Name Skills Practice Date 4NS3.
- Page 145 and 146:
8-3 Name Reteach (continued) Date 4
- Page 148 and 149:
8-4 Name Reteach Multiply Two-Digit
- Page 150 and 151:
8-5 Name Find 411 × 12. Estimate:
- Page 152 and 153:
8-6 Name Reteach Problem-Solving In
- Page 154:
8-6 Name Date Skills Practice Probl
- Page 157 and 158:
8-7 Name Skills Practice Date 4NS3.
- Page 159 and 160:
9-1 Name Skills Practice Date 4NS3.
- Page 161 and 162:
9-2 Name Date Skills Practice Divid
- Page 163 and 164:
9-3 Name Reteach (Continued) Date 4
- Page 166 and 167:
9-4 Name Reteach Date 4NS3.4 Estima
- Page 168 and 169:
9-5 Name Reteach Date 4NS3.4, 4MR2.
- Page 170 and 171:
9-6 Name Reteach Problem-Solving In
- Page 172:
9-6 Name Skills Practice Problem-So
- Page 175 and 176:
9-7 Name Skills Practice Date 4NS3.
- Page 177 and 178:
9-8 Name Skills Practice Date 4NS3.
- Page 179 and 180:
9-9 Name Skills Practice Date 4NS3.
- Page 181 and 182:
10-1 Name Skills Practice Date 4MG3
- Page 183 and 184:
10-2 Name Skills Practice Date 4MG3
- Page 185 and 186:
10-3 Name Reteach (continued) Probl
- Page 188 and 189:
10-4 Name Reteach A line goes on fo
- Page 190 and 191:
10-5 Name Date Reteach Angles Angle
- Page 192 and 193:
10-6 Name Reteach Problem-Solving I
- Page 194:
10-6 Name Skills Practice Problem-S
- Page 197 and 198:
10-7 Name Skills Practice Date 4MG3
- Page 199 and 200:
10-8 Name Skills Practice Date 4MG3
- Page 201 and 202:
10-9 Name Skills Practice Date 4MG3
- Page 203 and 204:
11-1 Name Skills Practice Date 4MG3
- Page 205 and 206:
11-2 Name Skills Practice Date 4MG3
- Page 207 and 208:
11-3 Name Skills Practice Date 4MG1
- Page 209 and 210:
11-4 Name Reteach (continued) Date
- Page 212 and 213:
11-5 Name Reteach Measurement: Area
- Page 214 and 215:
11-6 Name Reteach Date Problem-Solv
- Page 216:
11-6 Name Skills Practice Use any s
- Page 219 and 220:
11-7 Name Date Skills Practice Meas
- Page 221 and 222:
12-1 Name Skills Practice Date 4NS1
- Page 223 and 224:
12-2 Name Skills Practice Date 4MG2
- Page 225 and 226:
12-3 Name Skills Practice Graph Ord
- Page 227 and 228:
12-4 Name Reteach (2) Problem-Solvi
- Page 230 and 231:
12-5 Name Reteach Date 4AF1.5 Funct
- Page 232 and 233:
12-6 Name Reteach Graph Functions D
- Page 234 and 235:
12-7 Name Reteach Choose a Strategy
- Page 236:
12-7 Name Skills Practice Problem-S
- Page 239 and 240:
13-1 Name Date Skills Practice Part
- Page 241 and 242:
13-2 Name Date Skills Practice Part
- Page 243 and 244:
13-3 Name Reteach (continued) Date
- Page 246 and 247:
13-4 Name Reteach Equivalent Fracti
- Page 248 and 249:
13-5 Name Reteach Simplest Form Dat
- Page 250 and 251:
13-6 Name Reteach Choose a Strategy
- Page 252:
13-6 Name Skills Practice Problem-S
- Page 255 and 256:
13-7 Name Skills Practice Date 4NS1
- Page 257 and 258:
13-8 Name Skills Practice Date 3NS3
- Page 259 and 260:
13-9 Name Date Skills Practice Mixe
- Page 261 and 262:
14-1 Name Skills Practice Date 4NS1
- Page 263 and 264:
14-2 Name Date Skills Practice Rela
- Page 265 and 266:
14-3 Name Date Reteach (continued)
- Page 268 and 269:
14-4 Name Reteach Date 4NS1.2, 4NS1
- Page 270 and 271:
14-5 Name Reteach Date Kyle bought
- Page 272:
14-5 Name Skills Practice Use any s
- Page 275 and 276:
14-6 Name Skills Practice Date 4NS1
- Page 277 and 278:
14-7 Name Date Skills Practice Deci
- Page 279 and 280:
15-1 Name Skills Practice Date 4NS2
- Page 281 and 282:
15-2 Name Date Skills Practice Esti
- Page 283 and 284:
15-3 Name Reteach (continued) Date
- Page 286 and 287:
15-4 Name Reteach Add Decimals You
- Page 288 and 289:
15-5 Name Reteach Problem-Solving I
- Page 290:
15-5 Name Date Skills Practice Prob
- Page 293 and 294:
15-6 Name Skills Practice Date 4NS2
- Page 295 and 296:
16-1 Name Skills Practice Probabili
- Page 297 and 298:
16-2 Name Skills Practice Date 4SDA
- Page 299 and 300:
16-3 Name Reteach (continued) Probl
- Page 302 and 303:
16-4 Name Reteach Find Probability
- Page 304 and 305:
16-5 Name Reteach Problem-Solving I
- Page 306:
16-5 Name Skills Practice Date 4MR1
- Page 309:
16-6 Name Skills Practice Date 4SDA