

DIGITAL MARKETING HUB v2.0 - AdExchanger
DIGITAL MARKETING HUB v2.0 - AdExchanger
DIGITAL MARKETING HUB v2.0 - AdExchanger

You also want an ePaper? Increase the reach of your titles
YUMPU automatically turns print PDFs into web optimized ePapers that Google loves.
Digital Marketing Hub <strong>v2.0</strong><br />
BMO Capital Markets<br />
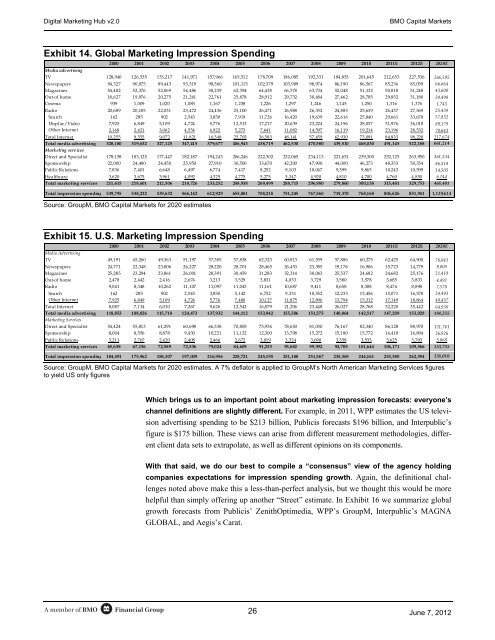
Exhibit 14. Global Marketing Impression Spending<br />
2000 2001 2002 2003 2004 2005 2006 2007 2008 2009 2010 2011E 2012E 2020E<br />
Media advertising<br />
TV 128,940 126,535 133,217 141,971 157,966 165,512 178,709 186,085 192,331 184,853 201,645 212,653 227,536 266,595<br />
Newspapers 94,327 90,075 89,443 93,319 98,560 101,115 102,379 103,909 98,974 86,190 86,567 85,236 85,059 66,664<br />
Magazines 54,402 52,376 52,069 54,486 58,239 62,394 64,438 66,378 63,734 52,048 51,132 50,818 51,248 43,600<br />
Out-of home 18,627 19,976 20,275 21,261 22,761 25,878 28,912 29,732 30,484 27,462 28,705 29,852 31,180 39,498<br />
Cinema 939 1,009 1,020 1,085 1,167 1,238 1,226 1,297 1,246 1,145 1,250 1,316 1,376 1,743<br />
Radio 20,689 20,105 22,031 23,472 24,436 25,100 26,471 26,988 26,352 24,883 25,639 26,437 27,569 25,439<br />
Search 162 285 902 2,543 3,850 7,919 11,726 16,420 19,639 22,616 25,840 29,661 33,670 57,852<br />
Display/Video 7,925 6,849 5,109 4,724 5,776 12,513 17,217 20,639 23,224 24,196 28,037 31,976 36,018 89,179<br />
Other Internet 2,168 2,421 3,062 4,554 6,922 5,273 7,641 11,082 14,597 16,119 19,214 23,196 28,532 70,643<br />
Total Internet 10,255 9,555 9,072 11,821 16,548 25,705 36,583 48,141 57,459 62,930 73,091 84,833 98,220 217,674<br />
Total media advertising 328,180 319,632 327,125 347,415 379,677 406,943 438,719 462,530 470,580 439,510 468,030 491,145 522,188 661,214<br />
Marketing services<br />
Direct and Specialist 178,158 183,125 177,447 182,187 194,243 206,246 222,302 232,065 234,113 221,651 239,300 252,125 263,950 361,234<br />
Sponsorship 22,000 24,400 24,450 25,950 27,910 30,500 33,670 42,200 47,900 44,000 46,273 48,353 50,354 86,518<br />
Public Relations 7,836 7,401 6,648 6,497 6,774 7,417 8,252 9,103 10,047 9,399 9,865 10,243 10,599 14,505<br />
Healthcare 3,620 3,675 3,961 4,092 4,325 4,775 5,275 5,347 4,920 4,810 4,700 4,760 4,850 6,144<br />
Total marketing services 211,615 218,601 212,506 218,726 233,252 248,938 269,499 288,715 296,980 279,860 300,138 315,481 329,753 468,401<br />
Total impression spending 539,795 538,232 539,632 566,142 612,929 655,881 708,218 751,245 767,560 719,370 768,168 806,626 851,941 1,129,614<br />
Source: GroupM, BMO Capital Markets for 2020 estimates<br />
Exhibit 15. U.S. Marketing Impression Spending<br />
2000 2001 2002 2003 2004 2005 2006 2007 2008 2009 2010 2011E 2012E 2020E<br />
Media Advertising<br />
TV 49,191 45,260 49,363 51,197 57,385 57,838 62,323 60,813 61,559 57,886 60,275 62,425 64,900 76,041<br />
Newspapers 24,771 22,348 23,806 26,227 28,220 28,701 28,465 26,453 23,385 19,176 16,906 15,723 14,779 9,805<br />
Magazines 25,285 23,294 23,861 26,001 28,391 30,459 31,283 32,314 30,043 25,537 24,682 24,682 25,176 21,419<br />
Out-of home 2,478 2,442 2,416 2,674 3,213 3,529 3,831 4,033 3,729 3,580 3,578 3,685 3,833 4,491<br />
Radio 9,041 8,348 10,262 11,107 11,097 11,043 11,161 10,687 9,411 8,658 8,308 8,474 8,898 7,570<br />
Search 162 285 902 2,543 3,850 5,142 6,752 9,331 10,552 12,233 13,456 15,071 16,578 24,493<br />
Other Internet 7,925 6,849 5,109 4,724 5,776 7,400 10,127 11,875 12,896 13,794 15,312 17,149 18,864 40,437<br />
Total Internet 8,087 7,134 6,010 7,267 9,626 12,542 16,879 21,206 23,448 26,027 28,768 32,220 35,442 64,930<br />
Total media advertising 118,853 108,826 115,718 124,473 137,932 144,112 153,942 155,506 151,575 140,864 142,517 147,209 153,028 184,255<br />
Marketing Services<br />
Direct and Specialist 54,424 55,813 61,291 60,698 66,338 70,805 75,934 78,650 81,030 76,167 82,340 86,128 88,970 121,761<br />
Sponsorship 8,004 8,556 8,878 9,430 10,221 11,132 12,300 13,708 15,272 15,180 15,772 16,418 16,894 26,926<br />
Public Relations 3,211 2,767 2,420 2,408 2,466 2,672 3,019 3,324 3,690 3,358 3,533 3,625 3,703 5,068<br />
Total marketing services 65,638 67,136 72,589 72,536 79,024 84,609 91,253 95,682 99,992 94,705 101,644 106,171 109,566 153,755<br />
Total impression spending 184,491 175,962 188,307 197,009 216,956 228,721 245,195 251,188 251,567 235,569 244,161 253,380 262,594 338,010<br />
Source: GroupM, BMO Capital Markets for 2020 estimates. A 7% deflator is applied to GroupM’s North American Marketing Services figures<br />
to yield US only figures<br />
Which brings us to an important point about marketing impression forecasts: everyone’s<br />
channel definitions are slightly different. For example, in 2011, WPP estimates the US television<br />
advertising spending to be $213 billion, Publicis forecasts $196 billion, and Interpublic’s<br />
figure is $175 billion. These views can arise from different measurement methodologies, different<br />
client data sets to extrapolate, as well as different opinions on its components.<br />
With that said, we do our best to compile a “consensus” view of the agency holding<br />
companies expectations for impression spending growth. Again, the definitional challenges<br />
noted above make this a less-than-perfect analysis, but we thought this would be more<br />
helpful than simply offering up another “Street” estimate. In Exhibit 16 we summarize global<br />
growth forecasts from Publicis’ ZenithOptimedia, WPP’s GroupM, Interpublic’s MAGNA<br />
GLOBAL, and Aegis’s Carat.<br />
A member of BMO<br />
Financial Group<br />
26<br />
June 7, 2012