Special Edition-07.pdf - Lahore School of Economics
Special Edition-07.pdf - Lahore School of Economics
Special Edition-07.pdf - Lahore School of Economics

You also want an ePaper? Increase the reach of your titles
YUMPU automatically turns print PDFs into web optimized ePapers that Google loves.
Financial Sector Restructuring in Pakistan 115<br />
The ratio <strong>of</strong> currency to broad money (M2) would tend to fall in the<br />
financial environment where market forces dominate, where there are<br />
alternative saving investment instruments (stocks, bonds, mutual funds etc.)<br />
that raise the real rate <strong>of</strong> return, where there is confidence in the banking<br />
system and where access to the banking system has expanded. The ratio fell<br />
from 37.56% in 1990 to 23% in 2005. This implies the dominance <strong>of</strong><br />
market forces and retains the confidence <strong>of</strong> the customer in the banking<br />
system. Furthermore, the low ratio <strong>of</strong> currency to money mainly reflects<br />
advancement in the payment system, which heavily relies on credit cards,<br />
the development <strong>of</strong> the banking system and that money can be transferred<br />
between checking and savings accounts easily without any significant cost.<br />
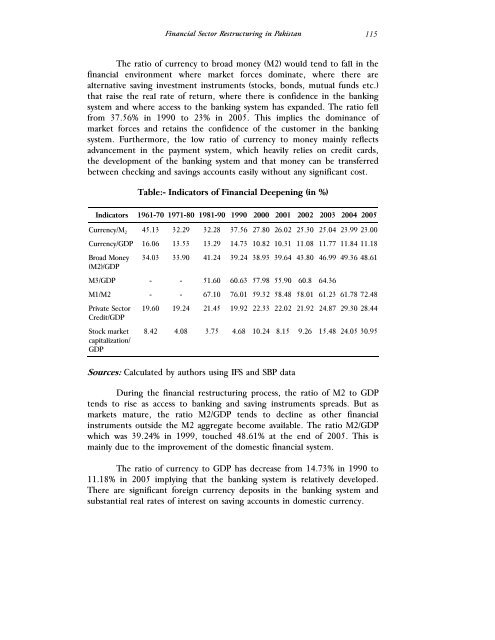
Table:- Indicators <strong>of</strong> Financial Deepening (in %)<br />
Indicators 1961-70 1971-80 1981-90 1990 2000 2001 2002 2003 2004 2005<br />
Currency/M 2 45.13 32.29 32.28 37.56 27.80 26.02 25.30 25.04 23.99 23.00<br />
Currency/GDP 16.06 13.53 13.29 14.73 10.82 10.31 11.08 11.77 11.84 11.18<br />
Broad Money<br />
(M2)/GDP<br />
34.03 33.90 41.24 39.24 38.93 39.64 43.80 46.99 49.36 48.61<br />
M3/GDP - - 51.60 60.63 57.98 55.90 60.8 64.36<br />
M1/M2 - - 67.10 76.01 59.32 58.48 58.01 61.23 61.78 72.48<br />
Private Sector<br />
Credit/GDP<br />
Stock market<br />
capitalization/<br />
GDP<br />
19.60 19.24 21.45 19.92 22.33 22.02 21.92 24.87 29.30 28.44<br />
8.42 4.08 3.75 4.68 10.24 8.15 9.26 15.48 24.05 30.95<br />
Sources: Calculated by authors using IFS and SBP data<br />
During the financial restructuring process, the ratio <strong>of</strong> M2 to GDP<br />
tends to rise as access to banking and saving instruments spreads. But as<br />
markets mature, the ratio M2/GDP tends to decline as other financial<br />
instruments outside the M2 aggregate become available. The ratio M2/GDP<br />
which was 39.24% in 1999, touched 48.61% at the end <strong>of</strong> 2005. This is<br />
mainly due to the improvement <strong>of</strong> the domestic financial system.<br />
The ratio <strong>of</strong> currency to GDP has decrease from 14.73% in 1990 to<br />
11.18% in 2005 implying that the banking system is relatively developed.<br />
There are significant foreign currency deposits in the banking system and<br />
substantial real rates <strong>of</strong> interest on saving accounts in domestic currency.