


You also want an ePaper? Increase the reach of your titles
YUMPU automatically turns print PDFs into web optimized ePapers that Google loves.
150 8 Scoring Matrices<br />
350<br />
300<br />
PAM distance<br />
250<br />
200<br />
150<br />
100<br />
50<br />
0<br />
0<br />
5<br />
10<br />
15<br />
20<br />
25<br />
30<br />
35<br />
40<br />
45<br />
50<br />
55<br />
60<br />
65<br />
70<br />
75<br />
80<br />
85<br />
Observed Percent Difference<br />
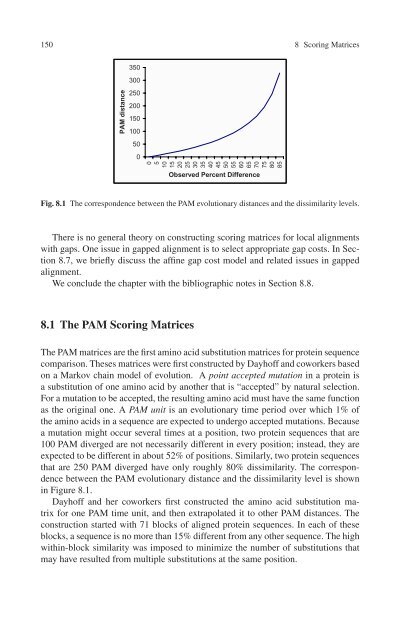
Fig. 8.1 The correspondence between the PAM evolutionary distances and the dissimilarity levels.<br />
There is no general theory on constructing scoring matrices for local alignments<br />
with gaps. One issue in gapped alignment is to select appropriate gap costs. In Section<br />
8.7, we briefly discuss the affine gap cost model and related issues in gapped<br />
alignment.<br />
We conclude the chapter with the bibliographic notes in Section 8.8.<br />
8.1 The PAM Scoring Matrices<br />
The PAM matrices are the first amino acid substitution matrices for protein sequence<br />
comparison. Theses matrices were first constructed by Dayhoff and coworkers based<br />
on a Markov chain model of evolution. A point accepted mutation in a protein is<br />
a substitution of one amino acid by another that is “accepted” by natural selection.<br />
For a mutation to be accepted, the resulting amino acid must have the same function<br />
as the original one. A PAM unit is an evolutionary time period over which 1% of<br />
the amino acids in a sequence are expected to undergo accepted mutations. Because<br />
a mutation might occur several times at a position, two protein sequences that are<br />
100 PAM diverged are not necessarily different in every position; instead, they are<br />
expected to be different in about 52% of positions. Similarly, two protein sequences<br />
that are 250 PAM diverged have only roughly 80% dissimilarity. The correspondence<br />
between the PAM evolutionary distance and the dissimilarity level is shown<br />
in Figure 8.1.<br />
Dayhoff and her coworkers first constructed the amino acid substitution matrix<br />
for one PAM time unit, and then extrapolated it to other PAM distances. The<br />
construction started with 71 blocks of aligned protein sequences. In each of these<br />
blocks, a sequence is no more than 15% different from any other sequence. The high<br />
within-block similarity was imposed to minimize the number of substitutions that<br />
may have resulted from multiple substitutions at the same position.


