


Create successful ePaper yourself
Turn your PDF publications into a flip-book with our unique Google optimized e-Paper software.
158 8 Scoring Matrices<br />
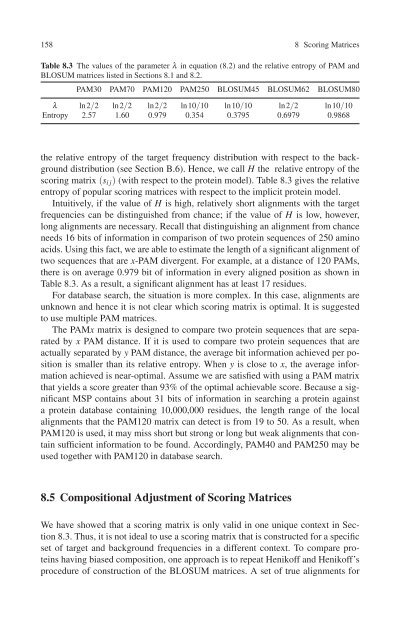
Table 8.3 The values of the parameter λ in equation (8.2) and the relative entropy of PAM and<br />
BLOSUM matrices listed in Sections 8.1 and 8.2.<br />
PAM30 PAM70 PAM120 PAM250 BLOSUM45 BLOSUM62 BLOSUM80<br />
λ ln2/2 ln2/2 ln2/2 ln10/10 ln10/10 ln2/2 ln10/10<br />
Entropy 2.57 1.60 0.979 0.354 0.3795 0.6979 0.9868<br />
the relative entropy of the target frequency distribution with respect to the background<br />
distribution (see Section B.6). Hence, we call H the relative entropy of the<br />
scoring matrix (s ij ) (with respect to the protein model). Table 8.3 gives the relative<br />
entropy of popular scoring matrices with respect to the implicit protein model.<br />
Intuitively, if the value of H is high, relatively short alignments with the target<br />
frequencies can be distinguished from chance; if the value of H is low, however,<br />
long alignments are necessary. Recall that distinguishing an alignment from chance<br />
needs 16 bits of information in comparison of two protein sequences of 250 amino<br />
acids. Using this fact, we are able to estimate the length of a significant alignment of<br />
two sequences that are x-PAM divergent. For example, at a distance of 120 PAMs,<br />
there is on average 0.979 bit of information in every aligned position as shown in<br />
Table 8.3. As a result, a significant alignment has at least 17 residues.<br />
For database search, the situation is more complex. In this case, alignments are<br />
unknown and hence it is not clear which scoring matrix is optimal. It is suggested<br />
to use multiple PAM matrices.<br />
The PAMx matrix is designed to compare two protein sequences that are separated<br />
by x PAM distance. If it is used to compare two protein sequences that are<br />
actually separated by y PAM distance, the average bit information achieved per position<br />
is smaller than its relative entropy. When y is close to x, the average information<br />
achieved is near-optimal. Assume we are satisfied with using a PAM matrix<br />
that yields a score greater than 93% of the optimal achievable score. Because a significant<br />
MSP contains about 31 bits of information in searching a protein against<br />
a protein database containing 10,000,000 residues, the length range of the local<br />
alignments that the PAM120 matrix can detect is from 19 to 50. As a result, when<br />
PAM120 is used, it may miss short but strong or long but weak alignments that contain<br />
sufficient information to be found. Accordingly, PAM40 and PAM250 may be<br />
used together with PAM120 in database search.<br />
8.5 Compositional Adjustment of Scoring Matrices<br />
We have showed that a scoring matrix is only valid in one unique context in Section<br />
8.3. Thus, it is not ideal to use a scoring matrix that is constructed for a specific<br />
set of target and background frequencies in a different context. To compare proteins<br />
having biased composition, one approach is to repeat Henikoff and Henikoff’s<br />
procedure of construction of the BLOSUM matrices. A set of true alignments for


