2009 Proceedings of the Cornell Nutrition Conference For Feed ...
2009 Proceedings of the Cornell Nutrition Conference For Feed ...
2009 Proceedings of the Cornell Nutrition Conference For Feed ...

Create successful ePaper yourself
Turn your PDF publications into a flip-book with our unique Google optimized e-Paper software.
<strong>of</strong> dietary RUP achieved by this approach, a frequent result has been lower total<br />
concentrate costs by allowing <strong>the</strong> inclusion <strong>of</strong> lower cost feeds that can contribute well<br />
to total dietary NFC. This approach has been implemented with herds at all levels <strong>of</strong><br />
milk production with equal effect.<br />
The primary basis for realizing <strong>the</strong>se responses has been <strong>the</strong> excellent predictive<br />
reliability exhibited by <strong>the</strong> NRC (2001) model in commercial production environments in<br />
terms <strong>of</strong> NE(l) allowable and MP allowable milk. In all situations where previous diets<br />
have been reviewed and revised a significant gap between energy allowable milk and<br />
MP allowable milk has been observed. This phenomenon has been evident regardless<br />
<strong>of</strong> which o<strong>the</strong>r model was used to formulate <strong>the</strong> previous diets. In <strong>the</strong>se diets, MP<br />
allowable milk has been found to be <strong>the</strong> fundamental limiting factor in production <strong>of</strong> milk<br />
and milk components and thus <strong>the</strong> primary factor predicting animal response. Simply<br />
closing this gap, even without optimizing MP-Lys and MP-Met in MP, has produced<br />
significant results. The additional responses and benefits described previously are<br />
obtained when AA balance and reduction <strong>of</strong> RUP/MP are addressed. It is important to<br />
note that what has been described has been achieved by using <strong>For</strong>mulate2/NRC 2001<br />
“out-<strong>of</strong>-<strong>the</strong>-box” without <strong>the</strong> need to make adjustments to <strong>the</strong> rates and constants <strong>of</strong><br />
various model predictive mechanisms.<br />
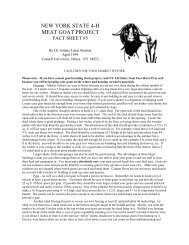
One example <strong>of</strong> a farm situation follows. The graphs below illustrate changes in milk<br />
protein percentage and milk protein yield when balancing for MP-Lys and MP-Met in a<br />
herd <strong>of</strong> approximately 1700 cows with significant, ongoing management issues and less<br />
than average milk production. The two periods shown are <strong>the</strong> same weeks <strong>of</strong> <strong>the</strong> year in<br />
different years.<br />
Milk Proein%<br />
3.45<br />
3.4<br />
3.35<br />
3.3<br />
3.25<br />
3.2<br />
3.15<br />
3.1<br />
3.05<br />
3<br />
1 2 3 4 5 6 7 8 9 10 11 12<br />
Prot% Oct-Dec 2007 3.25 3.27 3.29 3.23 3.23 3.23 3.2 3.23 3.26 3.28 3 25 3.21<br />
Prot% Oct-Dec 2008 3.18 3.28 3.3 3.31 3.31 3.35 3.35 3.34 3.33 3.34 3 37 3.4<br />
Weeks <strong>of</strong> period Oct 1st through December 31st<br />
Herd average milk flow was 63.2 lbs for <strong>the</strong> 2007 period and 70.0 lbs for <strong>the</strong> 2008<br />
period. The 2007 diets were balanced for MP only with dietary CP at 17.9% which did<br />
yield improvement over historical milk protein production. The MP supply targets for <strong>the</strong><br />
11