2005 - Asianbanks.net
2005 - Asianbanks.net
2005 - Asianbanks.net

Create successful ePaper yourself
Turn your PDF publications into a flip-book with our unique Google optimized e-Paper software.
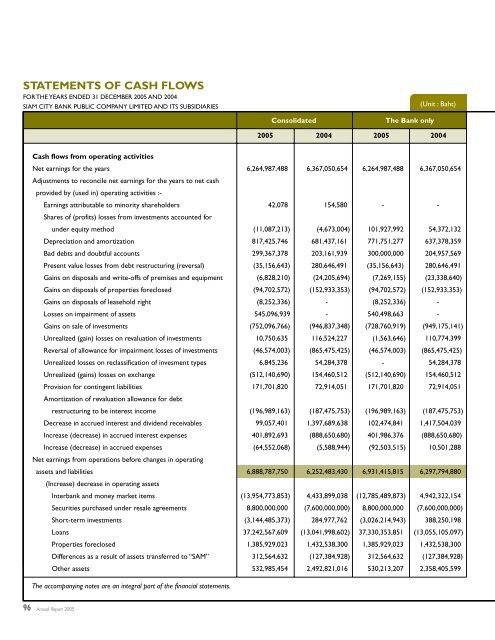
STATEMENTS OF CASH FLOWS<br />
FOR THE YEARS ENDED 31 DECEMBER <strong>2005</strong> AND 2004<br />
SIAM CITY BANK PUBLIC COMPANY LIMITED AND ITS SUBSIDIARIES<br />
(Unit : Baht)<br />
Consolidated<br />
The Bank only<br />
<strong>2005</strong> 2004 <strong>2005</strong> 2004<br />
Cash flows from operating activities<br />
Net earnings for the years 6,264,987,488 6,367,050,654 6,264,987,488 6,367,050,654<br />
Adjustments to reconcile <strong>net</strong> earnings for the years to <strong>net</strong> cash<br />
provided by (used in) operating activities :-<br />
Earnings attributable to minority shareholders 42,078 154,580 - -<br />
Shares of (profits) losses from investments accounted for<br />
under equity method (11,087,213) (4,673,004) 101,927,992 54,372,132<br />
Depreciation and amortization 817,425,746 681,437,161 771,751,277 637,378,359<br />
Bad debts and doubtful accounts 299,367,378 203,161,939 300,000,000 204,957,569<br />
Present value losses from debt restructuring (reversal) (35,156,643) 280,646,491 (35,156,643) 280,646,491<br />
Gains on disposals and write-offs of premises and equipment (6,828,210) (24,205,694) (7,269,155) (23,338,640)<br />
Gains on disposals of properties foreclosed (94,702,572) (152,933,353) (94,702,572) (152,933,353)<br />
Gains on disposals of leasehold right (8,252,336) - (8,252,336) -<br />
Losses on impairment of assets 545,096,939 - 540,498,663 -<br />
Gains on sale of investments (752,096,766) (946,837,348) (728,760,919) (949,175,141)<br />
Unrealized (gain) losses on revaluation of investments 10,750,635 116,524,227 (1,563,646) 110,774,399<br />
Reversal of allowance for impairment losses of investments (46,574,003) (865,475,425) (46,574,003) (865,475,425)<br />
Unrealized losses on reclassification of invesment types 6,845,236 54,284,378 - 54,284,378<br />
Unrealized (gains) losses on exchange (512,140,690) 154,460,512 (512,140,690) 154,460,512<br />
Provision for contingent liabilities 171,701,820 72,914,051 171,701,820 72,914,051<br />
Amortization of revaluation allowance for debt<br />
restructuring to be interest income (196,989,163) (187,475,753) (196,989,163) (187,475,753)<br />
Decrease in accrued interest and dividend receivables 99,057,401 1,397,689,638 102,474,841 1,417,504,039<br />
Increase (decrease) in accrued interest expenses 401,892,693 (888,650,680) 401,986,376 (888,650,680)<br />
Increase (decrease) in accrued expenses (64,552,068) (5,588,944) (92,503,515) 10,501,288<br />
Net earnings from operations before changes in operating<br />
assets and liabilities 6,888,787,750 6,252,483,430 6,931,415,815 6,297,794,880<br />
(Increase) decrease in operating assets<br />
Interbank and money market items (13,954,773,853) 4,433,899,038 (12,785,489,873) 4,942,322,154<br />
Securities purchased under resale agreements 8,800,000,000 (7,600,000,000) 8,800,000,000 (7,600,000,000)<br />
Short-term investments (3,144,485,373) 284,977,762 (3,026,214,943) 388,250,198<br />
Loans 37,242,567,609 (13,041,998,602) 37,330,353,851 (13,055,105,097)<br />
Properties foreclosed 1,385,929,023 1,432,538,300 1,385,929,023 1,432,538,300<br />
Differences as a result of assets transferred to “SAM” 312,564,632 (127,384,928) 312,564,632 (127,384,928)<br />
Other assets 532,985,454 2,492,821,016 530,213,207 2,358,405,599<br />
The accompanying notes are an integral part of the financial statements.<br />
96