Instruction Manual - Beta Industries
Instruction Manual - Beta Industries
Instruction Manual - Beta Industries

You also want an ePaper? Increase the reach of your titles
YUMPU automatically turns print PDFs into web optimized ePapers that Google loves.
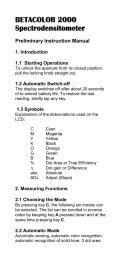
The following information is shown in the LCD:<br />
• Reference curve: this is drawn in light gray. The sample points<br />
(patches being measured) are indicated by vertical lines at the<br />
corresponding locations.<br />
• Plate characteristic curve: this is drawn in black, with the curve<br />
being plotted accordingly after each measurement.<br />
• Next patch to be measured: the nominal value of the next patch to<br />
be measured is shown on the lower left edge of the Y axis and its<br />
expected reference value is shown above it. If all of the patches<br />
have been measured this display is empty.<br />
• Current measurement value: the measurement value of the patch<br />
just measured is shown in black on the top left corner of the Y axis<br />
and the expected reference value is shown below it. If no patch has<br />
been measured yet after a restart, this display will be empty.<br />
A black arrow on the X axis gives a graphic representation of the<br />
next nominal value to be measured.<br />
3<br />
39/49