and Strategic Initiatives 2008â2009 - Laramie County School District ...
and Strategic Initiatives 2008â2009 - Laramie County School District ...
and Strategic Initiatives 2008â2009 - Laramie County School District ...

Create successful ePaper yourself
Turn your PDF publications into a flip-book with our unique Google optimized e-Paper software.
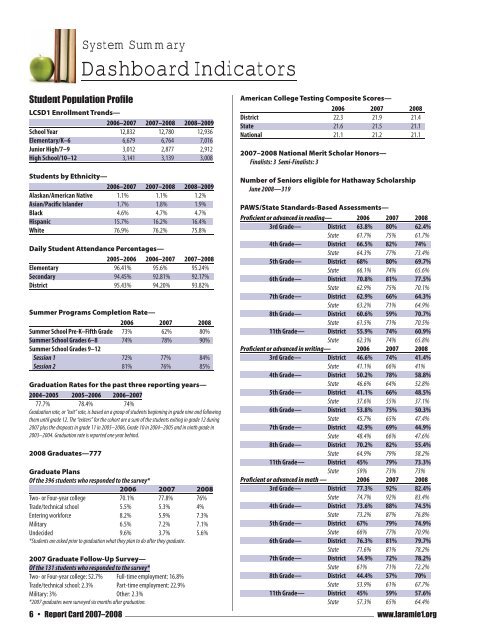
System Summary<br />
Dashboard Indicators<br />
Student Population Profile<br />
LCSD1 Enrollment Trends—<br />
2006–2007 2007–2008 2008–2009<br />
<strong>School</strong> Year 12,832 12,780 12,936<br />
Elementary/K–6 6,679 6,764 7,016<br />
Junior High/7–9 3,012 2,877 2,912<br />
High <strong>School</strong>/10–12 3,141 3,139 3,008<br />
American College Testing Composite Scores—<br />
2006 2007 2008<br />
<strong>District</strong> 22.3 21.9 21.4<br />
State 21.6 21.5 21.1<br />
National 21.1 21.2 21.1<br />
2007–2008 National Merit Scholar Honors—<br />
Finalists: 3 Semi-Finalists: 3<br />
Students by Ethnicity—<br />
2006–2007 2007–2008 2008–2009<br />
Alaskan/American Native 1.1% 1.1% 1.2%<br />
Asian/Pacific Isl<strong>and</strong>er 1.7% 1.8% 1.9%<br />
Black 4.6% 4.7% 4.7%<br />
Hispanic 15.7% 16.2% 16.4%<br />
White 76.9% 76.2% 75.8%<br />
Daily Student Attendance Percentages—<br />
2005–2006 2006–2007 2007–2008<br />
Elementary 96.41% 95.6% 95.24%<br />
Secondary 94.45% 92.81% 92.17%<br />
<strong>District</strong> 95.43% 94.20% 93.82%<br />
Summer Programs Completion Rate—<br />
2006 2007 2008<br />
Summer <strong>School</strong> Pre-K–Fifth Grade 73% 62% 80%<br />
Summer <strong>School</strong> Grades 6–8 74% 78% 90%<br />
Summer <strong>School</strong> Grades 9–12<br />
Session 1 72% 77% 84%<br />
Session 2 81% 76% 85%<br />
Graduation Rates for the past three reporting years—<br />
2004–2005 2005–2006 2006–2007<br />
77.7% 78.4% 74%<br />
Graduation rate, or “exit” rate, is based on a group of students beginning in grade nine <strong>and</strong> following<br />
them until grade 12. The “exiters” for the cohort are a sum of the students exiting in grade 12 during<br />
2007 plus the dropouts in grade 11 in 2005–2006, Grade 10 in 2004–2005 <strong>and</strong> in ninth grade in<br />
2003–2004. Graduation rate is reported one year behind.<br />
2008 Graduates—777<br />
Graduate Plans<br />
Of the 396 students who responded to the survey*<br />
2006 2007 2008<br />
Two- or Four-year college 70.1% 77.8% 76%<br />
Trade/technical school 5.5% 5.3% 4%<br />
Entering workforce 8.2% 5.9% 7.3%<br />
Military 6.5% 7.2% 7.1%<br />
Undecided 9.6% 3.7% 5.6%<br />
*Students are asked prior to graduation what they plan to do after they graduate.<br />
2007 Graduate Follow-Up Survey—<br />
Of the 131 students who responded to the survey*<br />
Two- or Four-year college: 52.7% Full-time employment: 16.8%<br />
Trade/technical school: 2.3% Part-time employment: 22.9%<br />
Military: 3% Other: 2.3%<br />
*2007 graduates were surveyed six months after graduation.<br />
Number of Seniors eligible for Hathaway Scholarship<br />
June 2008—319<br />
PAWS/State St<strong>and</strong>ards-Based Assessments—<br />
Proficient or advanced in reading— 2006 2007 2008<br />
3rd Grade— <strong>District</strong> 63.8% 80% 62.4%<br />
State 61.7% 75% 61.7%<br />
4th Grade— <strong>District</strong> 66.5% 82% 74%<br />
State 64.3% 77% 73.4%<br />
5th Grade— <strong>District</strong> 68% 80% 69.7%<br />
State 66.1% 74% 65.6%<br />
6th Grade— <strong>District</strong> 70.8% 81% 77.5%<br />
State 62.9% 75% 70.1%<br />
7th Grade— <strong>District</strong> 62.9% 66% 64.3%<br />
State 63.2% 71% 64.9%<br />
8th Grade— <strong>District</strong> 60.6% 59% 70.7%<br />
State 61.5% 71% 70.5%<br />
11th Grade— <strong>District</strong> 55.9% 74% 60.9%<br />
State 62.3% 74% 65.8%<br />
Proficient or advanced in writing— 2006 2007 2008<br />
3rd Grade— <strong>District</strong> 46.6% 74% 41.4%<br />
State 41.1% 66% 41%<br />
4th Grade— <strong>District</strong> 50.2% 78% 58.8%<br />
State 46.6% 64% 52.8%<br />
5th Grade— <strong>District</strong> 41.1% 66% 48.5%<br />
State 37.6% 55% 37.1%<br />
6th Grade— <strong>District</strong> 53.8% 75% 50.3%<br />
State 45.7% 65% 47.4%<br />
7th Grade— <strong>District</strong> 42.9% 69% 44.9%<br />
State 48.4% 66% 47.6%<br />
8th Grade— <strong>District</strong> 70.2% 82% 55.4%<br />
State 64.9% 79% 58.2%<br />
11th Grade— <strong>District</strong> 45% 79% 73.3%<br />
State 59% 73% 73%<br />
Proficient or advanced in math — 2006 2007 2008<br />
3rd Grade— <strong>District</strong> 77.3% 92% 82.4%<br />
State 74.7% 92% 83.4%<br />
4th Grade— <strong>District</strong> 73.6% 88% 74.5%<br />
State 73.2% 87% 76.8%<br />
5th Grade— <strong>District</strong> 67% 79% 74.9%<br />
State 66% 77% 70.9%<br />
6th Grade— <strong>District</strong> 76.3% 81% 79.7%<br />
State 71.6% 81% 78.2%<br />
7th Grade— <strong>District</strong> 54.9% 72% 78.2%<br />
State 61% 71% 72.2%<br />
8th Grade— <strong>District</strong> 44.4% 57% 70%<br />
State 53.9% 61% 67.7%<br />
11th Grade— <strong>District</strong> 45% 59% 57.6%<br />
State 57.3% 65% 64.4%<br />
6 • Report Card 2007–2008 www.laramie1.org