- Page 1 and 2: Seepage Modeling with SEEP/W An Eng
- Page 3 and 4: SEEP/W Table of Contents Table of C
- Page 5 and 6: SEEP/W Table of Contents Method 3 (
- Page 7 and 8: SEEP/W Table of Contents Equipotent
- Page 9 and 10: SEEP/W Chapter 1: Introduction 1 In
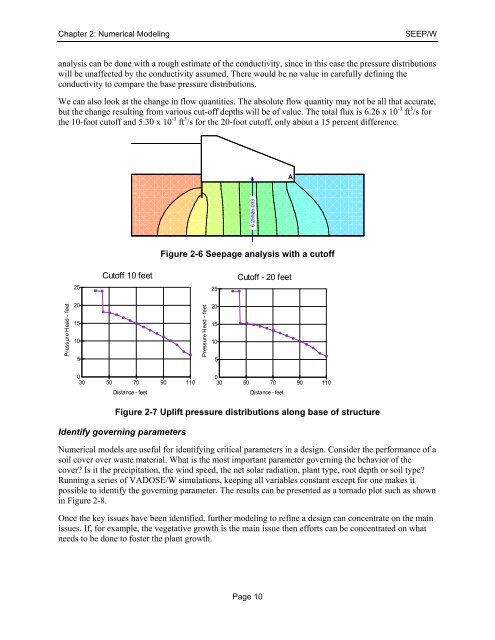
- Page 11 and 12: SEEP/W Chapter 2: Numerical Modelin
- Page 13 and 14: SEEP/W Chapter 2: Numerical Modelin
- Page 15 and 16: SEEP/W Chapter 2: Numerical Modelin
- Page 17: SEEP/W Chapter 2: Numerical Modelin
- Page 21 and 22: SEEP/W Chapter 2: Numerical Modelin
- Page 23 and 24: SEEP/W Chapter 2: Numerical Modelin
- Page 25 and 26: SEEP/W Chapter 2: Numerical Modelin
- Page 27 and 28: SEEP/W Chapter 2: Numerical Modelin
- Page 29 and 30: SEEP/W Chapter 2: Numerical Modelin
- Page 31 and 32: SEEP/W Chapter 2: Numerical Modelin
- Page 33 and 34: SEEP/W Chapter 3: Geometry and Mesh
- Page 35 and 36: SEEP/W Chapter 3: Geometry and Mesh
- Page 37 and 38: SEEP/W Chapter 3: Geometry and Mesh
- Page 39 and 40: SEEP/W Chapter 3: Geometry and Mesh
- Page 41 and 42: SEEP/W Chapter 3: Geometry and Mesh
- Page 43 and 44: SEEP/W Chapter 3: Geometry and Mesh
- Page 45 and 46: SEEP/W Chapter 3: Geometry and Mesh
- Page 47 and 48: SEEP/W Chapter 3: Geometry and Mesh
- Page 49 and 50: SEEP/W Chapter 3: Geometry and Mesh
- Page 51 and 52: SEEP/W Chapter 3: Geometry and Mesh
- Page 53 and 54: SEEP/W Chapter 3: Geometry and Mesh
- Page 55 and 56: SEEP/W Chapter 3: Geometry and Mesh
- Page 57 and 58: SEEP/W Chapter 3: Geometry and Mesh
- Page 59 and 60: SEEP/W Chapter 3: Geometry and Mesh
- Page 61 and 62: SEEP/W Chapter 4: Material Models a
- Page 63 and 64: SEEP/W Chapter 4: Material Models a
- Page 65 and 66: SEEP/W Chapter 4: Material Models a
- Page 67 and 68: SEEP/W Chapter 4: Material Models a
- Page 69 and 70:
SEEP/W Chapter 4: Material Models a
- Page 71 and 72:
SEEP/W Chapter 4: Material Models a
- Page 73 and 74:
SEEP/W Chapter 4: Material Models a
- Page 75 and 76:
2 SEEP/W Chapter 4: Material Models
- Page 77 and 78:
SEEP/W Chapter 4: Material Models a
- Page 79 and 80:
SEEP/W Chapter 4: Material Models a
- Page 81 and 82:
SEEP/W Chapter 4: Material Models a
- Page 83 and 84:
SEEP/W Chapter 4: Material Models a
- Page 85 and 86:
SEEP/W Chapter 4: Material Models a
- Page 87 and 88:
SEEP/W Chapter 4: Material Models a
- Page 89 and 90:
SEEP/W Chapter 5: Boundary Conditio
- Page 91 and 92:
SEEP/W Chapter 5: Boundary Conditio
- Page 93 and 94:
SEEP/W Chapter 5: Boundary Conditio
- Page 95 and 96:
SEEP/W Chapter 5: Boundary Conditio
- Page 97 and 98:
SEEP/W Chapter 5: Boundary Conditio
- Page 99 and 100:
SEEP/W Chapter 5: Boundary Conditio
- Page 101 and 102:
SEEP/W Chapter 5: Boundary Conditio
- Page 103 and 104:
SEEP/W Chapter 5: Boundary Conditio
- Page 105 and 106:
SEEP/W Chapter 5: Boundary Conditio
- Page 107 and 108:
SEEP/W Chapter 5: Boundary Conditio
- Page 109 and 110:
SEEP/W Chapter 5: Boundary Conditio
- Page 111 and 112:
SEEP/W Chapter 5: Boundary Conditio
- Page 113:
SEEP/W Chapter 5: Boundary Conditio
- Page 116 and 117:
Chapter 6: Analysis Types SEEP/W ON
- Page 118 and 119:
Chapter 6: Analysis Types SEEP/W Fi
- Page 120 and 121:
Chapter 6: Analysis Types SEEP/W Fi
- Page 122 and 123:
Chapter 6: Analysis Types SEEP/W 6.
- Page 124 and 125:
Chapter 6: Analysis Types SEEP/W se
- Page 126 and 127:
Chapter 7: Functions in GeoStudio S
- Page 128 and 129:
Chapter 7: Functions in GeoStudio S
- Page 130 and 131:
Chapter 7: Functions in GeoStudio S
- Page 132 and 133:
Chapter 8: Numerical Issues SEEP/W
- Page 134 and 135:
Chapter 8: Numerical Issues SEEP/W
- Page 136 and 137:
Chapter 8: Numerical Issues SEEP/W
- Page 138 and 139:
Chapter 8: Numerical Issues SEEP/W
- Page 140 and 141:
15 Chapter 9: Flow nets, seepage fo
- Page 142 and 143:
Chapter 9: Flow nets, seepage force
- Page 144 and 145:
Chapter 9: Flow nets, seepage force
- Page 146 and 147:
Chapter 9: Flow nets, seepage force
- Page 148 and 149:
Chapter 9: Flow nets, seepage force
- Page 150 and 151:
Chapter 9: Flow nets, seepage force
- Page 152 and 153:
Chapter 9: Flow nets, seepage force
- Page 154 and 155:
Chapter 11: Modeling Tips and Trick
- Page 156 and 157:
Chapter 11: Modeling Tips and Trick
- Page 158 and 159:
Chapter 11: Modeling Tips and Trick
- Page 160 and 161:
Chapter 11: Modeling Tips and Trick
- Page 162 and 163:
Chapter 11: Modeling Tips and Trick
- Page 164 and 165:
Chapter 11: Modeling Tips and Trick
- Page 166 and 167:
Chapter 11: Modeling Tips and Trick
- Page 168 and 169:
Chapter 11: Modeling Tips and Trick
- Page 170 and 171:
Chapter 11: Modeling Tips and Trick
- Page 172 and 173:
Chapter 11: Modeling Tips and Trick
- Page 174 and 175:
Chapter 11: Modeling Tips and Trick
- Page 176 and 177:
Chapter 11: Modeling Tips and Trick
- Page 178 and 179:
Chapter 12: Illustrative Examples S
- Page 180 and 181:
Chapter 13: Theory SEEP/W k x k y Q
- Page 182 and 183:
Chapter 13: Theory SEEP/W L = a des
- Page 184 and 185:
Chapter 13: Theory SEEP/W Table 13-
- Page 186 and 187:
Chapter 13: Theory SEEP/W [ C] = wh
- Page 188 and 189:
Chapter 13: Theory SEEP/W { Q} = q
- Page 190 and 191:
Chapter 13: Theory SEEP/W Figure 13
- Page 192 and 193:
Chapter 13: Theory SEEP/W Page 184
- Page 194 and 195:
References SEEP/W Figure 14-1 Globa
- Page 196 and 197:
References SEEP/W In equation form,
- Page 198 and 199:
References SEEP/W Table 14-4 Interp
- Page 200 and 201:
References SEEP/W Burland J.B. 1996
- Page 202 and 203:
References SEEP/W Swanson, D. 1991.
- Page 204 and 205:
SEEP/W Index Adaptive time stepping
- Page 206 and 207:
SEEP/W Seepage faces ..............