International Reactor Dosimetry File 2002 - IAEA Publications
International Reactor Dosimetry File 2002 - IAEA Publications
International Reactor Dosimetry File 2002 - IAEA Publications

Create successful ePaper yourself
Turn your PDF publications into a flip-book with our unique Google optimized e-Paper software.
6. FINAL SELECTION OF CROSS-SECTIONS FOR<br />
IRDF-<strong>2002</strong>, AND CHARACTERIZATION<br />
OF THE SELECTED DATA<br />
E.M. Zsolnay, H.J. Nolthenius<br />
The final selection of cross-section data for IRDF-<strong>2002</strong> was made during<br />
a technical meeting held at the <strong>IAEA</strong> in Vienna from 1 to 3 October 2003 [6.1].<br />
This selection procedure was based on the following considerations:<br />
(a)<br />
(b)<br />
(c)<br />
Comparison of the integral values of the candidate cross-sections with the<br />
corresponding experimental results in the four standard neutron fields<br />
(thermal Maxwellian, 1/E slowing down, 252 Cf fission and 14 MeV<br />
neutron field) recommended for the purpose of cross-section selection<br />
[6.2].<br />
Quality of the uncertainty information.<br />
Consistency of the data (C/E values compared with the corresponding<br />
uncertainty information).<br />
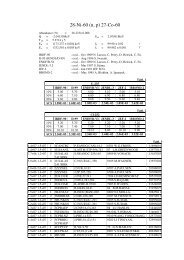
The cross-section and uncertainty data described in Sections 3, 4 and 5<br />
were used. However, in addition, spectrum averaged cross-sections were<br />
calculated for the theoretical function of the Watt fission spectrum [6.3–6.6].<br />
These data are presented in Table 6.1 for the candidate cross-sections of the<br />
fast neutron threshold reactions [6.6]. Such integral cross-section data are also<br />
published in standard neutron cross-section tables. The uncertainty<br />
information for the cross-sections is represented by the corresponding standard<br />
deviations above 1.05 MeV, weighted with a typical MTR spectrum [6.7]. The<br />
results in Table 6.1 show good agreement with those of Mannhart that were<br />
obtained in the 252 Cf fission spectrum (Section 4). The observed variations may<br />
be attributed to the differences between the two spectrum functions.<br />
Based on the results outlined in Sections 3, 4 and 5, and following the<br />
recommendations of Ref. [6.6], the final selection procedure resulted in the<br />
data files being chosen as summarized in Table 6.2. This table lists the crosssections<br />
included in IRDF-<strong>2002</strong>, together with their integral characteristics and<br />
the ratios of the corresponding calculated and experimental cross-section data<br />
(C/E). Uncertainties of the C/E values involve the standard deviations of both<br />
the calculated and experimental cross-sections. The following shortcomings<br />
occur in the chosen cross-section data:<br />
56