

outdoors-participation-report-v2
outdoors-participation-report-v2
outdoors-participation-report-v2

Create successful ePaper yourself
Turn your PDF publications into a flip-book with our unique Google optimized e-Paper software.
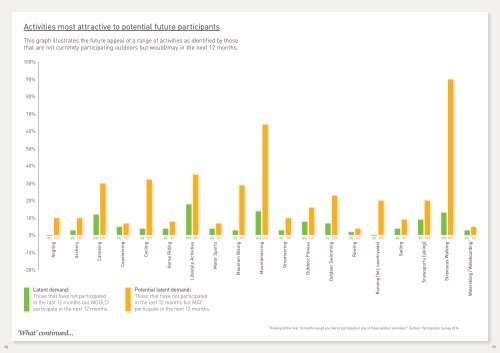
Activities most attractive to potential future participants<br />
This graph illustrates the future appeal of a range of activities as identified by those<br />
that are not currently participating <strong>outdoors</strong> but would/may in the next 12 months.<br />
100%<br />
90%<br />
80%<br />
70%<br />
60%<br />
50%<br />
40%<br />
30%<br />
20%<br />
10%<br />
0%<br />
0% 10%<br />
3% 10%<br />
12% 30%<br />
5% 7%<br />
4% 32%<br />
4% 8%<br />
18% 35%<br />
4% 7%<br />
3% 29%<br />
14% 64%<br />
3% 10%<br />
8% 16%<br />
7% 23%<br />
2% 4%<br />
0% 20%<br />
4% 9%<br />
9% 20%<br />
13% 90%<br />
3% 5%<br />
-10%<br />
-20%<br />
Angling<br />
Archery<br />
Canoeing<br />
Latent demand:<br />
Those that have not participated<br />
in the last 12 months but WOULD<br />
participate in the next 12 months.<br />
Coasteering<br />
Cycling<br />
Horse Riding<br />
Lifestyle Activities<br />
Potential latent demand:<br />
Those that have not participated<br />
in the last 12 months but MAY<br />
participate in the next 12 months.<br />
Motor Sports<br />
Mountain Biking<br />
Mountaineering<br />
Orienteering<br />
Outdoor Fitness<br />
Outdoor Swimming<br />
Rowing<br />
Running (fell, countryside)<br />
Sailing<br />
Snowsports (skiing)<br />
Strenuous Walking<br />
Waterskiing / Wakeboarding<br />
‘What’ continued...<br />
“Thinking of the next 12 months would you like to participate in any of these outdoor activities?” Outdoor Participation Survey 2014<br />
78 79