Elevated ozone in the boundary layer at South Pole - Doug Davis
Elevated ozone in the boundary layer at South Pole - Doug Davis
Elevated ozone in the boundary layer at South Pole - Doug Davis

Create successful ePaper yourself
Turn your PDF publications into a flip-book with our unique Google optimized e-Paper software.
ARTICLE IN PRESS<br />
D. Helmig et al. / Atmospheric Environment 42 (2008) 2788–2803 2797<br />
50<br />
40<br />
<strong>ozone</strong><br />
Ozone (ppbv), W<strong>in</strong>d speed, u* (m s -1 )<br />
30<br />
20<br />
10<br />
0<br />
w<strong>in</strong>d speed<br />
u* (x 50)<br />
w<strong>in</strong>d direction<br />
200<br />
100<br />
0<br />
W<strong>in</strong>d direction (sector)<br />
350 351 352 353 354 355 356 357 358 359 360 361 362 363 364 365<br />
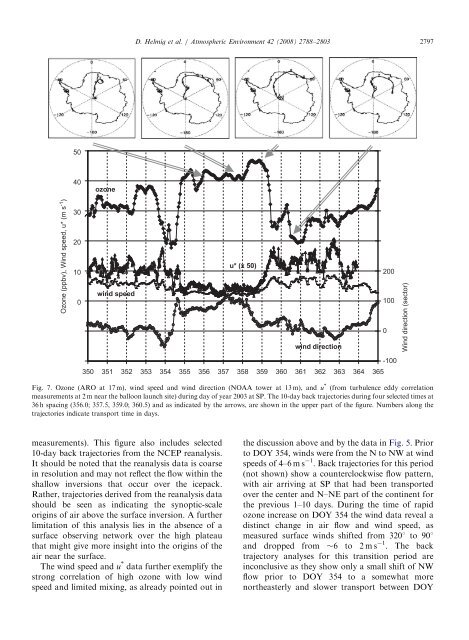
Fig. 7. Ozone (ARO <strong>at</strong> 17 m), w<strong>in</strong>d speed and w<strong>in</strong>d direction (NOAA tower <strong>at</strong> 13 m), and u * (from turbulence eddy correl<strong>at</strong>ion<br />
measurements <strong>at</strong> 2 m near <strong>the</strong> balloon launch site) dur<strong>in</strong>g day of year 2003 <strong>at</strong> SP. The 10-day back trajectories dur<strong>in</strong>g four selected times <strong>at</strong><br />
36 h spac<strong>in</strong>g (356.0; 357.5, 359.0; 360.5) and as <strong>in</strong>dic<strong>at</strong>ed by <strong>the</strong> arrows, are shown <strong>in</strong> <strong>the</strong> upper part of <strong>the</strong> figure. Numbers along <strong>the</strong><br />
trajectories <strong>in</strong>dic<strong>at</strong>e transport time <strong>in</strong> days.<br />
-100<br />
measurements). This figure also <strong>in</strong>cludes selected<br />
10-day back trajectories from <strong>the</strong> NCEP reanalysis.<br />
It should be noted th<strong>at</strong> <strong>the</strong> reanalysis d<strong>at</strong>a is coarse<br />
<strong>in</strong> resolution and may not reflect <strong>the</strong> flow with<strong>in</strong> <strong>the</strong><br />
shallow <strong>in</strong>versions th<strong>at</strong> occur over <strong>the</strong> icepack.<br />
Ra<strong>the</strong>r, trajectories derived from <strong>the</strong> reanalysis d<strong>at</strong>a<br />
should be seen as <strong>in</strong>dic<strong>at</strong><strong>in</strong>g <strong>the</strong> synoptic-scale<br />
orig<strong>in</strong>s of air above <strong>the</strong> surface <strong>in</strong>version. A fur<strong>the</strong>r<br />
limit<strong>at</strong>ion of this analysis lies <strong>in</strong> <strong>the</strong> absence of a<br />
surface observ<strong>in</strong>g network over <strong>the</strong> high pl<strong>at</strong>eau<br />
th<strong>at</strong> might give more <strong>in</strong>sight <strong>in</strong>to <strong>the</strong> orig<strong>in</strong>s of <strong>the</strong><br />
air near <strong>the</strong> surface.<br />
The w<strong>in</strong>d speed and u * d<strong>at</strong>a fur<strong>the</strong>r exemplify <strong>the</strong><br />
strong correl<strong>at</strong>ion of high <strong>ozone</strong> with low w<strong>in</strong>d<br />
speed and limited mix<strong>in</strong>g, as already po<strong>in</strong>ted out <strong>in</strong><br />
<strong>the</strong> discussion above and by <strong>the</strong> d<strong>at</strong>a <strong>in</strong> Fig. 5. Prior<br />
to DOY 354, w<strong>in</strong>ds were from <strong>the</strong> N to NW <strong>at</strong> w<strong>in</strong>d<br />
speeds of 4–6 m s 1 . Back trajectories for this period<br />
(not shown) show a counterclockwise flow p<strong>at</strong>tern,<br />
with air arriv<strong>in</strong>g <strong>at</strong> SP th<strong>at</strong> had been transported<br />
over <strong>the</strong> center and N–NE part of <strong>the</strong> cont<strong>in</strong>ent for<br />
<strong>the</strong> previous 1–10 days. Dur<strong>in</strong>g <strong>the</strong> time of rapid<br />
<strong>ozone</strong> <strong>in</strong>crease on DOY 354 <strong>the</strong> w<strong>in</strong>d d<strong>at</strong>a reveal a<br />
dist<strong>in</strong>ct change <strong>in</strong> air flow and w<strong>in</strong>d speed, as<br />
measured surface w<strong>in</strong>ds shifted from 3201 to 901<br />
and dropped from 6 to 2ms 1 . The back<br />
trajectory analyses for this transition period are<br />
<strong>in</strong>conclusive as <strong>the</strong>y show only a small shift of NW<br />
flow prior to DOY 354 to a somewh<strong>at</strong> more<br />
nor<strong>the</strong>asterly and slower transport between DOY