Elevated ozone in the boundary layer at South Pole - Doug Davis
Elevated ozone in the boundary layer at South Pole - Doug Davis
Elevated ozone in the boundary layer at South Pole - Doug Davis

You also want an ePaper? Increase the reach of your titles
YUMPU automatically turns print PDFs into web optimized ePapers that Google loves.
2798<br />
ARTICLE IN PRESS<br />
D. Helmig et al. / Atmospheric Environment 42 (2008) 2788–2803<br />
354.5–357.5. Dur<strong>in</strong>g <strong>the</strong> enhanced <strong>ozone</strong> period,<br />
w<strong>in</strong>ds rema<strong>in</strong>ed calm with cont<strong>in</strong>u<strong>in</strong>g easterly flow<br />
near <strong>the</strong> surface. Interest<strong>in</strong>gly, dur<strong>in</strong>g <strong>the</strong> tail end of<br />
<strong>the</strong> <strong>in</strong>creased <strong>ozone</strong> period, while <strong>the</strong> w<strong>in</strong>d direction<br />
shifted back from easterly to nor<strong>the</strong>rly w<strong>in</strong>ds and<br />
w<strong>in</strong>d speeds <strong>in</strong>creased gradually, <strong>ozone</strong> <strong>in</strong>creased by<br />
ano<strong>the</strong>r 5 ppbv and rema<strong>in</strong>ed elev<strong>at</strong>ed <strong>at</strong> this level<br />
for about a day. Here, <strong>the</strong> trajectories show th<strong>at</strong><br />
dur<strong>in</strong>g DOY 358 transport shifted for about one<br />
day from <strong>the</strong> previously prevail<strong>in</strong>g nor<strong>the</strong>rly flow<br />
towards a circular p<strong>at</strong>tern where air th<strong>at</strong> reached SP<br />
had resided <strong>in</strong> <strong>the</strong> area to <strong>the</strong> SE of SP for 2–4 days.<br />
On DOY 360.5 trajectories shift back towards <strong>the</strong><br />
previously dom<strong>in</strong><strong>at</strong><strong>in</strong>g nor<strong>the</strong>rly flow. Inspection of<br />
<strong>the</strong> raw<strong>in</strong>sonde d<strong>at</strong>a dur<strong>in</strong>g this period reveals th<strong>at</strong><br />
<strong>the</strong> w<strong>in</strong>d veers with height from easterly to nor<strong>the</strong>rly<br />
over <strong>the</strong> first 100–500 m. These d<strong>at</strong>a reaffirm th<strong>at</strong><br />
<strong>the</strong> trajectory analyses should be tre<strong>at</strong>ed with some<br />
caution because <strong>the</strong> reanalysis d<strong>at</strong>a may not reflect<br />
this f<strong>in</strong>e structure <strong>in</strong> <strong>the</strong> <strong>boundary</strong> <strong>layer</strong> w<strong>in</strong>d field.<br />
The entire December 2003 w<strong>in</strong>d direction and<br />
<strong>ozone</strong> records were used for a st<strong>at</strong>istical analysis of<br />
<strong>the</strong> rel<strong>at</strong>ionship between <strong>ozone</strong> and w<strong>in</strong>d direction.<br />
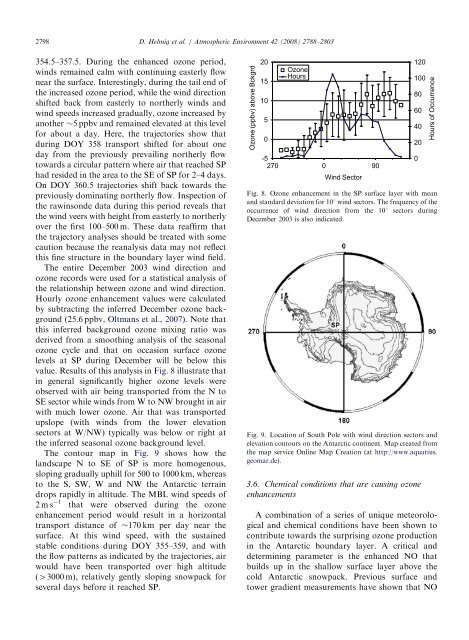
Hourly <strong>ozone</strong> enhancement values were calcul<strong>at</strong>ed<br />
by subtract<strong>in</strong>g <strong>the</strong> <strong>in</strong>ferred December <strong>ozone</strong> background<br />
(25.6 ppbv, Oltmans et al., 2007). Note th<strong>at</strong><br />
this <strong>in</strong>ferred background <strong>ozone</strong> mix<strong>in</strong>g r<strong>at</strong>io was<br />
derived from a smooth<strong>in</strong>g analysis of <strong>the</strong> seasonal<br />
<strong>ozone</strong> cycle and th<strong>at</strong> on occasion surface <strong>ozone</strong><br />
levels <strong>at</strong> SP dur<strong>in</strong>g December will be below this<br />
value. Results of this analysis <strong>in</strong> Fig. 8 illustr<strong>at</strong>e th<strong>at</strong><br />
<strong>in</strong> general significantly higher <strong>ozone</strong> levels were<br />
observed with air be<strong>in</strong>g transported from <strong>the</strong> N to<br />
SE sector while w<strong>in</strong>ds from W to NW brought <strong>in</strong> air<br />
with much lower <strong>ozone</strong>. Air th<strong>at</strong> was transported<br />
upslope (with w<strong>in</strong>ds from <strong>the</strong> lower elev<strong>at</strong>ion<br />
sectors <strong>at</strong> W/NW) typically was below or right <strong>at</strong><br />
<strong>the</strong> <strong>in</strong>ferred seasonal <strong>ozone</strong> background level.<br />
The contour map <strong>in</strong> Fig. 9 shows how <strong>the</strong><br />
landscape N to SE of SP is more homogenous,<br />
slop<strong>in</strong>g gradually uphill for 500 to 1000 km, whereas<br />
to <strong>the</strong> S, SW, W and NW <strong>the</strong> Antarctic terra<strong>in</strong><br />
drops rapidly <strong>in</strong> altitude. The MBL w<strong>in</strong>d speeds of<br />
2ms 1 th<strong>at</strong> were observed dur<strong>in</strong>g <strong>the</strong> <strong>ozone</strong><br />
enhancement period would result <strong>in</strong> a horizontal<br />
transport distance of 170 km per day near <strong>the</strong><br />
surface. At this w<strong>in</strong>d speed, with <strong>the</strong> susta<strong>in</strong>ed<br />
stable conditions dur<strong>in</strong>g DOY 355–359, and with<br />
<strong>the</strong> flow p<strong>at</strong>terns as <strong>in</strong>dic<strong>at</strong>ed by <strong>the</strong> trajectories, air<br />
would have been transported over high altitude<br />
(43000 m), rel<strong>at</strong>ively gently slop<strong>in</strong>g snowpack for<br />
several days before it reached SP.<br />
Ozone (ppbv) above Bckgrd<br />
20<br />
15<br />
10<br />
5<br />
0<br />
Ozone<br />
Hours<br />
-5<br />
270 0<br />
W<strong>in</strong>d Sector<br />
3.6. Chemical conditions th<strong>at</strong> are caus<strong>in</strong>g <strong>ozone</strong><br />
enhancements<br />
120<br />
100<br />
Fig. 8. Ozone enhancement <strong>in</strong> <strong>the</strong> SP surface <strong>layer</strong> with mean<br />
and standard devi<strong>at</strong>ion for 101 w<strong>in</strong>d sectors. The frequency of <strong>the</strong><br />
occurrence of w<strong>in</strong>d direction from <strong>the</strong> 101 sectors dur<strong>in</strong>g<br />
December 2003 is also <strong>in</strong>dic<strong>at</strong>ed.<br />
Fig. 9. Loc<strong>at</strong>ion of <strong>South</strong> <strong>Pole</strong> with w<strong>in</strong>d direction sectors and<br />
elev<strong>at</strong>ion contours on <strong>the</strong> Antarctic cont<strong>in</strong>ent. Map cre<strong>at</strong>ed from<br />
<strong>the</strong> map service Onl<strong>in</strong>e Map Cre<strong>at</strong>ion (<strong>at</strong> http://www.aquarius.<br />
geomar.de).<br />
A comb<strong>in</strong><strong>at</strong>ion of a series of unique meteorological<br />
and chemical conditions have been shown to<br />
contribute towards <strong>the</strong> surpris<strong>in</strong>g <strong>ozone</strong> production<br />
<strong>in</strong> <strong>the</strong> Antarctic <strong>boundary</strong> <strong>layer</strong>. A critical and<br />
determ<strong>in</strong><strong>in</strong>g parameter is <strong>the</strong> enhanced NO th<strong>at</strong><br />
builds up <strong>in</strong> <strong>the</strong> shallow surface <strong>layer</strong> above <strong>the</strong><br />
cold Antarctic snowpack. Previous surface and<br />
tower gradient measurements have shown th<strong>at</strong> NO<br />
90<br />
80<br />
60<br />
40<br />
20<br />
0<br />
Hours of Occurrence