Elevated ozone in the boundary layer at South Pole - Doug Davis
Elevated ozone in the boundary layer at South Pole - Doug Davis
Elevated ozone in the boundary layer at South Pole - Doug Davis

You also want an ePaper? Increase the reach of your titles
YUMPU automatically turns print PDFs into web optimized ePapers that Google loves.
2790<br />
ARTICLE IN PRESS<br />
D. Helmig et al. / Atmospheric Environment 42 (2008) 2788–2803<br />
barometric pressure and temper<strong>at</strong>ure measurement<br />
of <strong>the</strong> radiosonde and te<strong>the</strong>rsonde us<strong>in</strong>g <strong>the</strong> hypsometric<br />
rel<strong>at</strong>ionship. All flight d<strong>at</strong>a, <strong>in</strong>clud<strong>in</strong>g launch<br />
time, apex time, touchdown time and maximum<br />
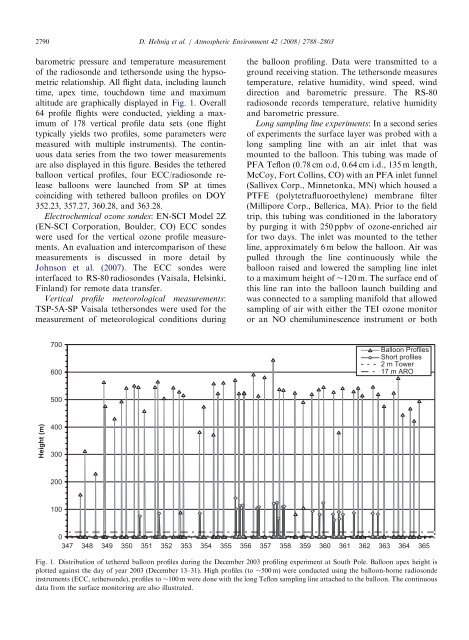
altitude are graphically displayed <strong>in</strong> Fig. 1. Overall<br />
64 profile flights were conducted, yield<strong>in</strong>g a maximum<br />
of 178 vertical profile d<strong>at</strong>a sets (one flight<br />
typically yields two profiles, some parameters were<br />
measured with multiple <strong>in</strong>struments). The cont<strong>in</strong>uous<br />
d<strong>at</strong>a series from <strong>the</strong> two tower measurements<br />
are also displayed <strong>in</strong> this figure. Besides <strong>the</strong> te<strong>the</strong>red<br />
balloon vertical profiles, four ECC/radiosonde release<br />
balloons were launched from SP <strong>at</strong> times<br />
co<strong>in</strong>cid<strong>in</strong>g with te<strong>the</strong>red balloon profiles on DOY<br />
352.23, 357.27, 360.28, and 363.28.<br />
Electrochemical <strong>ozone</strong> sondes: EN-SCI Model 2Z<br />
(EN-SCI Corpor<strong>at</strong>ion, Boulder, CO) ECC sondes<br />
were used for <strong>the</strong> vertical <strong>ozone</strong> profile measurements.<br />
An evalu<strong>at</strong>ion and <strong>in</strong>tercomparison of <strong>the</strong>se<br />
measurements is discussed <strong>in</strong> more detail by<br />
Johnson et al. (2007). The ECC sondes were<br />
<strong>in</strong>terfaced to RS-80 radiosondes (Vaisala, Hels<strong>in</strong>ki,<br />
F<strong>in</strong>land) for remote d<strong>at</strong>a transfer.<br />
Vertical profile meteorological measurements:<br />
TSP-5A-SP Vaisala te<strong>the</strong>rsondes were used for <strong>the</strong><br />
measurement of meteorological conditions dur<strong>in</strong>g<br />
<strong>the</strong> balloon profil<strong>in</strong>g. D<strong>at</strong>a were transmitted to a<br />
ground receiv<strong>in</strong>g st<strong>at</strong>ion. The te<strong>the</strong>rsonde measures<br />
temper<strong>at</strong>ure, rel<strong>at</strong>ive humidity, w<strong>in</strong>d speed, w<strong>in</strong>d<br />
direction and barometric pressure. The RS-80<br />
radiosonde records temper<strong>at</strong>ure, rel<strong>at</strong>ive humidity<br />
and barometric pressure.<br />
Long sampl<strong>in</strong>g l<strong>in</strong>e experiments: In a second series<br />
of experiments <strong>the</strong> surface <strong>layer</strong> was probed with a<br />
long sampl<strong>in</strong>g l<strong>in</strong>e with an air <strong>in</strong>let th<strong>at</strong> was<br />
mounted to <strong>the</strong> balloon. This tub<strong>in</strong>g was made of<br />
PFA Teflon (0.78 cm o.d, 0.64 cm i.d., 135 m length,<br />
McCoy, Fort Coll<strong>in</strong>s, CO) with an PFA <strong>in</strong>let funnel<br />
(Sallivex Corp., M<strong>in</strong>netonka, MN) which housed a<br />
PTFE (polytetrafluoroethylene) membrane filter<br />
(Millipore Corp., Bellerica, MA). Prior to <strong>the</strong> field<br />
trip, this tub<strong>in</strong>g was conditioned <strong>in</strong> <strong>the</strong> labor<strong>at</strong>ory<br />
by purg<strong>in</strong>g it with 250 ppbv of <strong>ozone</strong>-enriched air<br />
for two days. The <strong>in</strong>let was mounted to <strong>the</strong> te<strong>the</strong>r<br />
l<strong>in</strong>e, approxim<strong>at</strong>ely 6 m below <strong>the</strong> balloon. Air was<br />
pulled through <strong>the</strong> l<strong>in</strong>e cont<strong>in</strong>uously while <strong>the</strong><br />
balloon raised and lowered <strong>the</strong> sampl<strong>in</strong>g l<strong>in</strong>e <strong>in</strong>let<br />
to a maximum height of 120 m. The surface end of<br />
this l<strong>in</strong>e ran <strong>in</strong>to <strong>the</strong> balloon launch build<strong>in</strong>g and<br />
was connected to a sampl<strong>in</strong>g manifold th<strong>at</strong> allowed<br />
sampl<strong>in</strong>g of air with ei<strong>the</strong>r <strong>the</strong> TEI <strong>ozone</strong> monitor<br />
or an NO chemilum<strong>in</strong>escence <strong>in</strong>strument or both<br />
700<br />
600<br />
Balloon Profiles<br />
Short profiles<br />
2 m Tower<br />
17 m ARO<br />
500<br />
Height (m)<br />
400<br />
300<br />
200<br />
100<br />
0<br />
347 348 349 350 351 352 353 354 355 356 357 358 359 360 361 362 363 364 365<br />
Fig. 1. Distribution of te<strong>the</strong>red balloon profiles dur<strong>in</strong>g <strong>the</strong> December 2003 profil<strong>in</strong>g experiment <strong>at</strong> <strong>South</strong> <strong>Pole</strong>. Balloon apex height is<br />
plotted aga<strong>in</strong>st <strong>the</strong> day of year 2003 (December 13–31). High profiles (to 500 m) were conducted us<strong>in</strong>g <strong>the</strong> balloon-borne radiosonde<br />
<strong>in</strong>struments (ECC, te<strong>the</strong>rsonde), profiles to 100 m were done with <strong>the</strong> long Teflon sampl<strong>in</strong>g l<strong>in</strong>e <strong>at</strong>tached to <strong>the</strong> balloon. The cont<strong>in</strong>uous<br />
d<strong>at</strong>a from <strong>the</strong> surface monitor<strong>in</strong>g are also illustr<strong>at</strong>ed.