Elevated ozone in the boundary layer at South Pole - Doug Davis
Elevated ozone in the boundary layer at South Pole - Doug Davis
Elevated ozone in the boundary layer at South Pole - Doug Davis

You also want an ePaper? Increase the reach of your titles
YUMPU automatically turns print PDFs into web optimized ePapers that Google loves.
ARTICLE IN PRESS<br />
D. Helmig et al. / Atmospheric Environment 42 (2008) 2788–2803 2793<br />
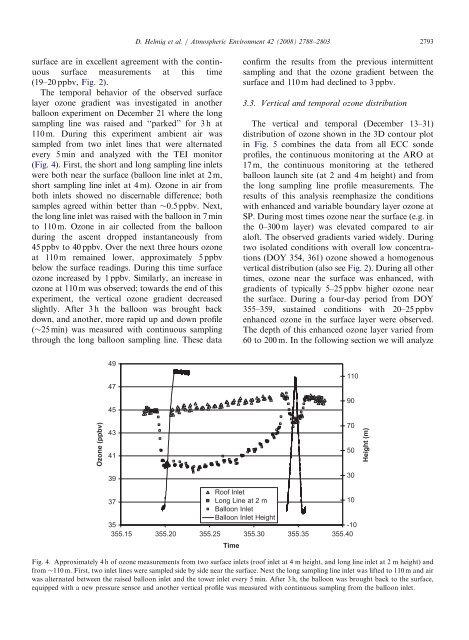
surface are <strong>in</strong> excellent agreement with <strong>the</strong> cont<strong>in</strong>uous<br />
surface measurements <strong>at</strong> this time<br />
(19–20 ppbv, Fig. 2).<br />
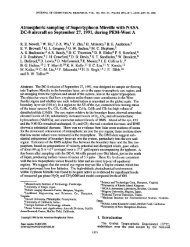
The temporal behavior of <strong>the</strong> observed surface<br />
<strong>layer</strong> <strong>ozone</strong> gradient was <strong>in</strong>vestig<strong>at</strong>ed <strong>in</strong> ano<strong>the</strong>r<br />
balloon experiment on December 21 where <strong>the</strong> long<br />
sampl<strong>in</strong>g l<strong>in</strong>e was raised and ‘‘parked’’ for 3 h <strong>at</strong><br />
110 m. Dur<strong>in</strong>g this experiment ambient air was<br />
sampled from two <strong>in</strong>let l<strong>in</strong>es th<strong>at</strong> were altern<strong>at</strong>ed<br />
every 5 m<strong>in</strong> and analyzed with <strong>the</strong> TEI monitor<br />
(Fig. 4). First, <strong>the</strong> short and long sampl<strong>in</strong>g l<strong>in</strong>e <strong>in</strong>lets<br />
were both near <strong>the</strong> surface (balloon l<strong>in</strong>e <strong>in</strong>let <strong>at</strong> 2 m,<br />
short sampl<strong>in</strong>g l<strong>in</strong>e <strong>in</strong>let <strong>at</strong> 4 m). Ozone <strong>in</strong> air from<br />
both <strong>in</strong>lets showed no discernable difference; both<br />
samples agreed with<strong>in</strong> better than 0.5 ppbv. Next,<br />
<strong>the</strong> long l<strong>in</strong>e <strong>in</strong>let was raised with <strong>the</strong> balloon <strong>in</strong> 7 m<strong>in</strong><br />
to 110 m. Ozone <strong>in</strong> air collected from <strong>the</strong> balloon<br />
dur<strong>in</strong>g <strong>the</strong> ascent dropped <strong>in</strong>stantaneously from<br />
45 ppbv to 40 ppbv. Over <strong>the</strong> next three hours <strong>ozone</strong><br />
<strong>at</strong> 110 m rema<strong>in</strong>ed lower, approxim<strong>at</strong>ely 5 ppbv<br />
below <strong>the</strong> surface read<strong>in</strong>gs. Dur<strong>in</strong>g this time surface<br />
<strong>ozone</strong> <strong>in</strong>creased by 1 ppbv. Similarly, an <strong>in</strong>crease <strong>in</strong><br />
<strong>ozone</strong> <strong>at</strong> 110 m was observed; towards <strong>the</strong> end of this<br />
experiment, <strong>the</strong> vertical <strong>ozone</strong> gradient decreased<br />
slightly. After 3 h <strong>the</strong> balloon was brought back<br />
down, and ano<strong>the</strong>r, more rapid up and down profile<br />
(25 m<strong>in</strong>) was measured with cont<strong>in</strong>uous sampl<strong>in</strong>g<br />
through <strong>the</strong> long balloon sampl<strong>in</strong>g l<strong>in</strong>e. These d<strong>at</strong>a<br />
confirm <strong>the</strong> results from <strong>the</strong> previous <strong>in</strong>termittent<br />
sampl<strong>in</strong>g and th<strong>at</strong> <strong>the</strong> <strong>ozone</strong> gradient between <strong>the</strong><br />
surface and 110 m had decl<strong>in</strong>ed to 3 ppbv.<br />
3.3. Vertical and temporal <strong>ozone</strong> distribution<br />
The vertical and temporal (December 13–31)<br />
distribution of <strong>ozone</strong> shown <strong>in</strong> <strong>the</strong> 3D contour plot<br />
<strong>in</strong> Fig. 5 comb<strong>in</strong>es <strong>the</strong> d<strong>at</strong>a from all ECC sonde<br />
profiles, <strong>the</strong> cont<strong>in</strong>uous monitor<strong>in</strong>g <strong>at</strong> <strong>the</strong> ARO <strong>at</strong><br />
17 m, <strong>the</strong> cont<strong>in</strong>uous monitor<strong>in</strong>g <strong>at</strong> <strong>the</strong> te<strong>the</strong>red<br />
balloon launch site (<strong>at</strong> 2 and 4 m height) and from<br />
<strong>the</strong> long sampl<strong>in</strong>g l<strong>in</strong>e profile measurements. The<br />
results of this analysis reemphasize <strong>the</strong> conditions<br />
with enhanced and variable <strong>boundary</strong> <strong>layer</strong> <strong>ozone</strong> <strong>at</strong><br />
SP. Dur<strong>in</strong>g most times <strong>ozone</strong> near <strong>the</strong> surface (e.g. <strong>in</strong><br />
<strong>the</strong> 0–300 m <strong>layer</strong>) was elev<strong>at</strong>ed compared to air<br />
aloft. The observed gradients varied widely. Dur<strong>in</strong>g<br />
two isol<strong>at</strong>ed conditions with overall low concentr<strong>at</strong>ions<br />
(DOY 354, 361) <strong>ozone</strong> showed a homogenous<br />
vertical distribution (also see Fig. 2). Dur<strong>in</strong>g all o<strong>the</strong>r<br />
times, <strong>ozone</strong> near <strong>the</strong> surface was enhanced, with<br />
gradients of typically 5–25 ppbv higher <strong>ozone</strong> near<br />
<strong>the</strong> surface. Dur<strong>in</strong>g a four-day period from DOY<br />
355–359, susta<strong>in</strong>ed conditions with 20–25 ppbv<br />
enhanced <strong>ozone</strong> <strong>in</strong> <strong>the</strong> surface <strong>layer</strong> were observed.<br />
The depth of this enhanced <strong>ozone</strong> <strong>layer</strong> varied from<br />
60 to 200 m. In <strong>the</strong> follow<strong>in</strong>g section we will analyze<br />
49<br />
47<br />
45<br />
110<br />
90<br />
Ozone (ppbv)<br />
43<br />
41<br />
70<br />
50<br />
Height (m)<br />
39<br />
30<br />
Roof Inlet<br />
37<br />
Long L<strong>in</strong>e <strong>at</strong> 2 m<br />
10<br />
Balloon Inlet<br />
Balloon Inlet Height<br />
35<br />
-10<br />
355.15 355.20 355.25 355.30 355.35 355.40<br />
Time<br />
Fig. 4. Approxim<strong>at</strong>ely 4 h of <strong>ozone</strong> measurements from two surface <strong>in</strong>lets (roof <strong>in</strong>let <strong>at</strong> 4 m height, and long l<strong>in</strong>e <strong>in</strong>let <strong>at</strong> 2 m height) and<br />
from 110 m. First, two <strong>in</strong>let l<strong>in</strong>es were sampled side by side near <strong>the</strong> surface. Next <strong>the</strong> long sampl<strong>in</strong>g l<strong>in</strong>e <strong>in</strong>let was lifted to 110 m and air<br />
was altern<strong>at</strong>ed between <strong>the</strong> raised balloon <strong>in</strong>let and <strong>the</strong> tower <strong>in</strong>let every 5 m<strong>in</strong>. After 3 h, <strong>the</strong> balloon was brought back to <strong>the</strong> surface,<br />
equipped with a new pressure sensor and ano<strong>the</strong>r vertical profile was measured with cont<strong>in</strong>uous sampl<strong>in</strong>g from <strong>the</strong> balloon <strong>in</strong>let.