Funds GreatLink - Great Eastern Life
Funds GreatLink - Great Eastern Life
Funds GreatLink - Great Eastern Life

You also want an ePaper? Increase the reach of your titles
YUMPU automatically turns print PDFs into web optimized ePapers that Google loves.
GREATLINK GLOBAL INTERSECTION FUND report as at 31 December 2005<br />
FUND FACTS<br />
Inception Date 25 March 2002<br />
Offer Price S$ 1.138<br />
Bid Price S$ 1.082<br />
Fund Size<br />
S$ 62.59 mil<br />
Fund Manager<br />
Lion Capital Management<br />
(wef 26 Sep 2005)<br />
Sub Manager<br />
Wellington International<br />
Management<br />
Bid-Offer Spread 5%<br />
Fund Management Fee<br />
1.50% p.a.<br />
Valuation Frequency<br />
Daily<br />
Currency of Fund<br />
Singapore Dollar<br />
CPF Approved<br />
CPFIS – OA<br />
Risk Category<br />
Higher Risk / Broadly Diversified<br />
Mercer Fund Rating as at 31 Dec 2005 ★★★★<br />
S&P Fund Stars as at 31 Dec 2005 ★★<br />
FUND OBJECTIVE & INVESTMENT STRATEGY<br />
The Fund’s objective is to provide long-term total returns<br />
consistently in excess of the MSCI World Index while controlling<br />
the tracking risk relative to benchmark.<br />
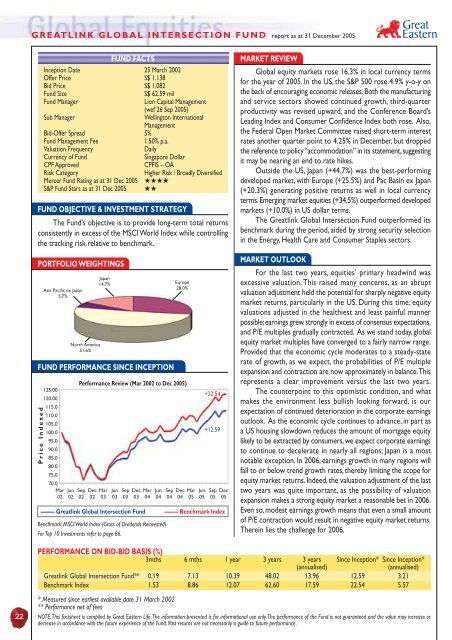
PORTFOLIO WEIGHTINGS<br />
Asia Pacific ex Japan<br />
5.7%<br />
North America<br />
51.6%<br />
Japan<br />
14.7%<br />
FUND PERFORMANCE SINCE INCEPTION<br />
Price Indexed<br />
Europe<br />
28.0%<br />
Performance Review (Mar 2002 to Dec 2005)<br />
125.00<br />
+22.54<br />
120.00<br />
115.0<br />
110.0<br />
105.0<br />
100.0<br />
+12.59<br />
95.0<br />
90.0<br />
85.0<br />
80.0<br />
75.0<br />
70.0<br />
Mar Jun Sep Dec Mar Jun Sep Dec Mar Jun Sep Dec Mar Jun Sep Dec<br />
02 02 02 02 03 03 03 03 04 04 04 04 05 05 05 05<br />
––––– <strong>Great</strong>link Global Intersection Fund ––––– Benchmark Index<br />
Benchmark: MSCI World Index (Gross of Dividends Reinvested)<br />
For Top 10 Investments refer to page 86.<br />
MARKET REVIEW<br />
Global equity markets rose 16.3% in local currency terms<br />
for the year of 2005. In the US, the S&P 500 rose 4.9% y-o-y on<br />
the back of encouraging economic releases. Both the manufacturing<br />
and service sectors showed continued growth, third-quarter<br />
productivity was revised upward, and the Conference Board’s<br />
Leading Index and Consumer Confidence Index both rose. Also,<br />
the Federal Open Market Committee raised short-term interest<br />
rates another quarter point to 4.25% in December, but dropped<br />
the reference to policy “accommodation” in its statement, suggesting<br />
it may be nearing an end to rate hikes.<br />
Outside the US, Japan (+44.7%) was the best-performing<br />
developed market, with Europe (+25.5%) and Pac Basin ex Japan<br />
(+20.3%) generating positive returns as well in local currency<br />
terms. Emerging market equities (+34.5%) outperformed developed<br />
markets (+10.0%) in US dollar terms.<br />
The <strong>Great</strong>link Global Intersection Fund outperformed its<br />
benchmark during the period, aided by strong security selection<br />
in the Energy, Health Care and Consumer Staples sectors.<br />
MARKET OUTLOOK<br />
For the last two years, equities’ primary headwind was<br />
excessive valuation. This raised many concerns, as an abrupt<br />
valuation adjustment held the potential for sharply negative equity<br />
market returns, particularly in the US. During this time, equity<br />
valuations adjusted in the healthiest and least painful manner<br />
possible; earnings grew strongly in excess of consensus expectations,<br />
and P/E multiples gradually contracted. As we stand today, global<br />
equity market multiples have converged to a fairly narrow range.<br />
Provided that the economic cycle moderates to a steady-state<br />
rate of growth, as we expect, the probabilities of P/E multiple<br />
expansion and contraction are now approximately in balance. This<br />
represents a clear improvement versus the last two years.<br />
The counterpoint to this optimistic condition, and what<br />
makes the environment less bullish looking forward, is our<br />
expectation of continued deterioration in the corporate earnings<br />
outlook. As the economic cycle continues to advance, in part as<br />
a US housing slowdown reduces the amount of mortgage equity<br />
likely to be extracted by consumers, we expect corporate earnings<br />
to continue to decelerate in nearly all regions; Japan is a most<br />
notable exception. In 2006, earnings growth in many regions will<br />
fall to or below trend growth rates, thereby limiting the scope for<br />
equity market returns. Indeed, the valuation adjustment of the last<br />
two years was quite important, as the possibility of valuation<br />
expansion makes a strong equity market a reasonable bet in 2006.<br />
Even so, modest earnings growth means that even a small amount<br />
of P/E contraction would result in negative equity market returns.<br />
Therein lies the challenge for 2006.<br />
22<br />
PERFORMANCE ON BID-BID BASIS (%)<br />
3mths 6 mths 1 year 3 years 3 years Since Inception* Since Inception*<br />
(annualised)<br />
(annualised)<br />
<strong>Great</strong>link Global Intersection Fund** 0.19 7.13 10.39 48.02 13.96 12.59 3.21<br />
Benchmark Index 1.53 8.86 12.07 62.60 17.59 22.54 5.57<br />
* Measured since earliest available date 31 March 2002<br />
** Performance net of fees<br />
NOTE: This factsheet is compiled by <strong>Great</strong> <strong>Eastern</strong> <strong>Life</strong>. The information presented is for informational use only. The performance of the Fund is not guaranteed and the value may increase or<br />
decrease in accordance with the future experience of the Fund. Past returns are not necessarily a guide to future performance.